Analyze slow queries from Google Cloud SQL instances
The new enhancement for our Chrome extension will allow Google Cloud SQL and EverSQL users to automatically visualize MySQL’s slow query log entries directly on the log viewer of Google Stackdriver. No configuration is needed other than configuring your database to actually log slow queries.
EverSQL’s extension will digest (locate similar patterns) any query entries you’ll browse through, it will visualize the queries in a timeline, will summarize metrics such as average execution duration, and will allow you to quickly optimize the queries using EverSQL Query Optimizer.
The downside of our approach – the extension will only be able to summarize the data you’re browsing through on StackDriver (as the full log file isn’t available all at once). If you’re looking to submit a full (or a group of) slow log file, visualize and optimize the queries, give EverSQL Query Optimizer a try.
How will it look like?
With the new extension installed, once the slow query log entries are presented on the screen, those entries will be automatically visualized in the top metric boxes, the timeline and in the queries container. The queries are “digested” by their fingerprints/patterns, so the same query pattern with different constants will only be presented once, to make sure you can focus on locating the slow queries and optimizing them, without drowning in a sea of data.

So how do I start?
First, let’s configure the Google Cloud SQL instance to log the slow queries to Stackdriver:
- Navigate to the Google Cloud SQL instance on Google Cloud’s dashboard.
- Under the Configuration section, click Edit Configuration, and then expand the Add Database Flags part.
- Add these new flags. Make sure you adjust the parameter long_query_time to the threshold you would like to measure slow queries by. For example, if long_query_time=3, all queries being executed for more than 3 seconds will be logged as slow queries.

The next and final step will be to install EverSQL’s Chrome extension – no configuration needed. Once you’re done, you can navigate to the Logging tab in Google Cloud,ד dashboard, and start scrolling through the logs, or navigating to a specific point in time where you suspect a performance-related incident occurred.
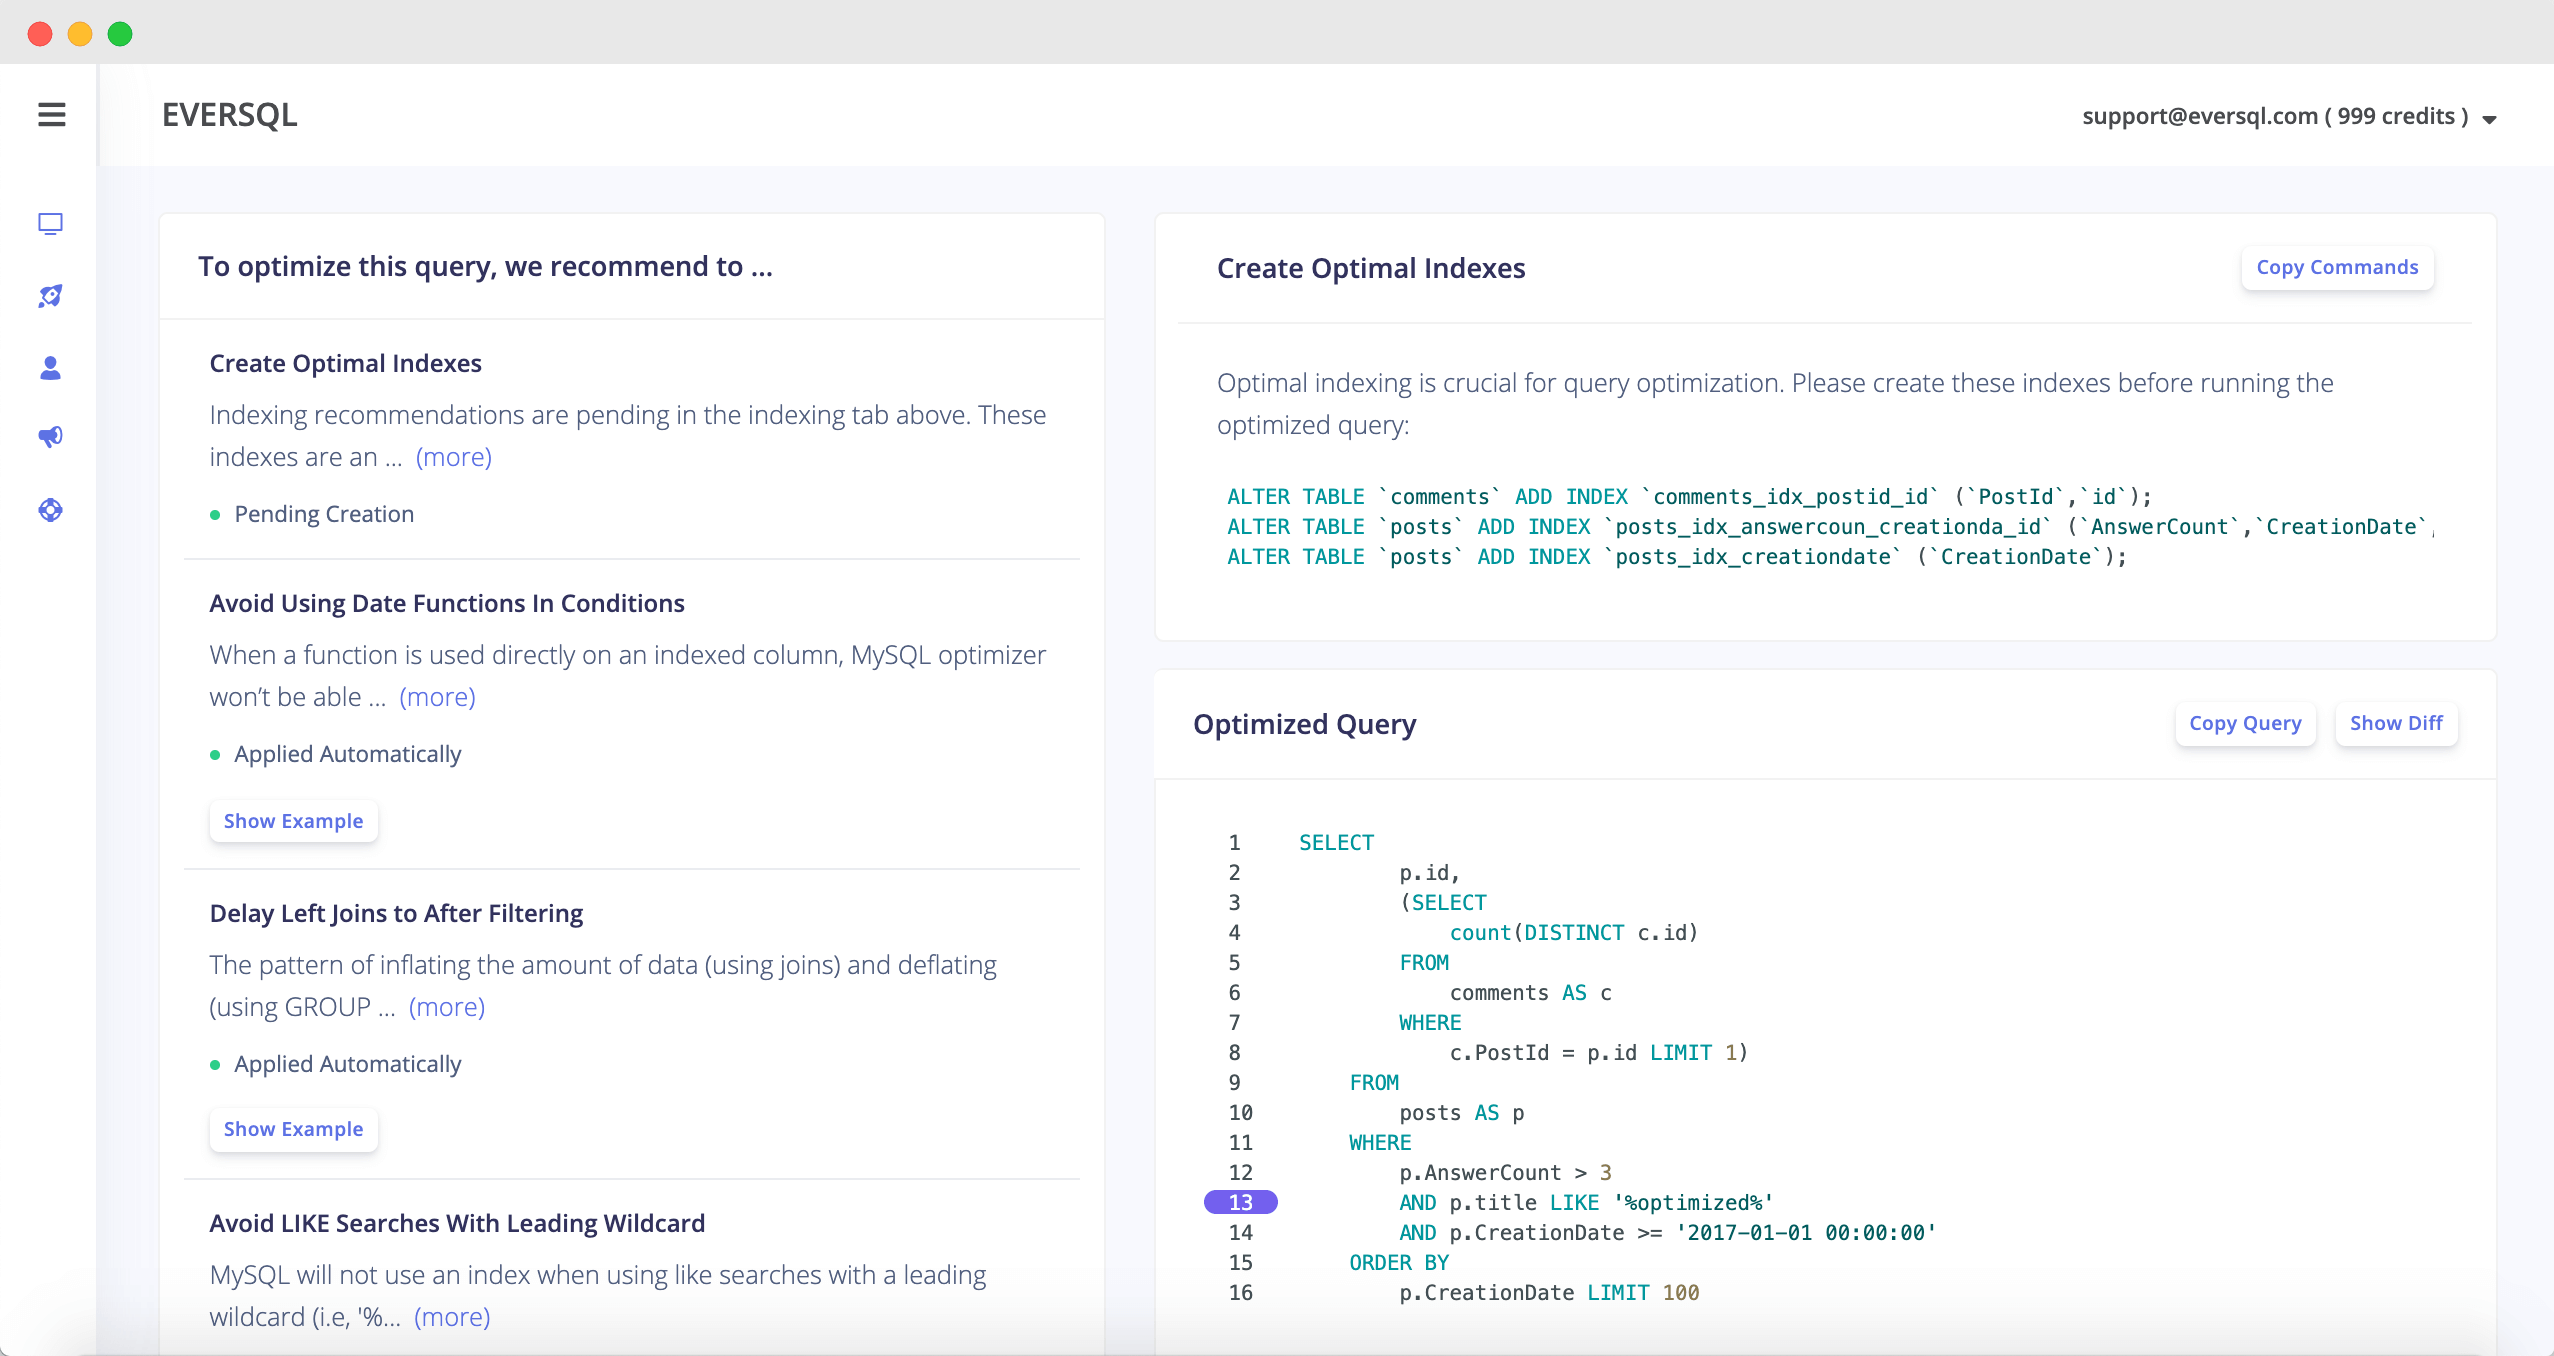
Once you found the queries you’d like to optimize, just click the Optimize with EverSQL button next to the query, and you’ll be prompted with the query optimization recommendations and the optimal indexing suggestions, as in this example:
Are there any alternatives?
Yes. If you’re looking to visualize slow query log entries from a Google Cloud SQL instance, another will be to implement that capability using Stackdriver’s metrics. That approach will allow you to look at a larger scope of data, but will require some configuration and unfortunately won’t allow you to visualize existing logs which were created before this new configuration was applied. I recommend to look at this great article by Google to read more about this approach.
Feedback is always appreciated
Feel free to reach out to hello@eversql.com with any questions or feedback you may have and we’ll be happy to chat.