Many of you may monitor their databases for different purposes. Beside alerting it is often good to also make some graphs from MySQL performance counters to see what is actually happening on your database.
The following graphs where made with our FromDual Performance Monitor for MySQL as a Service (MaaS) set-up. If you do not have the time to install a performance monitoring yourself please feel free to contact us for our MaaS solution.
Overview
First of all it is a good idea to have an overview of all the settings in you different databases and if they are compliant to your standards.
Here it looks like two of our databases are still running with Statement Bases Replication (SBR). Further the MySQL General Query Log is enabled which is non optimal for write performance and the default Storage Engine is still set to MyISAM which is not wanted in our case.
Image may be NSFW.
Clik here to view.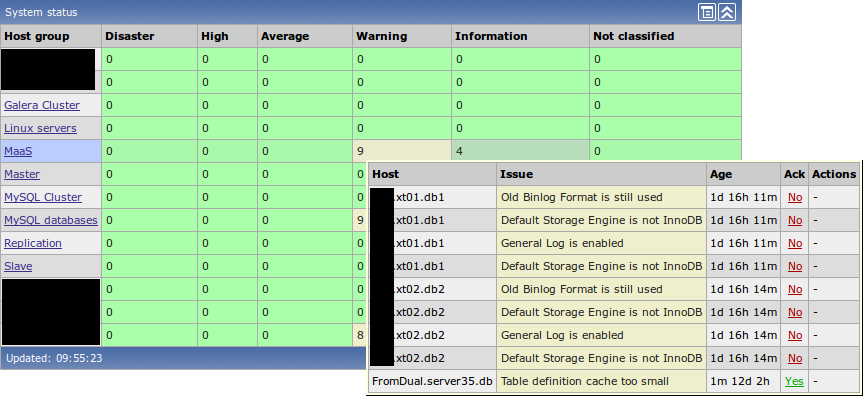
InnoDB
This server is mostly an InnoDB Server. We can see that we have some write traffic because the InnoDB Buffer Pool has constantly 15 - 20% of dirty pages. Further we see that we have a very constant level of dirty pages:
Image may be NSFW.
Clik here to view.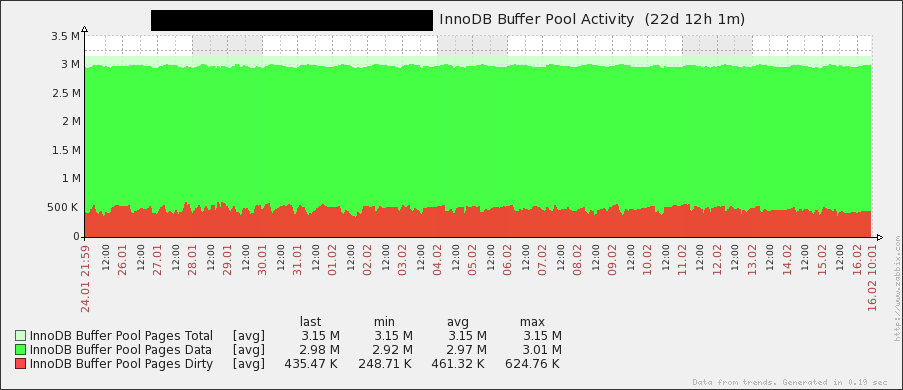
Here I guess, the database was restarted on Wednesday:
Image may be NSFW.
Clik here to view.
Read and write are here more or less equally high with some strong spikes:
Image may be NSFW.
Clik here to view.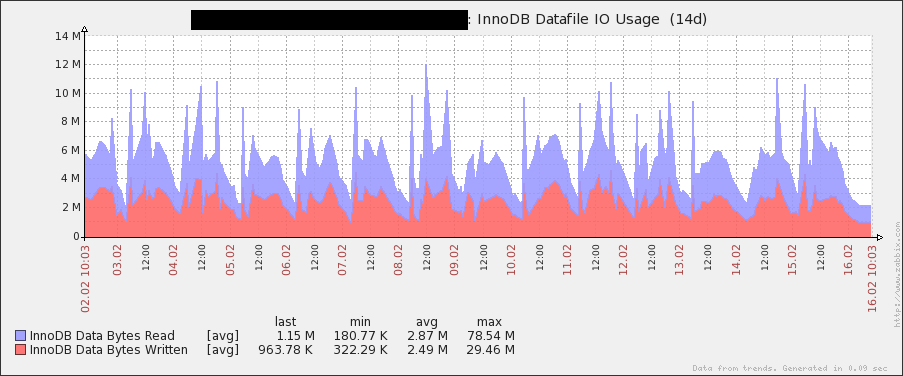
If we have a closer look we can see that one typical spike is always at 06:00 in the morning. It is read and write so it is possibly NOT a backup but more likely a reporting or maintenance job:
Image may be NSFW.
Clik here to view.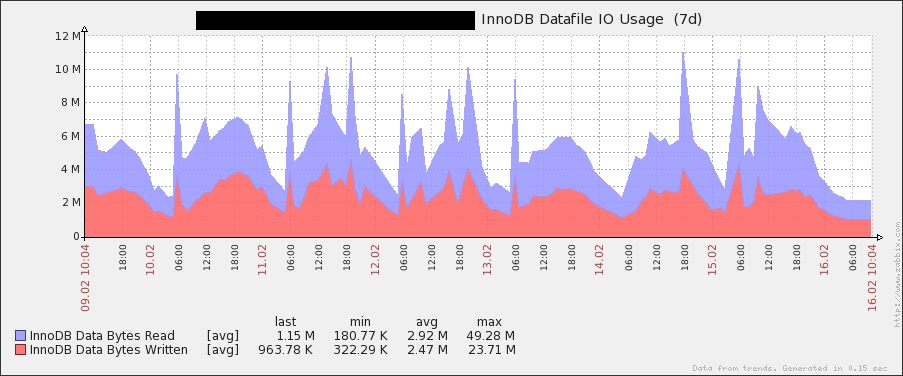
This system does mostly write with a heavy read phase during midnight:
Image may be NSFW.
Clik here to view.
The read starts at 23:00 and ends at 03:30. It could be some nightly reporting?
Image may be NSFW.
Clik here to view.
Extreme read and write spikes. Not good for a system that likes to have close to real time behavior:
Image may be NSFW.
Clik here to view.
The consequences we can see immediately, Locking:
Image may be NSFW.
Clik here to view.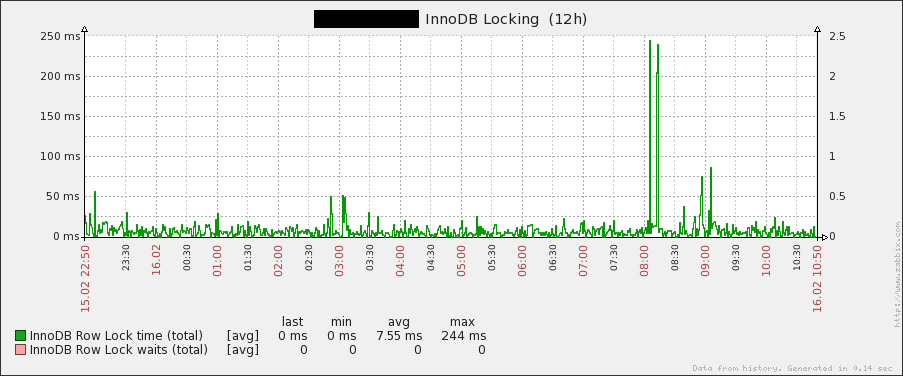
When we look at the InnoDB Locking we can see that this job at 06:00 in the morning causes some lockings. Up to 2.5 seconds. If this causes troubles we really have to investigate what is running at that time:
Image may be NSFW.
Clik here to view.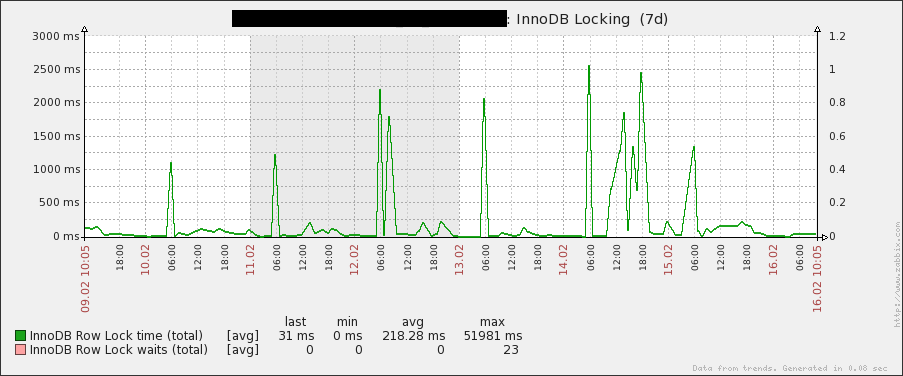
If we look at the last 14 days we can see a huge read spike some time ago, what has happened there? This has possibly influenced the whole system as well:
Image may be NSFW.
Clik here to view.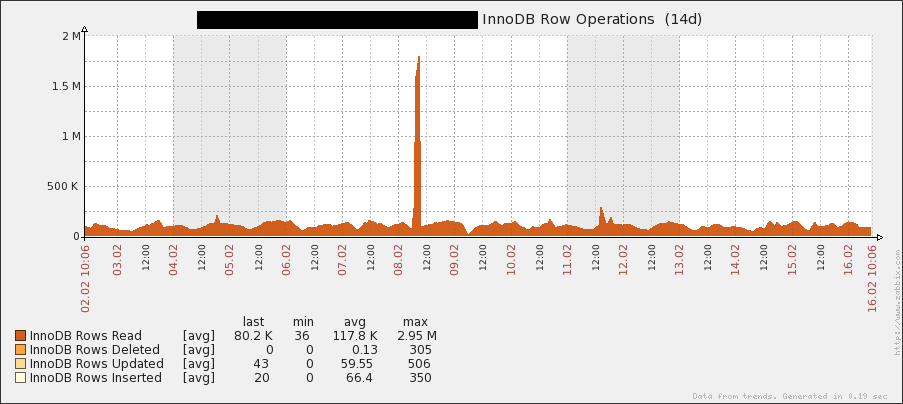
Here we have a special InnoDB read pattern. Can you see it? Every 3 hours at xx:30 it happens. We should try to find out what it is:
Image may be NSFW.
Clik here to view.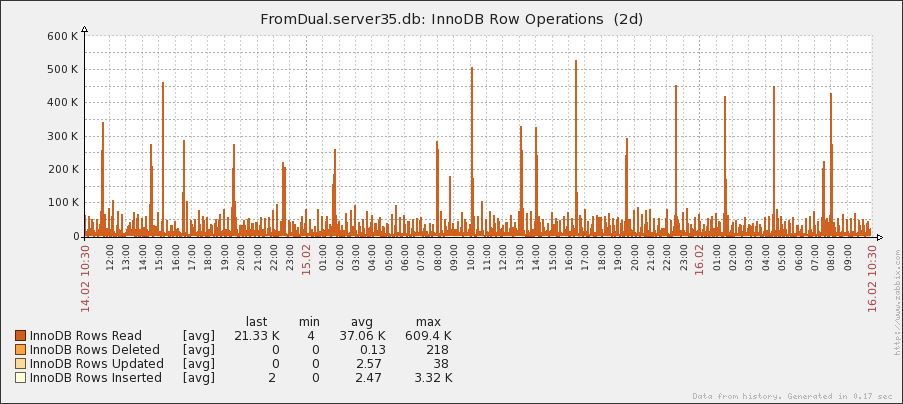
From time to time we can see some big transactions:
Image may be NSFW.
Clik here to view.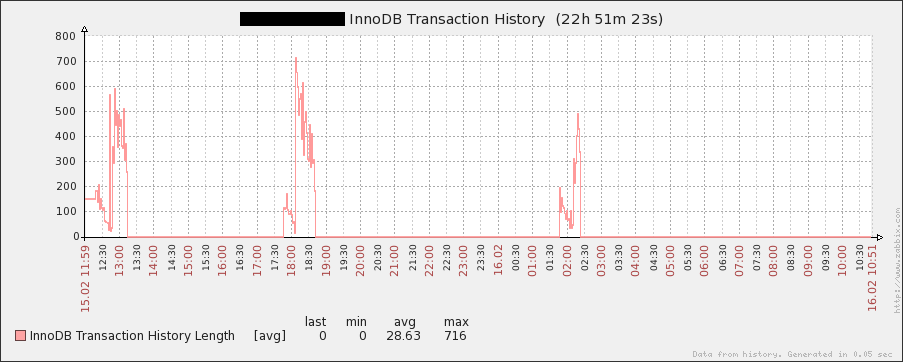
MyISAM
Currently and over the last few days our MyISAM key buffer was mostly empty. But the high water mark Key_blocks_used indicates that they were used in the past. So we should try to find out if this key buffer is still used and if not if we can free this memory (about 2.4 Gbyte):
Image may be NSFW.
Clik here to view.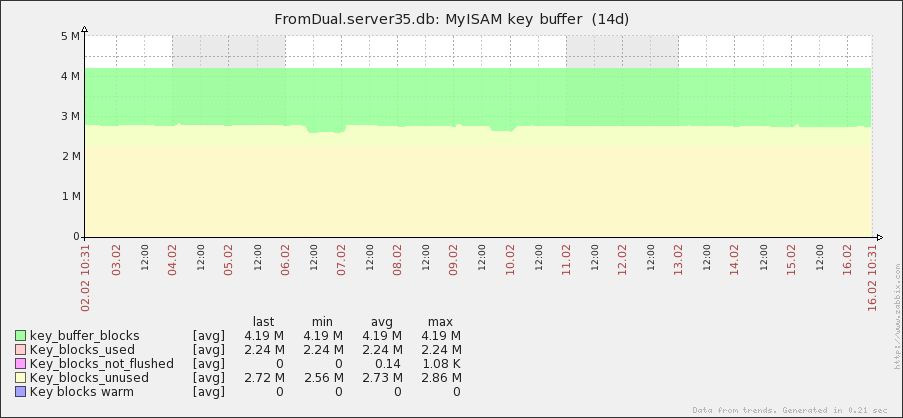
From time to time we see some MyISAM key reads from memory. This could be caused by MyISAM table indexes or by temporary tables gone to disk. So not really much MyISAM traffic at all and it is mostly happening during week days:
Image may be NSFW.
Clik here to view.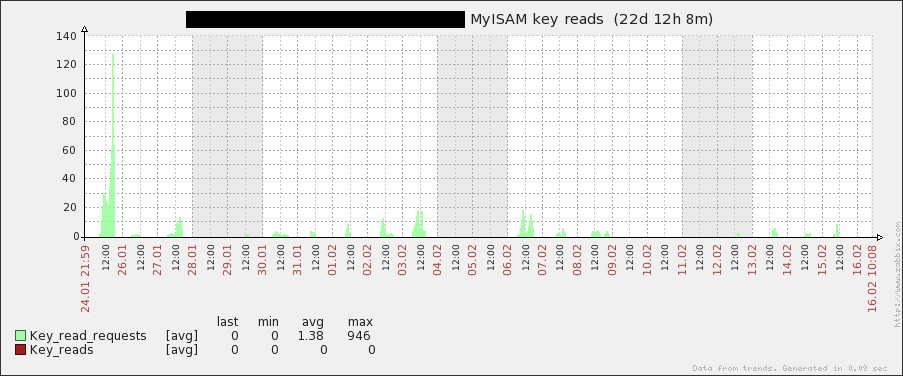
This is a MyISAM mostly system but never the less we do not have MyISAM table locking issues:
Image may be NSFW.
Clik here to view.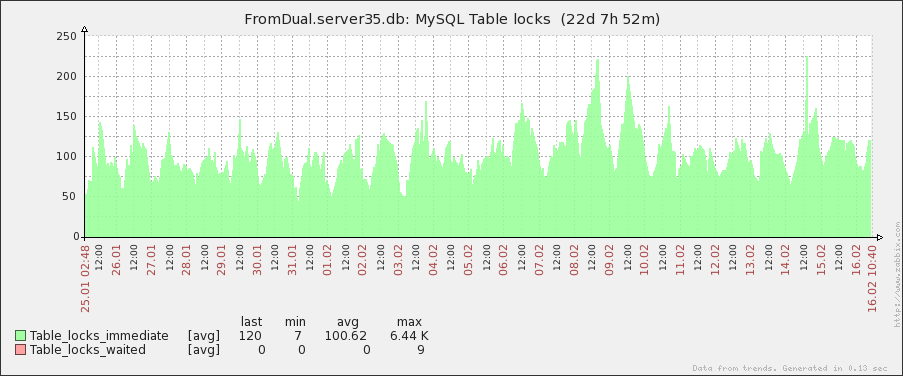
Connections
We are not far from hitting max_connections. So either we increase this value or we think about why we have so many connections open concurrently. On February 5th we had many concurrent running threads. That was surely not good for the whole system performance:
Image may be NSFW.
Clik here to view.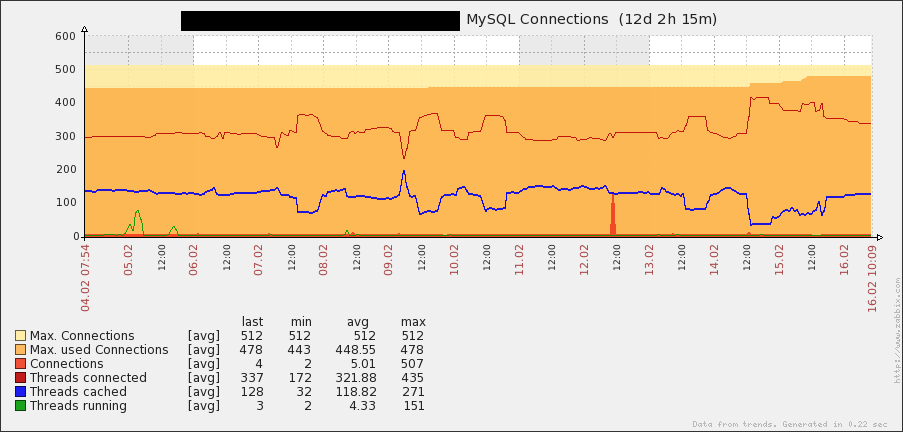
On February 12th there was possibly something wrong with the application: We see many aborted clients what never had before:
Image may be NSFW.
Clik here to view.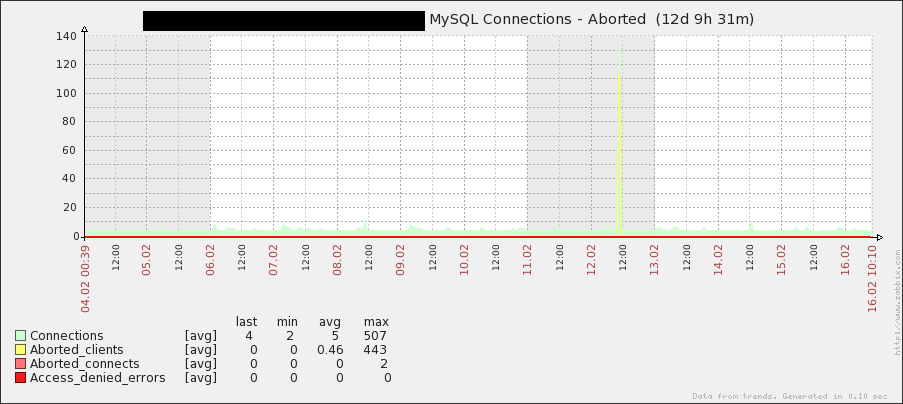
It looks like thread cache was always big enough:
Image may be NSFW.
Clik here to view.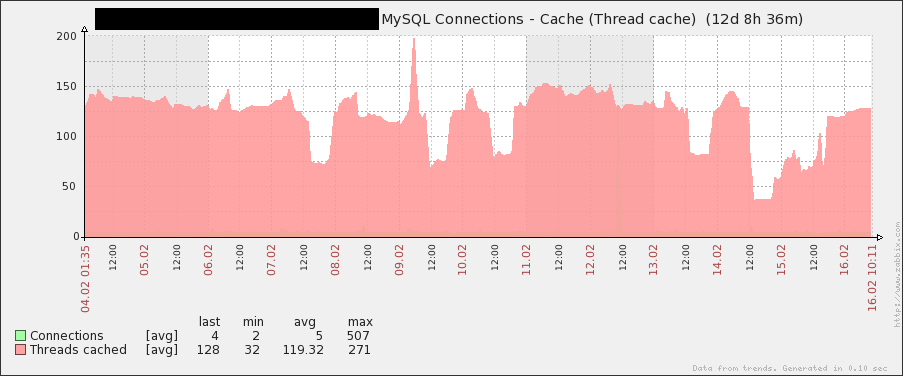
On this server we definitly had a problem and we hit the roof with the amount of connections. I am wondering if it would not be more useful to even lower max_connections here?
Image may be NSFW.
Clik here to view.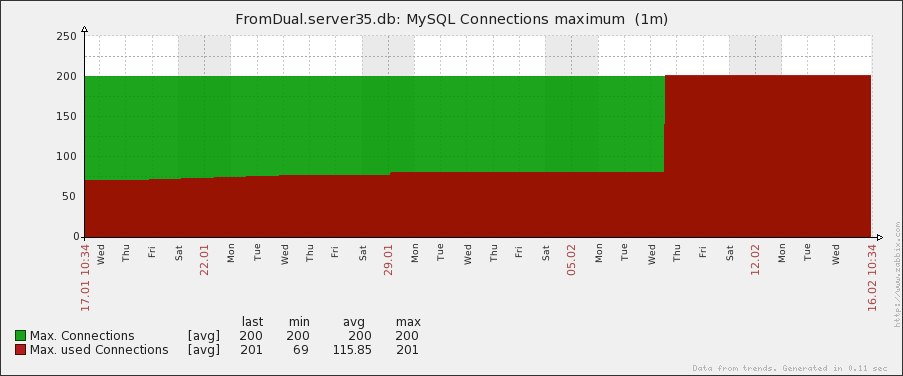
Network traffic
Network traffic was growing a bit last week but now is stable again. Our network should not have a problem with this load:
Image may be NSFW.
Clik here to view.
This is a read mostly database. The patter comes from sorts and handler_read_rnd (see below):
Image may be NSFW.
Clik here to view.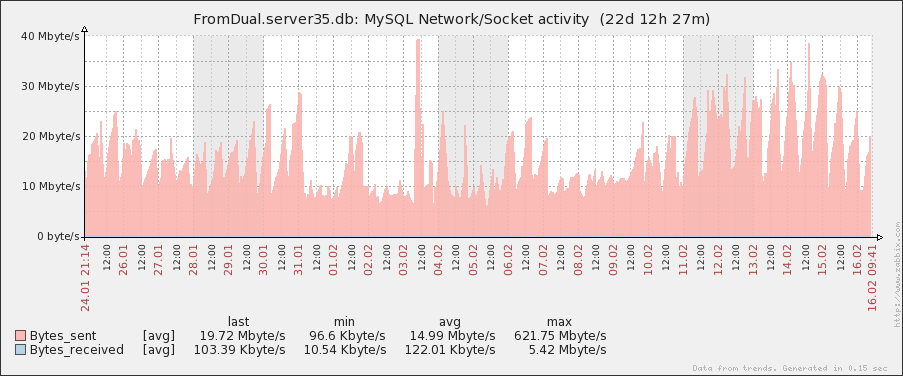
Handler Interface
Here we see that we do many handler_read_next and handler_read_rnd_next operations. This is equivalent to index range scans and full table scans. Our spike at February 11th seems to come from such an index range scan:
Image may be NSFW.
Clik here to view.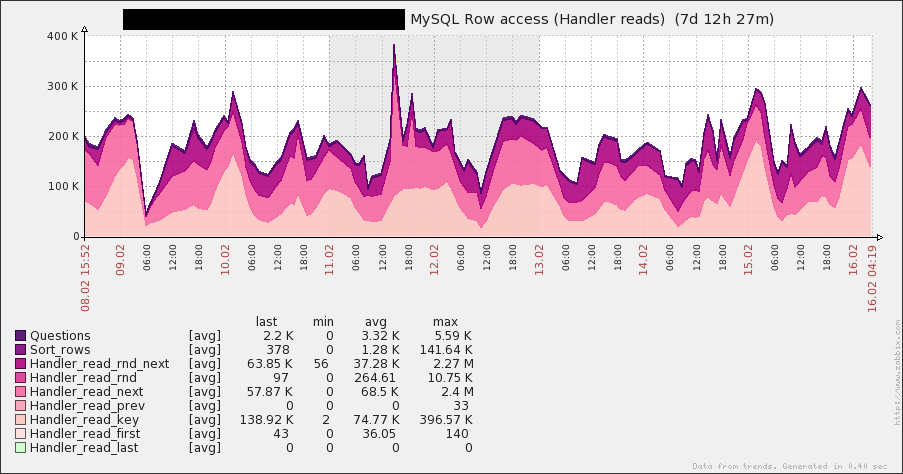
This server does mostly read by a full table scan! There is a huge potential for optimization so the server could cover more load if the queries were done more optimal:
Image may be NSFW.
Clik here to view.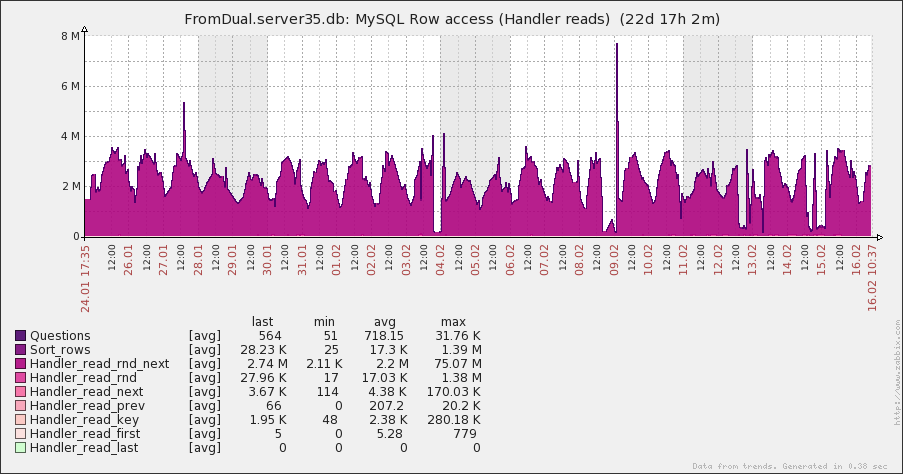
It seems there were some UPDATEs involved on 8th:
Image may be NSFW.
Clik here to view.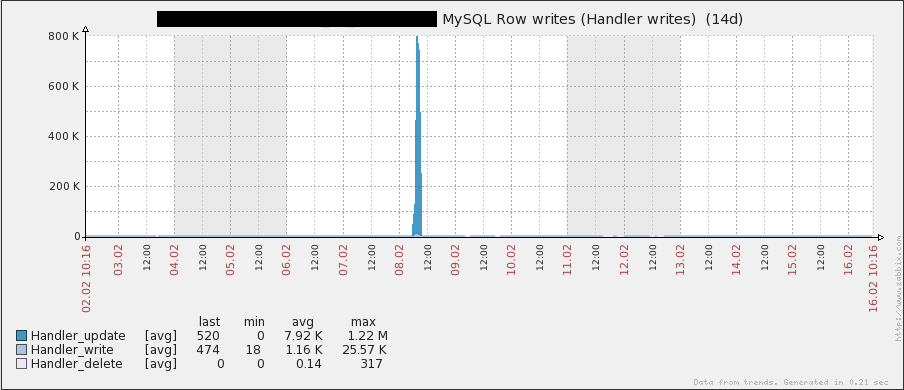
We see many INSERTs but few to no DELETEs. This means the database size is steadly growing. We should think about archiving old data?
Image may be NSFW.
Clik here to view.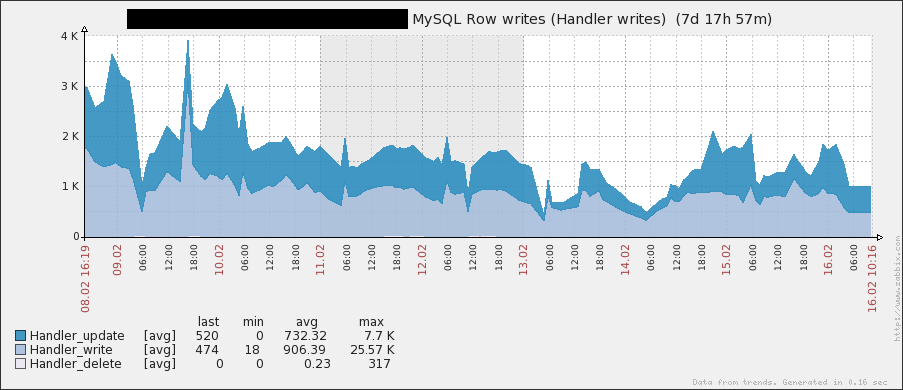
OK. This seems to be a maintenance job. Luckily it was set off-peak hours (08:00):
Image may be NSFW.
Clik here to view.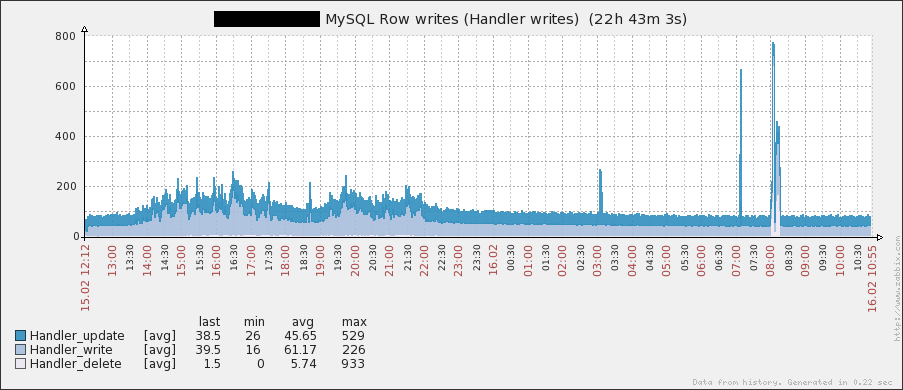
Somebody does evil things hear: handler_read_rnd is bad for performance. And it pretty much correlates with the network traffic from above:
Image may be NSFW.
Clik here to view.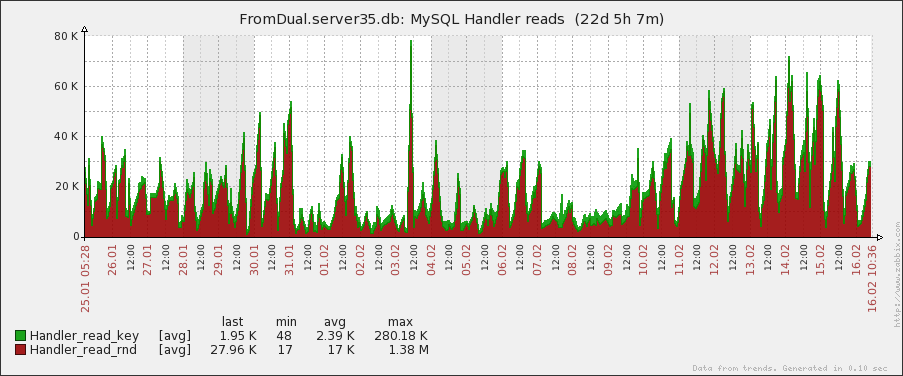
Sort
Sort behavior seems to have changed significantly on Monday. We should find out if application has released a new version:
Image may be NSFW.
Clik here to view.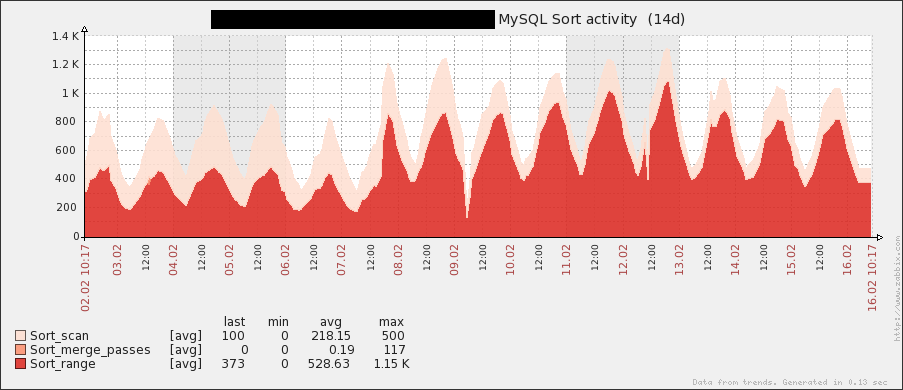
On this server we see some sort_merge_passes which is a sign of a too small sort buffer or just huge sorts:
Image may be NSFW.
Clik here to view.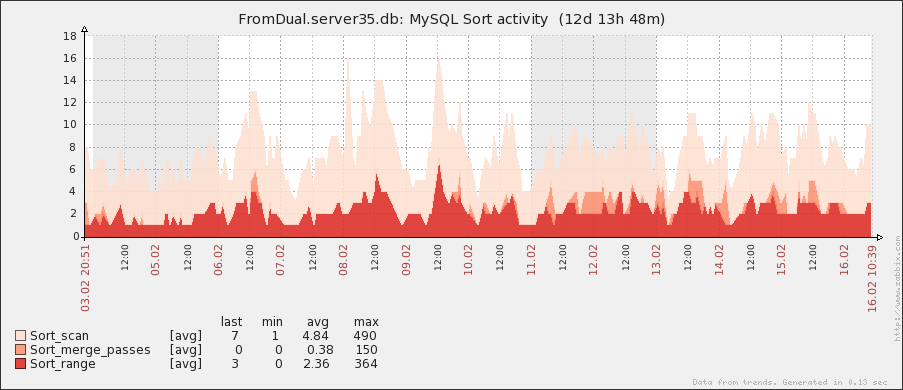
Queries
The majority of queries sent against this database are SELECT's:
Image may be NSFW.
Clik here to view.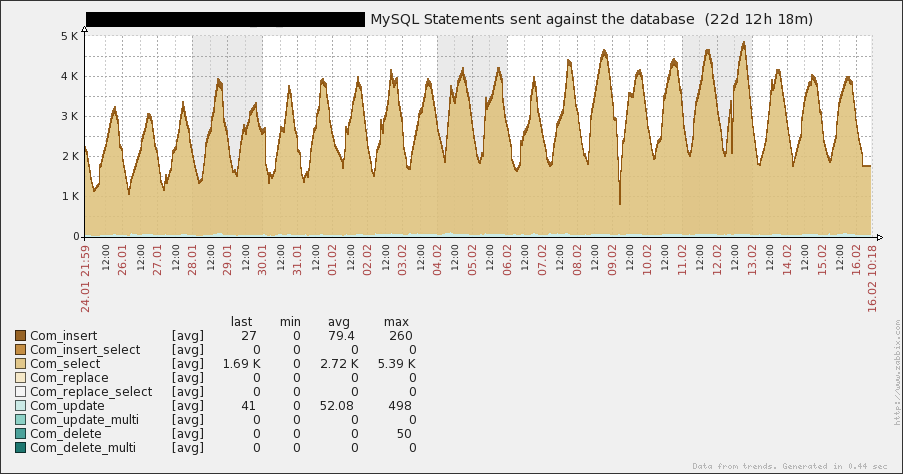
Temporary Tables
The use of temporary tables has changed. This is a sign again that something in the application was modified:
Image may be NSFW.
Clik here to view.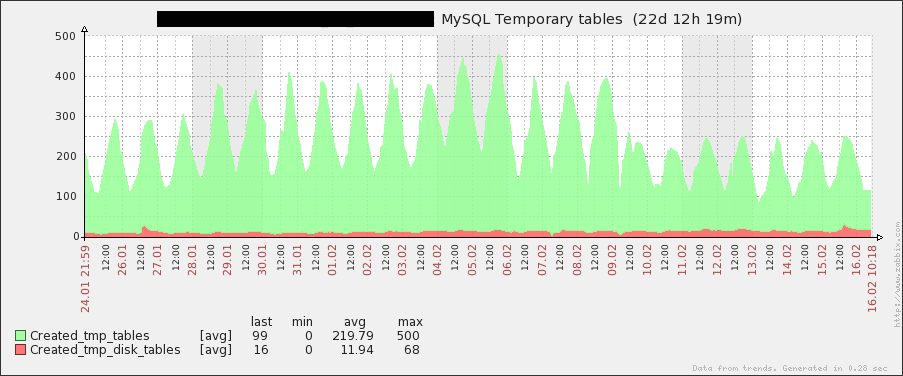
If we look a bit closer we can see that the use of temporary disk tables has increased. We should keep an eye on this:
Image may be NSFW.
Clik here to view.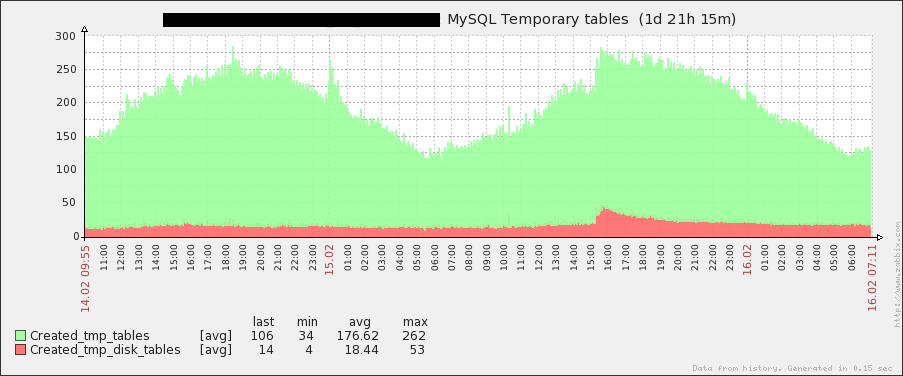
Here we most probably have a problem with temporary tables on disk. It happens quite periodical and predictable so we can investigate who causes those:
Image may be NSFW.
Clik here to view.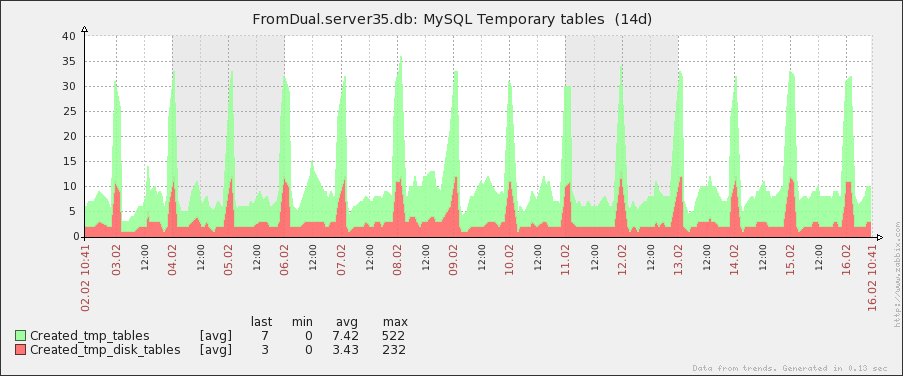
If you look closer at it we can see that it is a similar pattern as with the data reads from above:
Image may be NSFW.
Clik here to view.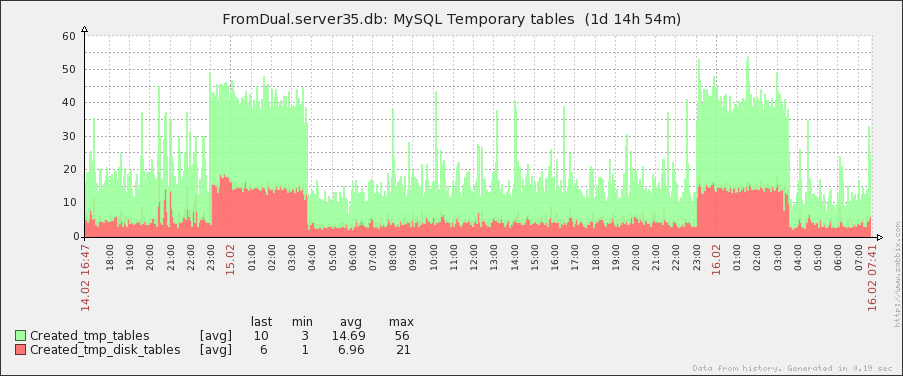
MySQL Process information
The number of page faults has changed dramatically over the weekend. So what was changed there?
Image may be NSFW.
Clik here to view.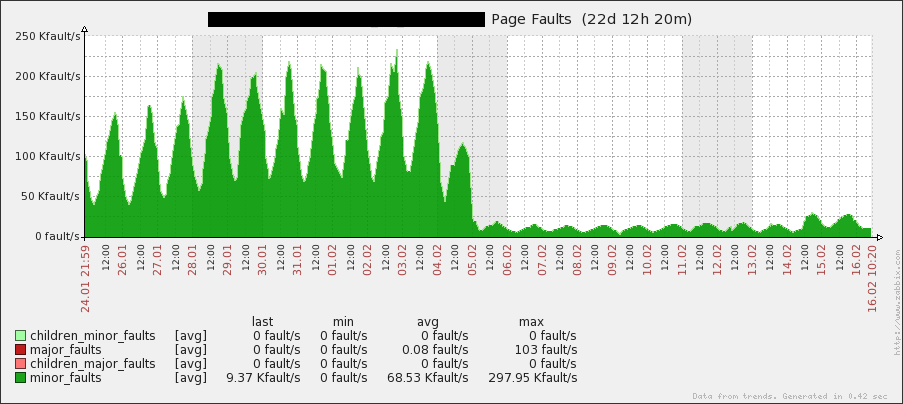
Query Cache
There are no query cache hits but Query Cache is enabled! There are several reasons for this. We should investigate or disable Query Cache at all:
Image may be NSFW.
Clik here to view.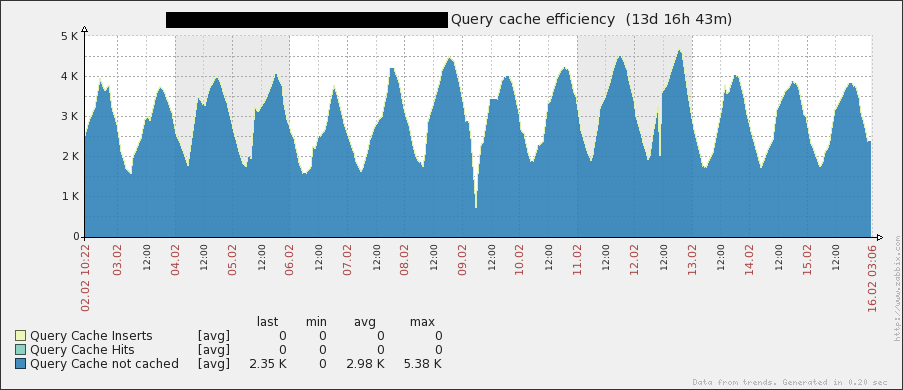
We have some low memory prunes. Shall we increase Query Cache size?
Image may be NSFW.
Clik here to view.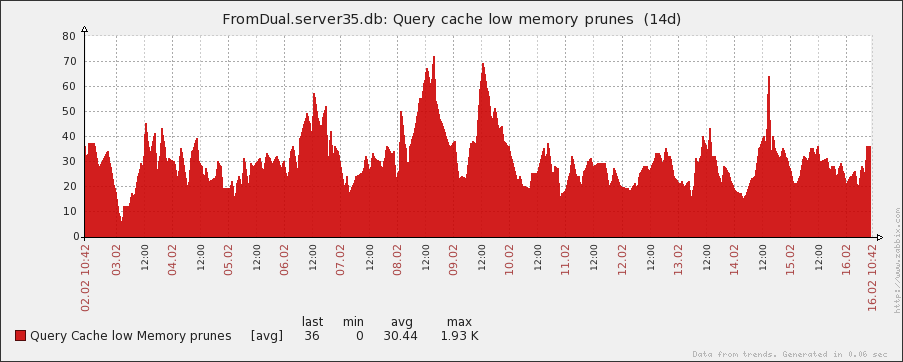
Hmmm. It is already quite big. Better to defragment it from time to time to get rid of the free memory:
Image may be NSFW.
Clik here to view.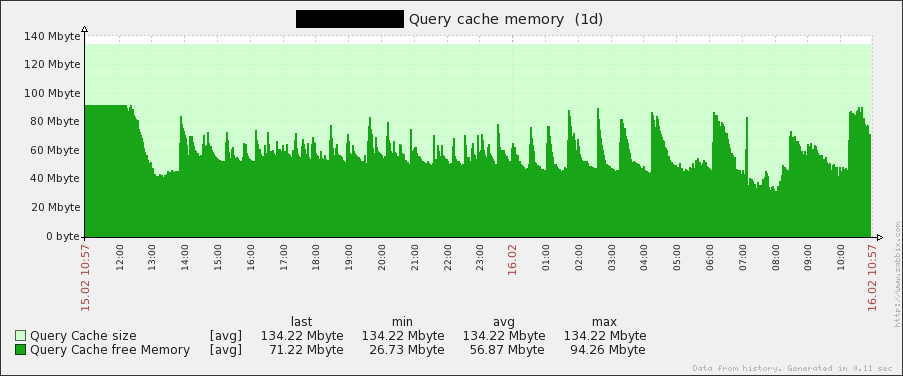
Table Definition Cache
The Table Definition Cache is much to big here. A value of 256 (default) would be far more than enough. Better to release the resources:
Image may be NSFW.
Clik here to view.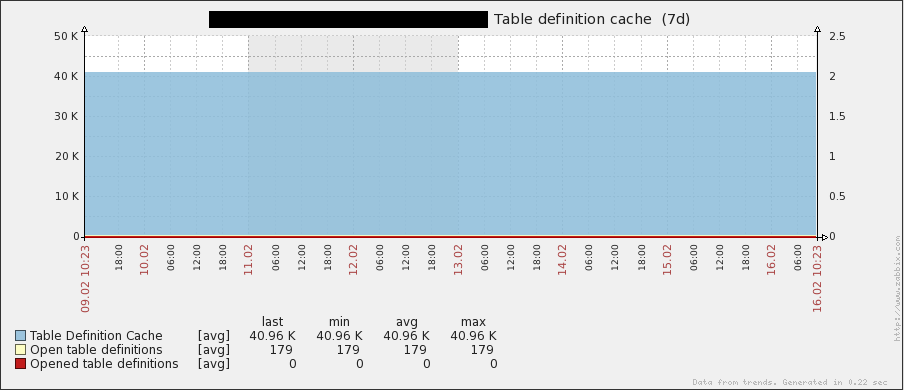
This is the opposite case. Here the Table Definition Cache is much too small at least when the job at 23:00 is running:
Image may be NSFW.
Clik here to view.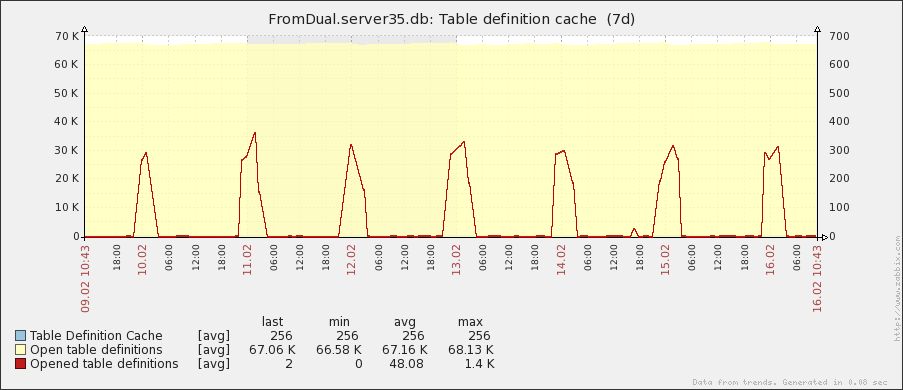
Table (Open) Cache
Same situation here with the Table Open Cache. A value of 3 - 4k would be enough. Better to release the resources. There are some cases known where a too big table cache causes performance issues:
Image may be NSFW.
Clik here to view.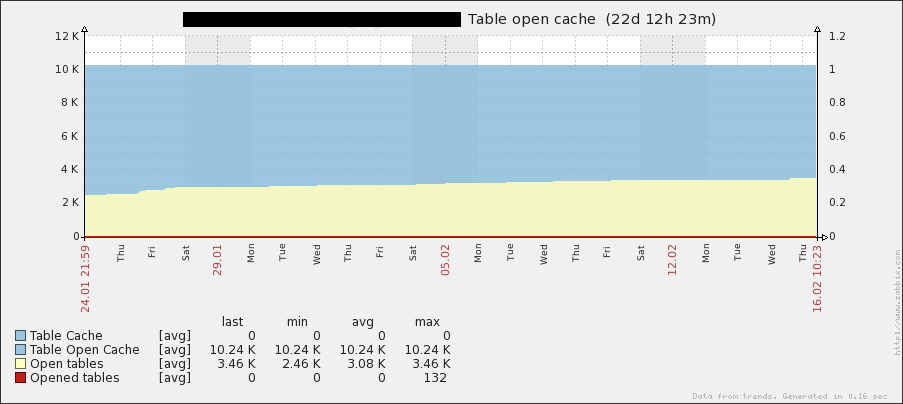
Same here. Too small at midnight jobs:
Image may be NSFW.
Clik here to view.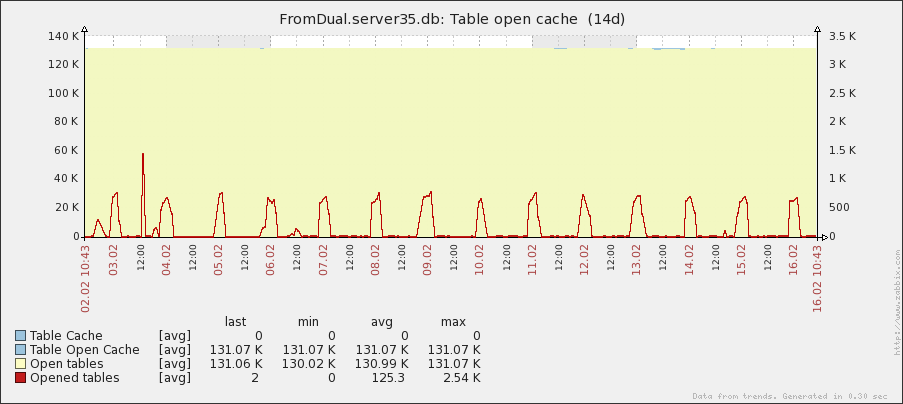
Binary logging (Master)
The Binary Log has a size of about 100 Mbyte (Debian/Ubuntu?) and is filled up every hour (ca. 25 kybte/s). During the night we have some less traffic, during day some more traffic:
Image may be NSFW.
Clik here to view.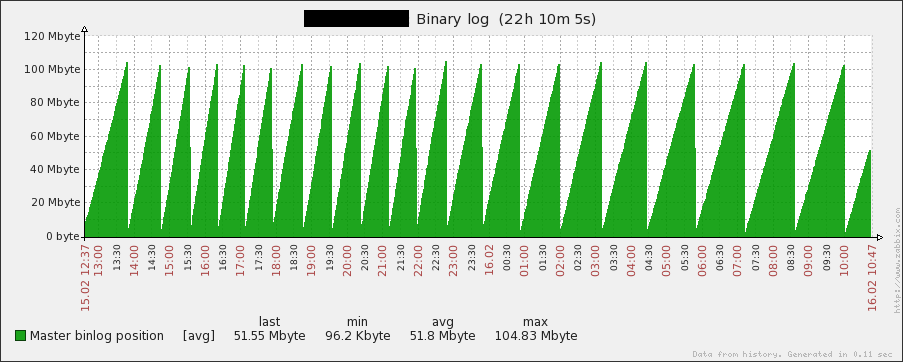
From time to time we have some spikes in binary log traffic. But binary log cache seems to be always big enough:
Image may be NSFW.
Clik here to view.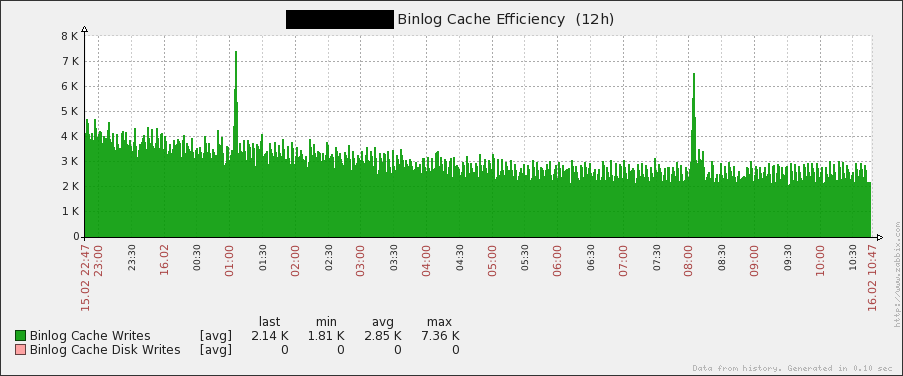
Replication Slave
The Slave was not lagging very often and only for short time:
Image may be NSFW.
Clik here to view.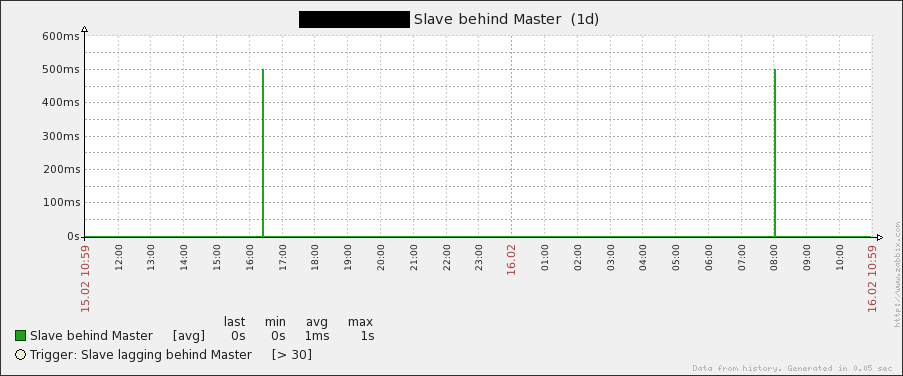
If you want such performance graphs as well from your system, just let us know!
PlanetMySQL Voting: Vote UP / Vote DOWN