Performance Schema (PFS) in MySQL 5.6 is coming yet more with many awesome new features. But, as it was already discussed in the past, enabling PFS instrumentation may create an additional overhead within your MySQL server, and as a result, decrease an overall performance.. The good news is that in MySQL 5.6 things become better and better ;-))
Well, you should understand as well, there is no miracle.. - some of most "hot" events within MySQL are happening over several millions(!) or tens/hundreds millions per second(!) -- so, it's sure, once such kind of event is traced, the overall overhead of the MySQL code may only be increased.. What is important that every instrumentation can be enabled or disabled dynamically, so you can go in depth progressively when tracing your events or bottlenecks, and stop instrumentation at any moment when it becomes critical..
However, since the current MySQL 5.6, Performance Schema is now enabled by default and gives you out-of-the-box some valuable data about your database load: query statements and table accesses. And some stuff (like mutexes or RW-locks instrumentation) should be explicitly enabled on MySQL start, otherwise will just remained ignored and guarantee to keep your server from potential unexpected overhead..
The following article is presenting the test results I've obtained on CPU-bound workloads while analyzing the performance impact of enabling PFS by default in MySQL 5.6 and the impact of default PFS instrumentation (as well some other instrumentations too ;-))
Test scenarios:
- Workload: Sysbench OLTP_RO, RO S-Ranges, dbSTRESS RO
- Concurrent users: 16, 32, .. 512
- Special tuning settings: innodb_spin_wait_delay= 12 / 96
- Server: X4470 32cores bi-thread 2300Mhz, 128GB RAM, OEL 6.2
Test cases:
- PFS off
- PFS on, but no instrumentation enabled (on+none)
- PFS on, default instrumentation enabled only (on+def)
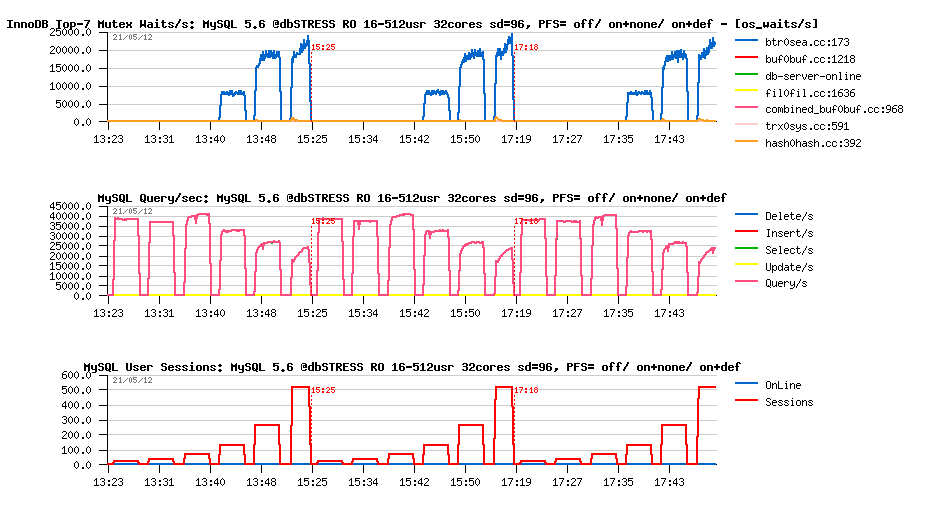
Sysbench OLTP_RO, innodb_spin_wait_delay=12 :
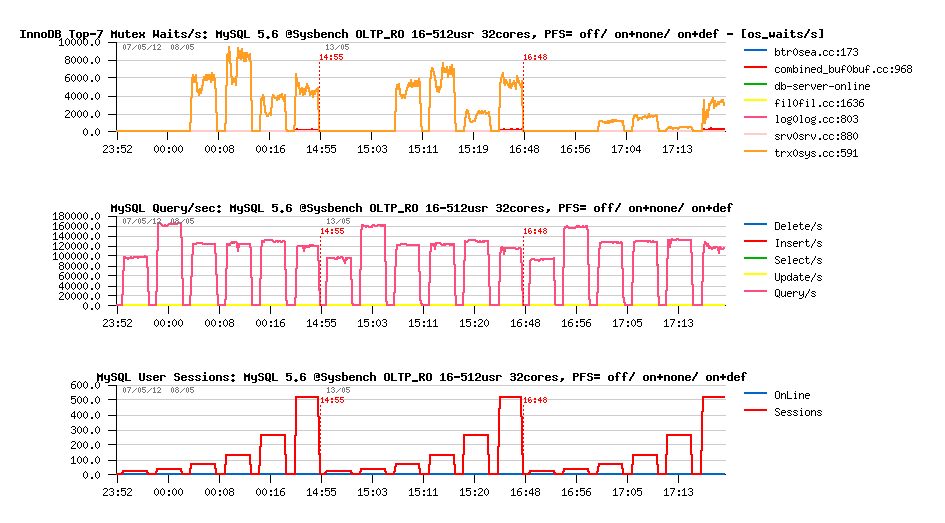
Observations :
- the overhead is near zero when PFS is enabled, but all instrumentations are remaining disabled..
- the overhead is 5% in worse case (16 users) when default PFS instrumentations is used, and near zero in most of other cases
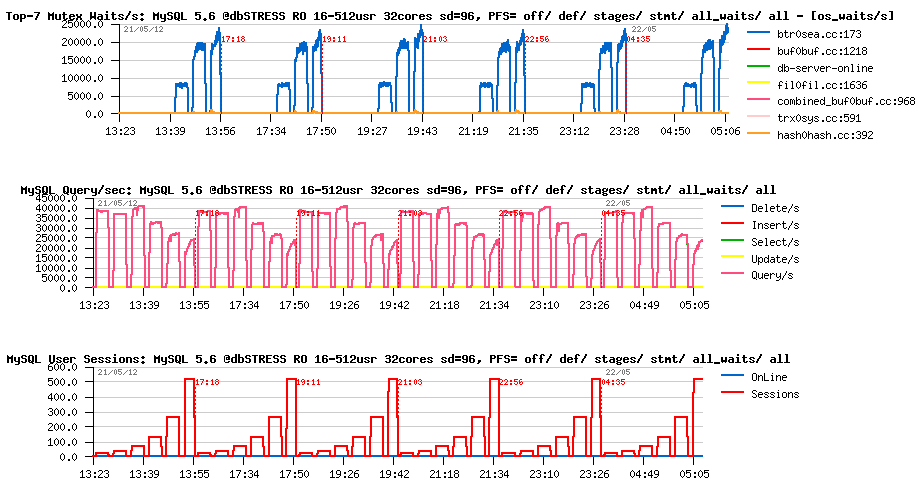
Sysbench RO S-Ranges, innodb_spin_wait_delay=12 :

Observations :
- near zero overhead..
dbSTRESS RO, innodb_spin_wait_delay=12 :
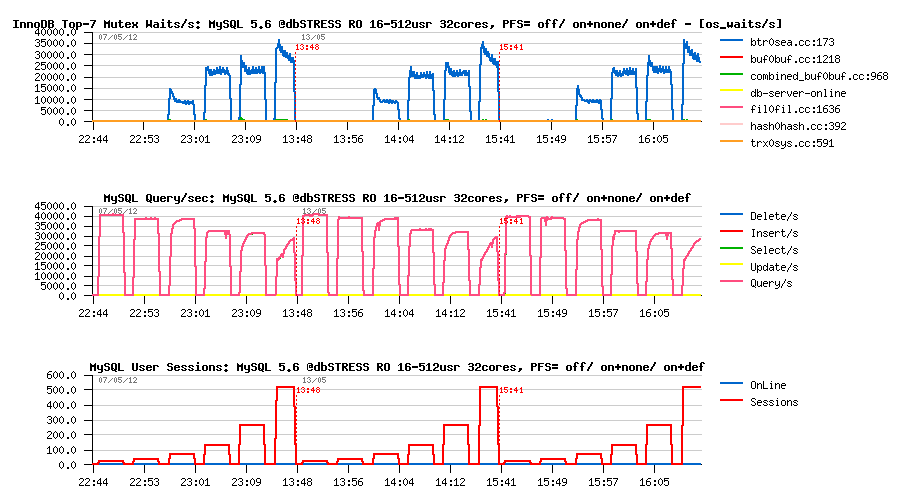
Observations :
- zero overhead..
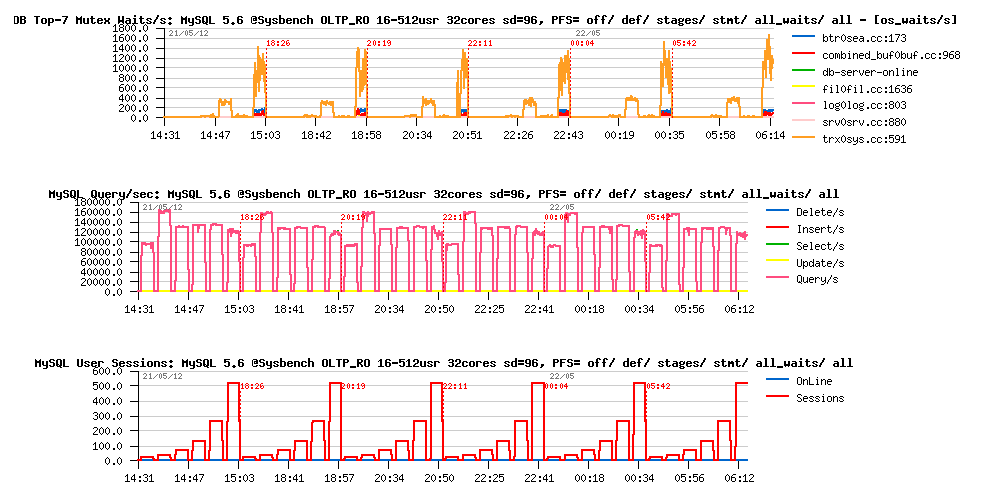
Sysbench OLTP_RO, innodb_spin_wait_delay=96 :
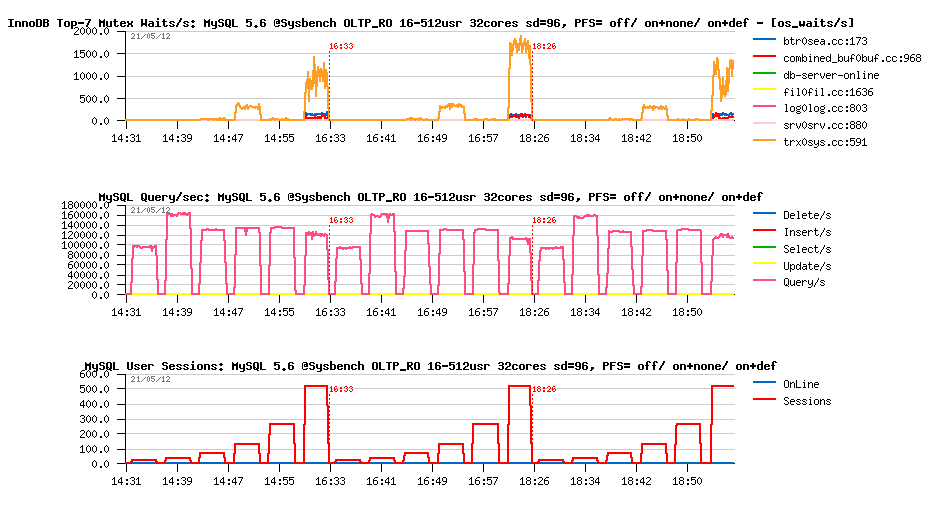
Observations :
- using innodb_spin_wait_delay=96 is lowering mutex contentions, so improving little bit an overall performance
- however, it's increasing little bit PFS overhead, but this increase is looking like random, rather consistent, and still not out-passing 3-5%..
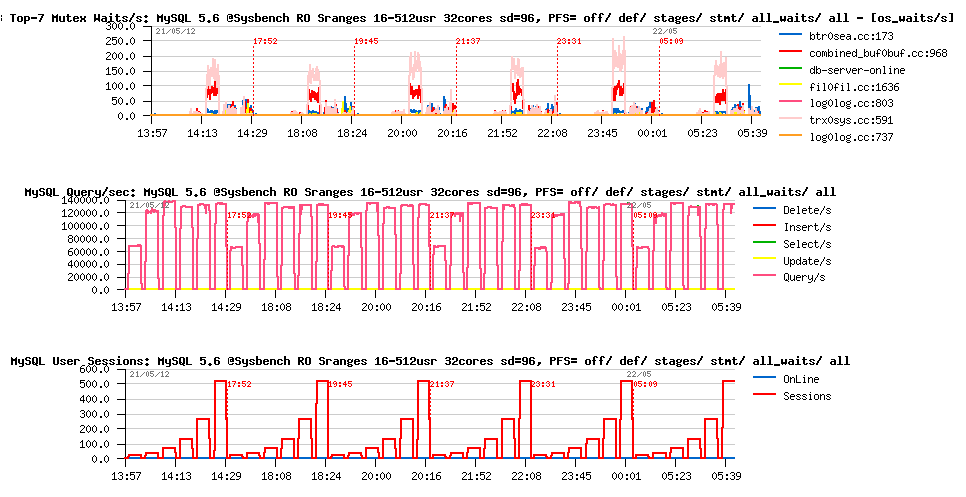
Sysbench RO S-Ranges, innodb_spin_wait_delay=96 :
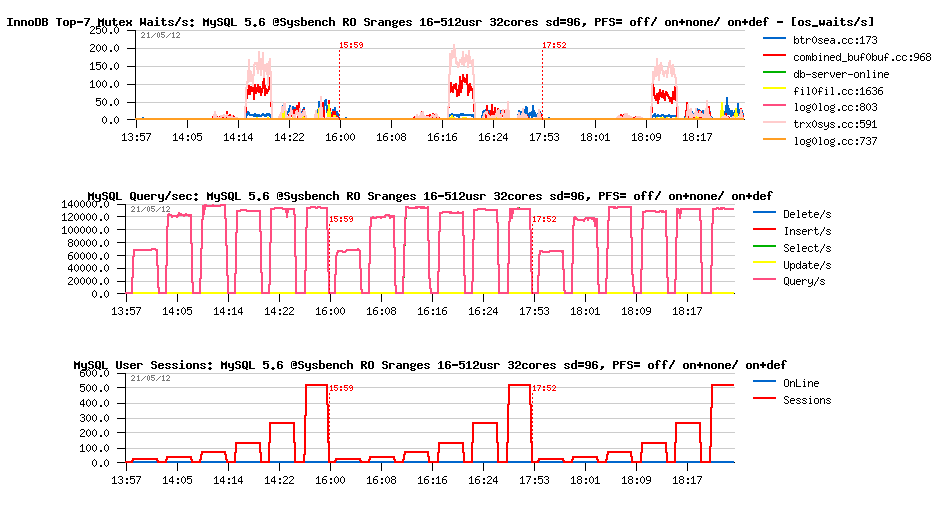
Observations :
- higher an overall performance
- PFS representing near zero or less than 5% overhead..
dbSTRESS RO, innodb_spin_wait_delay=96 :
Observations :
- not really much better performance here when innodb_spin_wait_delay=96 is used (RW-lock contentions are having a different profile)..
- however, no overhead due PFS instrumentation at all
Overhead of other groups of instrumentations
Test scenario: we're starting MySQL server with PFS enabled by default and then dynamically enabling or disabling various instrumentations.
NOTE: synch waits instrumentation (mutexes and RW-locks) cannot be enabled dynamically in this case, so "all_waits" test is not containing an overhead produced by mutexes and RW-locks instrumentation..
Test cases:
- off -- PFS is turned OFF
- def -- default instrumentations
- stages -- only stages instrumentation is enabled
- stmt -- only statements instrumentation is enabled
- all_waits -- all waits% instrumentation is enabled only
- all -- all instrumentations are enabled
Sysbench OLTP_RO, innodb_spin_wait_delay=96 :
Observations :
- in most cases the overhead is remaining very or at least lower than 5%
- the most heavy case (when all(!) instrumentations are enabled) is still not creating an overhead bigger than 10%..
Sysbench RO S-Ranges, innodb_spin_wait_delay=96:
Observations :
- near zero overhead in most of cases..
dbSTRESS RO, innodb_spin_wait_delay=96 :
Observations :
- same near zero overhead..
Overhead of SYNCH WAITS instrumentation
PFS overhead is directly depending on the internal contentions within MySQL -- more hot such contentions become, bigger performance impact may be expected due instrumentation (as instrumentation code is increasing a code path to execute).. That's why enabling SYNCH waits instrumentation potentially may create a bigger regression than any other.
my.conf settings:
- performance_schema = on
- performance_schema_instrument = '%=on'
Test cases:
- def -- default instrumentations
- all_waits -- all waits% instrumentation is enabled only
- synch -- only synch waits events instrumentation is enabled
- non-synch -- all waits% except synch instrumentation is enabled only
- all -- all instrumentations are enabled
- off -- PFS is turned OFF
Sysbench OLTP_RO, innodb_spin_wait_delay=96:
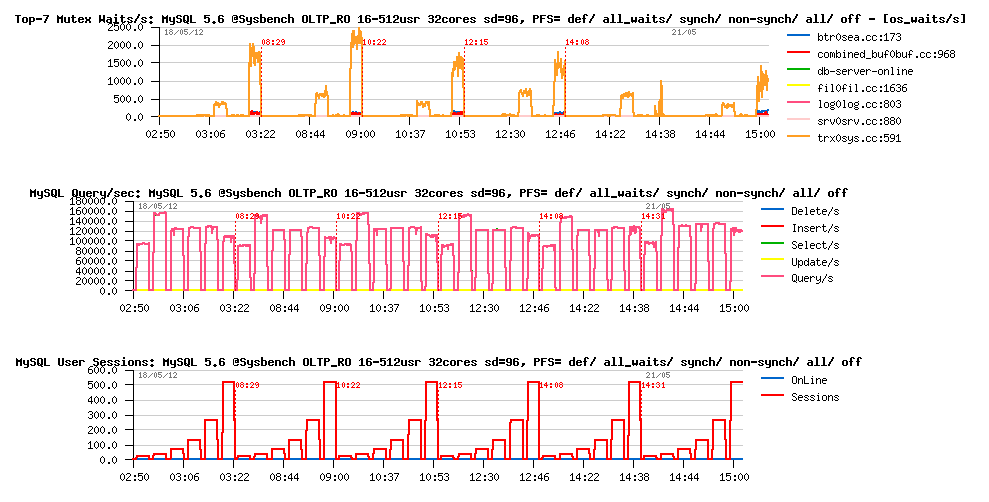
Observations :
- NOTE : this test is representing the most worse case for PFS overhead ;-)
- so far, even if synch waits instrumentation is not collected, additional check conditions code involved on them is bringing a little bit more overhead anyway..
- and even default instrumentation become more heavy in this case..
- however, overhead is not much higher once all waits instrumentations are switched to ENABLED and TIMED!.. - so at least we're proposing a solution to monitor internal wait events without any excessive regression! - which is really very good ;-)
SUMMARY
Seems to me like the current default PFS instrumentation is quite safe for a final user and in worse case brings 5% overhead (and, of course, it depends on a workload). Having SYNHC WAITS disabled by default is looking to be a wise decision to avoid any unexpected surprises. A final user should simply be aware that SYNCH WAITS instrumentation should be enabled explicitly on MySQL start, and know exactly what it's doing ;-)
PlanetMySQL Voting: Vote UP / Vote DOWN