Last week Percona team published the benchmark results comparing beta
XtraDB and MySQL 5.5 GA performance on their TPCC-like test workload (http://www.mysqlperformanceblog.com/2010/12/20/mysql-5-5-8-and-percona-server-being-adaptive).
The results are very interesting because they are involving many
questions about existing implementations of different features within
InnoDB and bring new ideas as well. However, what is missing for me in
this publication is an analyze of the tested workload and InnoDB
issues.. - finally I've got much more questions than answers :-)) and it
was pity for me to finish this year with a such "enigma" in my mind ;-))
So, as XtraDB is not ready yet, I was curious at least to get my own
look on the Percona's TPCC-like workload and satisfy my curiosity ;-))
The main question not leaving my mind was about observed performance
drops from the first graph: http://www.mysqlperformanceblog.com/wp-content/uploads/2010/12/500wRAID.png
- it was strange for me to see such holes on the TPM curve specially on
MySQL 5.5.8 which looked even on my stress test just fine now.. And,
honestly, I'd prefer a slightly lower performance but stable,
rather high peaks, but with performance drops.. So, for me there were
only two possibilities: we really completely missed something.. or
something was wrong with InnoDB tuning used during Percona tests.. - but
in both cases you have to dig it in depth.. And nothing better to
understand a problem than to dig it yourself.. :-))
But before to start with TPCC-like workload, let me show first how the
things are looking now with MySQL 5.5 on dbSTRESS (instead of preface
:-))
Ahead Flushing in MySQL 5.5.8
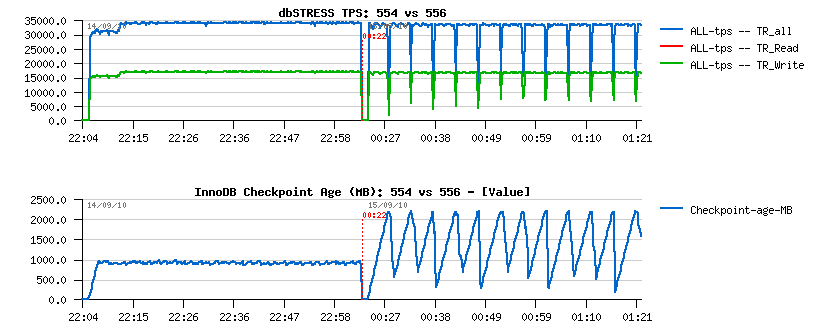
The following graphs are representing the same dbSTRESS Read+Write
workload with 32 concurrent user sessions tested on MySQL 5.5.4 and then
on 5.5.6 (second part of the graphs), the first graph is representing
TPS level, and the second one - Checkpoint Age in MB:
you may see that:
-
5.5.4 is flushing more aggressively and it results in a lower (but
stable) Checkpoint Age, but should involve higher I/O writes rate
(however it's still keeping stable TPS too)..
-
5.5.6 is way less aggressive in flushing, so Checkpoint Age is not
kept under a critical limit which is provoking periodic "furious
flushing" and as the result - TPS drops..
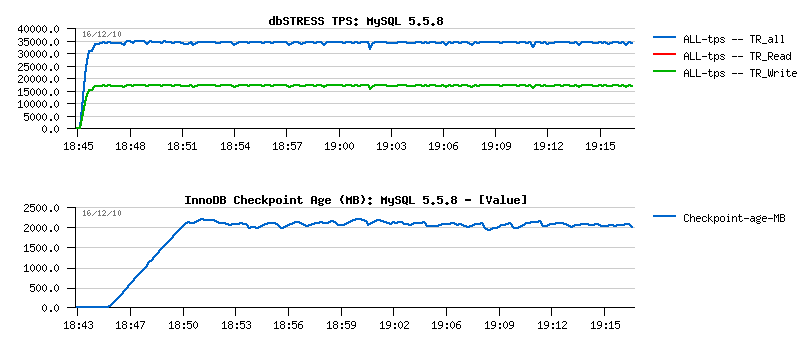
Now, testing MySQL 5.5.8 on the same server and under the same workload:
As you can see, the picture is completely different:
-
there is no more TPS drops
-
and flushing is just fine: not too much aggressive and not too relaxed
either, but just as needed..
So, you may understand why I was so surprised to see TPS drops on
Percona's tests ;-))
And it's time for Percona's TPCC-like test kit now..
Installation of Percona's TPCC-mysql test kit
Even if the test kit is supposed to be "intuitively
easy to use" ;-)) here are my steps to setup the tpcc-like stuff with a
help from README:
-
get
the tpcc-mysql
$ bzr branch https://code.launchpad.net/~percona-dev/perconatools/tpcc-mysql
-
$ cd tpcc-mysql/src; edit Makefile if needed, I've just manually added
values to LIBS and INC to point to my own paths:
LIBS=
/apps/mysql558/lib/libmysqlclient.a -lm -lz -lpthread -ldl
INC= -I.
-I /apps/mysql558/include/
-
$ make
that will compile you 2 binaries: "tpcc_load" and
"tpcc_start"
-
create the tpcc database schema with owner/password = dim/dim:
$
echo "create database tpcc;" | mysql -udim -pdim -h127.0.0.1 -P5400
$
mysql -f -udim -pdim -h127.0.0.1 -P5400 tpcc < create_table.sql
$
mysql -f -udim -pdim -h127.0.0.1 -P5400 tpcc < add_fkey_idx.sql
-
Generate 500 warehouses:
$ ./tpcc_load 127.0.0.1:5400 tpcc dim dim 500
-
Starting a test with 16 users on 500 warehouses for 3 hours:
$
./tpcc_start 127.0.0.1:5400 tpcc dim dim 500 16 120 10800 >
Test_16usr.log
Notes:
- generation of data for 500 warehouses is taking near 12 hours..
- 500 warehouses data set is occupying ~50GB of disk space, and it's
better to backup them before starting any test..
- tar.gz backup of data will occupy 24GB of disk space
- 3 hours of test with 16 users will already increase database size from
50GB to 75GB!..
Initial test on MySQL 5.5.8
Few details about my test platform:
-
Server: 32 cores bi-thread Intel box running under Linux, 64GB RAM
-
Storage: single Intel SSD disk of 128GB (yes, only one disk, but hope
it'll be enough for my test :-)), under EXT4
Test scenario:
-
Data: 500 warehouses (50GB already, so I hope it'll be enough to
reproduce the observed flushing issue.. - anyway, I don't have a place
for 1000 warehouses data anyway for the moment..)
-
Users: 16 concurrent users expecting to replay the same workload as
reported by Percona team..
-
Test duration: 3 hours (as data even during 3 hours are growing by 50%
there is no really any reason to run a test longer as I'm pretty sure
there will some background effects come in the game due a bigger
volume of rows in some tables and it'll completely change the test
conditions :-)) so even 3 hours within a such test is too much (well,
50% of growing volume is too much to guarantee that the test
conditions are remaining the same as on the beginning of the test)..
Initial MySQL configuration settings:
[mysqld]
 max_connections=2000
 key_buffer_size=200M
 low_priority_updates=1
 sort_buffer_size = 2097152
 table_open_cache = 8000

# files
 innodb_file_per_table
 innodb_log_file_size=1024M
 innodb_log_files_in_group=3

# buffers
 innodb_buffer_pool_size=32000M
 innodb_buffer_pool_instances=16
 innodb_additional_mem_pool_size=20M
 innodb_log_buffer_size=64M

# tune
 innodb_checksums=0
 innodb_doublewrite=0
 innodb_support_xa=0
 innodb_thread_concurrency = 0
 innodb_flush_log_at_trx_commit = 2
 innodb_max_dirty_pages_pct = 50

# Perf
 innodb_io_capacity = 2000
 innodb_write_io_threads = 16
 innodb_read_io_threads = 16
 innodb_adaptive_flushing=1
 innodb_purge_threads=1
First probe test
To understand any database activity you have to decide which metrics do
you want to monitor and in which way.. (for me the choice is easy as I'm
using dim_STAT most of the time to monitor everything :-)) But than you
may expect that your stress tool is also reporting stats about its
activity.. - tpcc-mysql is printing some data every 10 sec, but what
does it mean I have no idea :-)) and at the end it's printing the TpmC
number which is I suppose the final average Transactions Per Minute
result obtained during the whole test period.. But anyway, it should
also to be correlated with events reported by the database too, and as I
have no idea what exactly is going within application (tpcc-mysql) I'll
mainly base my analyzing on the activity reported by InnoDB..
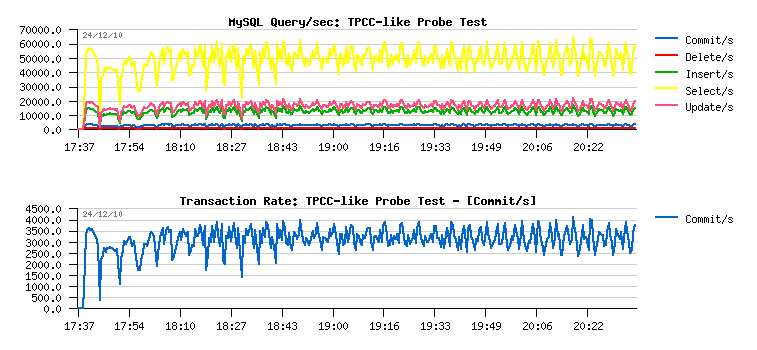
First of all I want to know what of kind of queries are executed during
the test and their ratio:
As you can see:
-
over 50,000 SELECT/sec
-
~20,000 UPDATE/sec
-
~15,000 INSERT/sec
-
small amount of DELETE/sec
-
COMMIT/sec may be probably considered as TPS metric as auto-commit
seems to be disabled within TPCC-mysql code, so having peaks at 4,000
commit/sec I may suppose the test is running in peak on ~24,000 TPM..
- however at the end of the test tpcc-mysql reported 58713.129 TpmC
in the log file :-)) so seems there are other kind of transactions are
accounted within TPM too.. - so to be based on the live and real time
data I'll align all my next analyzing with COMMIT/sec levels, for ex.
the current level is around of 3000 COMMIT/sec. Let's keep it
as a base line..
And it's true - there are drops on the database activity!.. - So, for
the moment I'm just happy to be able to reproduce the same issue as it
was observed by Percona :-))
Now, having 50,000 SELECT/sec, what about the read-ahead ?..
Let's check the %ahead% counters after 3 hours of activity:
mysql> show global status like '%ahead%';
+---------------------------------------+--------+
| Variable_name                         | Value  |
+---------------------------------------+--------+
| Innodb_buffer_pool_read_ahead         | 11     |
| Innodb_buffer_pool_read_ahead_evicted | 207619 |
+---------------------------------------+--------+
2 rows in set (0.00 sec)
Even the sum of both counters during 10800 seconds (3 hours) giving us
only 19 ahead reads/sec! - so how it's possible to claim that
having read ahead completely disabled may help on the workload with
50,000 SELECT/sec ??? ;-))
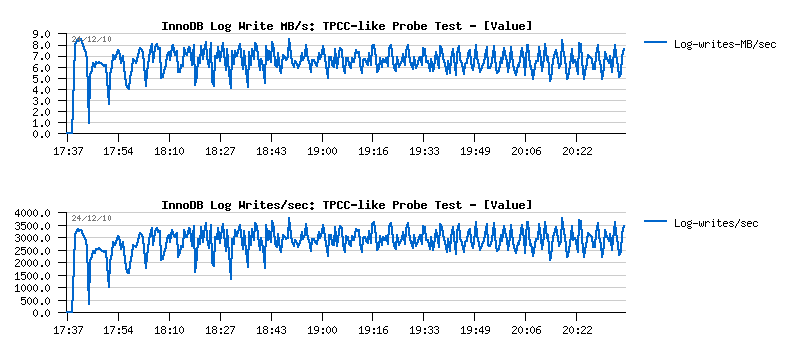
Next, what about the REDO writes?..
So, there are:
-
3000 log writes/sec resulting in ~7MB/sec writes
-
having "innodb_flush_log_at_trx_commit=2" setting will keep all log
writes buffered within filesystem cache and then flush them once per
second, so filesystem will sequentially write 7MB/sec..
Question: what is a potential impact on buffered 7MB/sec writes
if we'll use 4K or 512 bytes block size to write to the buffer?.. ;-))
There will be near no or no impact at all as all writes are managed by
the filesystem, and filesystem will use its own block size.. - Of course
the things may change if "innodb_flush_log_at_trx_commit=1" will be
used, but it was not a case for the presented tests..
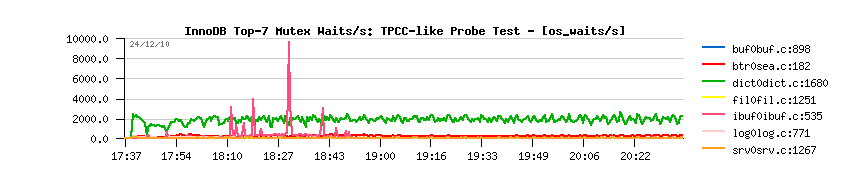
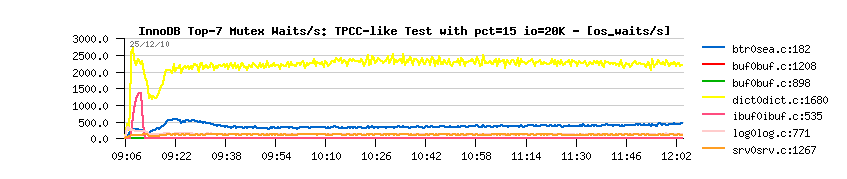
Next, what about InnoDB internal contentions?..
The main contention of TPCC-like workload is on the index mutex
(dict0dict.c:1680).. This contention may be removed by using partitions
on the hottest table (simple 3 hash partitions by the primary key may be
enough). However, no other contentions are involved (except some peaks
on the insert buffer), so the test case is looking likely I/O-bound and
we probably testing more the storage here rather MySQL.. ;-)) So, it may
not help you to test your MySQL instance scalability, etc.. - but it's
still a useful test case as it may just be one of the user cases in
production..
So let's see now if we can fix it..
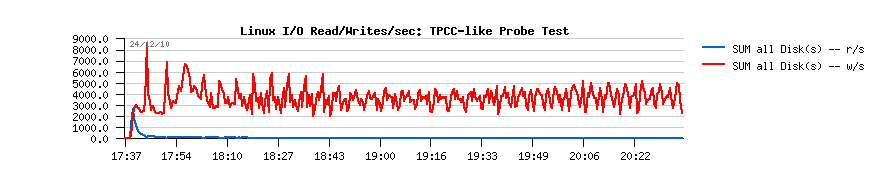
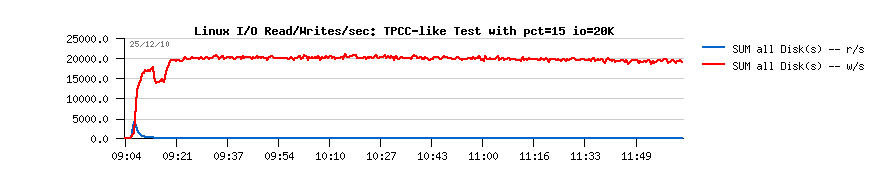
Looking on the I/O activity, we may see that performance drops are
provoked by I/O write peaks:
While I/O reads seems to be well cached by the Buffer Pool and
filesystem cache.. - so observed drops are practically for sure provoked
by irregular flushing, but from where and why?..
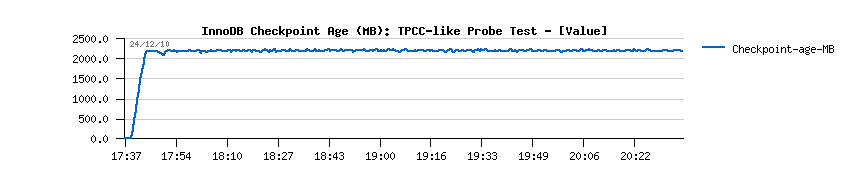
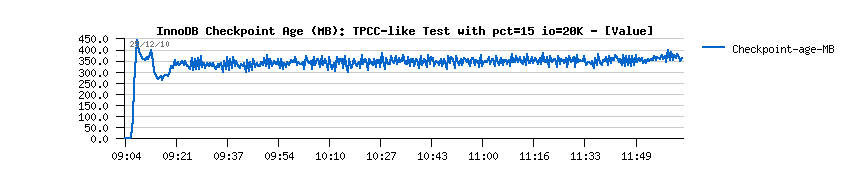
Looking on the Checkpoint Age graph it's hard to say the flushing is
coming due a critical limit of a free space within REDO logs:
Checkpoint Age is curiously stable.. (usually you will also observe
important drops here too)
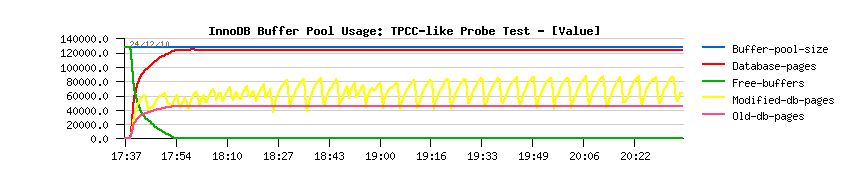
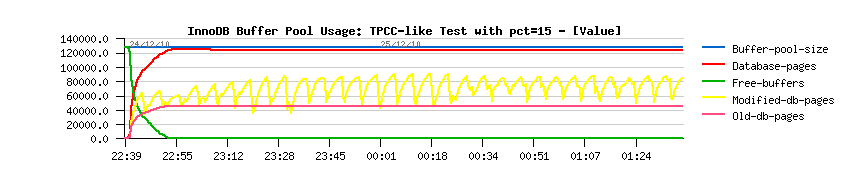
But it's what I'm seeing on the following graph I'm not liking at all -
Buffer Pool usage:
My max dirty pages percentage is set to 50% within my my.conf
file, while here InnoDB seems yet to fight to keep my limitation
respected!..
What if I'll set it to 15% now?..
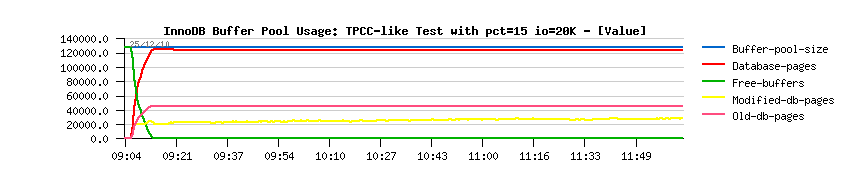
Test #2
Retesting the same workload, but now with
"innodb_max_dirty_pages_pct=15" setting:
Hmm.. - As you can see it's not better.. - it even looks like InnoDB is
ignoring my settings! ;-)) but it's not ignoring, of course, it's trying
to do what I'm asking for sure, and the only possible problem here is
that my IO capacity setting is not big enough (until now it was 2000)
IO capacity & flushing
-
initially the flushing activity within InnoDB was managed only by the
dirty pages percentage setting, and to avoid "furious flushing" user
adapted this setting according his/her database activity..
-
IO capacity setting came to replace the default hard coded 100 pages
value to flush per second - even a single hard disk drive is able to
do more than 100 writes/sec today, and InnoDB now is trying to flush
100% of IO capacity when the dirty pages percentage limit was reached..
-
however, it may still not protect you from a furious flushing - the
number of records within REDO logs are not directly depending on the
number of the dirty pages you're having within you Buffer Pool, so
your dirty pages may still be under the required limit, while there
may be no more free space within REDO logs.. - so you'll need to flush
your dirty pages as soon as possible to make a room within your REDO
logs and be able to continue transactional activity.. And to solve
this issue, Adaptive Flushing is coming in the game.
On the same time Adaptive Flushing is implemented differently within
InnoDB and XtraDB:
-
XtraDB is ignoring IO capacity setting and simply writes as much pages
as it estimated to flush (and was the first to have this "adaptive"
feature (Adaptive Checkpoint))
-
while InnoDB is respecting IO capacity limit, and will not out-pass
this limit even if it estimated to flush more..
-
personally, I prefer to respect IO capacity limit because it gives you
a way to limit I/O writes from a given MySQL instance (and if you're
running several MySQL instances on the same server it'll help you to
better share resources, and as well if you're using a shared storage,
etc.)
-
then if you're not liking any IO limitations - simply set IO capacity
way higher, for ex. 100000 and you're done! ;-))
XtraDB is trying to implement an "universal solution" - just enable
Adaptive Checkpoint and forget about any other settings regarding dirty
pages.. - well, it's a choice, and looks attractive. But when tuning
InnoDB just keep in mind 3 settings coming together:
-
enable adaptive flushing
-
adjust dirty pages percentage limit
-
adjust IO capacity
So, what now if I'll use IO capacity=20000 instead of 2000?..
Test #3
Retesting the same workload but now with:
-
innodb_max_dirty_pages_pct=15
-
innodb_io_capacity=20000
Buffer Pool usage:
Wow! it's much better now! ;-))
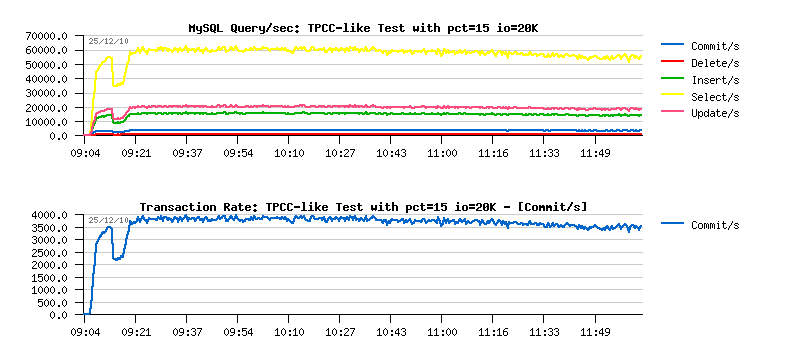
And what about TPS?..
Observations:
-
first of all there are no more periodic drops we observed before!!
(except the one on the beginning of the test)
-
SELECT/sec out-passed 60,000/sec !!
-
and COMMIT/sec is near 4,000/sec, but over a time slowly decreased to
3,500/sec..
Interesting that the first and the only one performance drop is not
provoked by flushing! - it's provoked by the peak on the
"btr_search_latch" mutex contention just because there is no more free
pages available within a Buffer Pool and InnoDB starts to manage pages
way harder :-)) Then once the work become less or more stable,
performance level become stable too..
BTW, if you'll look on XtraDB graph, you'll see exactly the same drop in
performance on the beginning of the test..
What about I/O activity?..
20,000 writes/sec! - well, it's probably too aggressive.. - let's check
the Checkpoint Age now:
Only 350MB??... - oh yes, I may flush much less here :-))
Let's bring back the dirty pages percentage limit to its initial 50%.
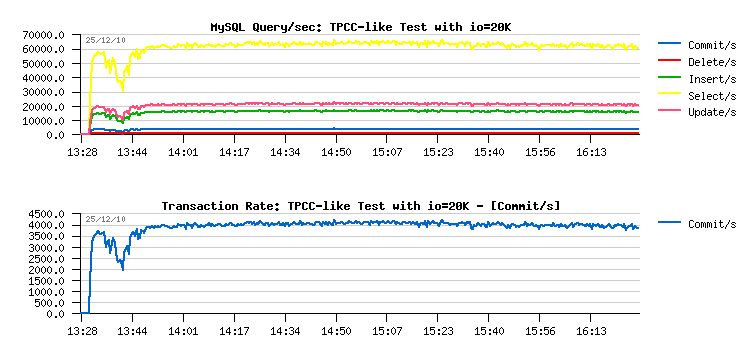
Test #4
So, retesting with all initial changes kept the same, and just changing
"innodb_io_capacity=20000"
Let's get a look on TPS first:
Observations:
-
over 65,000 SELECT/sec !!
-
over 4,000 COMMIT/sec !!
-
still the same drop on the start, but you know why ;-))
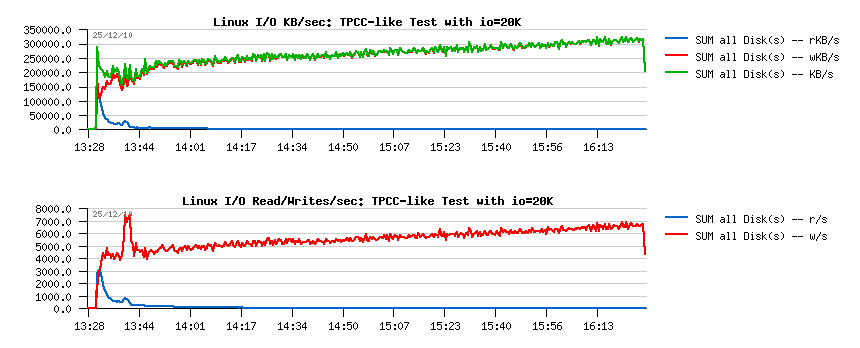
I/O activity:
It's hard to call this workload "stable" - writes are growing from
5,000/sec to 7,000/sec.. And in MB/sec: from 240MB/sec to 320MB/sec..
But it's probably just because over a time more dirty pages are flushed
over a single pass.. (on the same time database is growing over %50 in
the size, and it's only data (purge is working well, and History Length
over all the tests is near zero))..
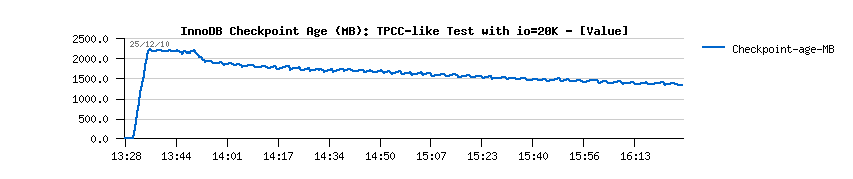
Checkpoint Age:
As you can see, not more than 2500MB of the REDO space were used, and
the needed space is lower and lower.. So, having 8GB REDO logs will not
help in a such test workload for sure! ;-))
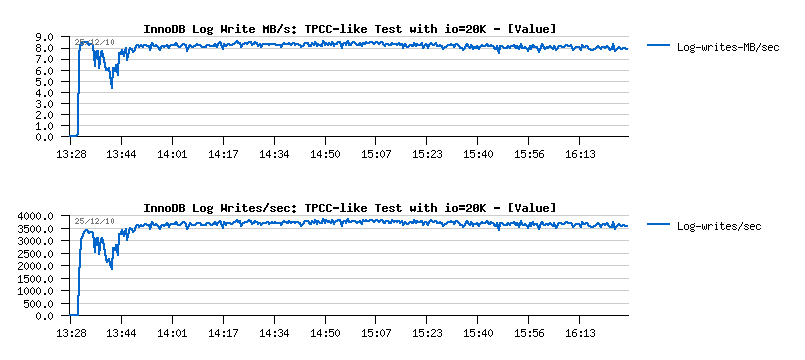
REDO Log writes:
As the amount of transactions/sec is higher, there are more REDO Log
writes in operations/sec and in MB/sec as well, which is normal.
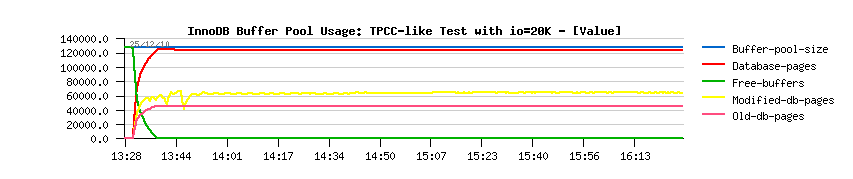
Buffer Pool usage:
My 50% dirty pages limit is well respected now.
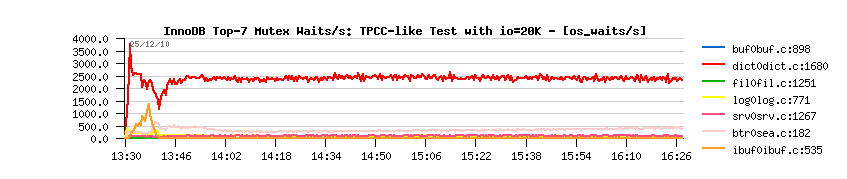
And the main contention is still on the index mutex:
Well, I'm already quite satisfied with obtained results, but have just
few questions more.. ;-))
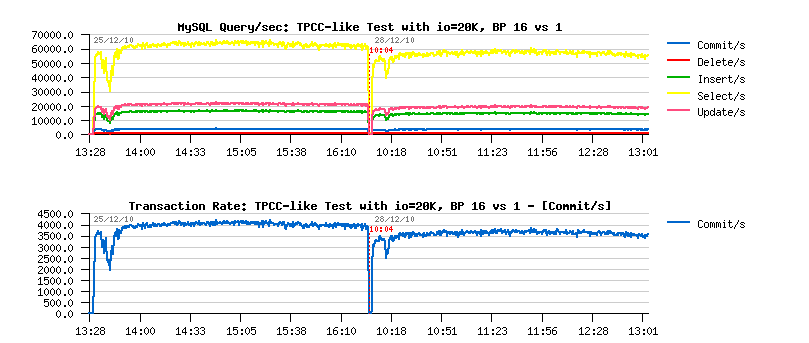
Test #5
During my tests I'm usually using 16 Buffer Pool (BP) instances within
InnoDB, and the result was at least as good as with a single Buffer Pool
instance.. So, I was really surprised to see a degradation on Percona
tests when more than one BP instance was used..
Comparing TPS between 16 and 1 BP instances:
As you can see, there is no performance degradation when using 16 BP
instances, but rather performance improvement even on this test case
having its main contention on the index mutex, and not on the BP
mutexes..
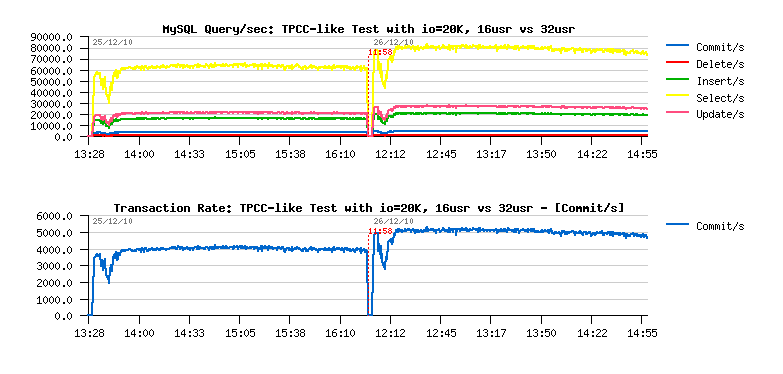
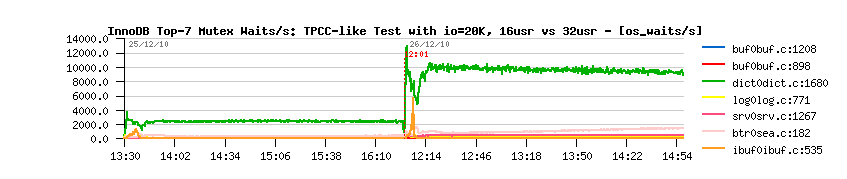
Test #6
Will the same tuning still valid for a twice higher workload on the same
server??..
Here is the TPS graph comparing workloads with 16 and 32 users:
Observations:
-
performance is still stable as before!..
-
and at least %25 performance improvement!..
Potential performance gain is limited due a dramatical increased
contention on the index mutex:
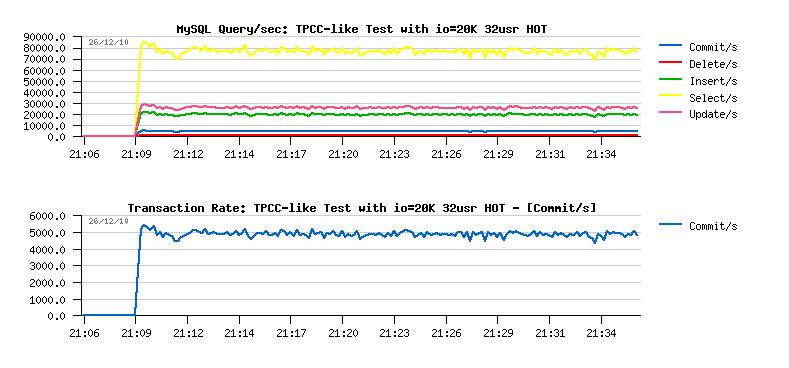
Test #7
And the last test is just to be sure that once the activity is stopped
on the database, and once all dirty pages are finally flushed, etc. - if
the workload will be started again, will I see a similar "starting drop"
as on every test beginning or no?.. (in case if drops are also depending
on the level of activity)..
And as you can see, there is no more performance drops once your Buffer
Pool was warmed:
TpmC numbers
Here are the TpmC numbers reported by the tpcc-mysql tool at the end of
the each test:
-
initial 16 users test: 58713.129 TpmC
-
final 16 users test: 74013.625 TpmC
-
final 32 users test: 93284.812 TpmC
Conclusion
Having MySQL 5.5 GA tuned right gives you a good and stable
performance!..
What else?.. ;-)))
PlanetMySQL Voting:
Vote UP /
Vote DOWN