Quantcast
Channel: Planet MySQL
Viewing all 18841 articles
Browse latest View live

Using Ceph with MySQL

$
0
0
Ceph

CephOver the last year, the Ceph world drew me in. Partly because of my taste for distributed systems, but also because I think Ceph represents a great opportunity for MySQL specifically and databases in general. The shift from local storage to distributed storage is similar to the shift from bare disks host configuration to LVM-managed disks configuration.

Most of the work I’ve done with Ceph was in collaboration with folks from RedHat (mainly Brent Compton and Kyle Bader). This work resulted in a number of talks presented at the Percona Live conference in April and the RedHat Summit San Francisco at the end of June. I could write a lot about using Ceph with databases, and I hope this post is the first in a long series on Ceph. Before I starting with use cases, setup configurations and performance benchmarks, I think I should quickly review the architecture and principles behind Ceph.

Introduction to Ceph

Inktank created Ceph a few years ago as a spin-off of the hosting company DreamHost. RedHat acquired Inktank in 2014 and now offers it as a storage solution. OpenStack uses Ceph as its dominant storage backend. This blog, however, focuses on a more general review and isn’t restricted to a virtual environment.

A simplistic way of describing Ceph is to say it is an object store, just like S3 or Swift. This is a true statement but only up to a certain point.  There are minimally two types of nodes with Ceph, monitors and object storage daemons (OSDs). The monitor nodes are responsible for maintaining a map of the cluster or, if you prefer, the Ceph cluster metadata. Without access to the information provided by the monitor nodes, the cluster is useless. Redundancy and quorum at the monitor level are important.

Any non-trivial Ceph setup has at least three monitors. The monitors are fairly lightweight processes and can be co-hosted on OSD nodes (the other node type needed in a minimal setup). The OSD nodes store the data on disk, and a single physical server can host many OSD nodes – though it would make little sense for it to host more than one monitor node. The OSD nodes are listed in the cluster metadata (the “crushmap”) in a hierarchy that can span data centers, racks, servers, etc. It is also possible to organize the OSDs by disk types to store some objects on SSD disks and other objects on rotating disks.

With the information provided by the monitors’ crushmap, any client can access data based on a predetermined hash algorithm. There’s no need for a relaying proxy. This becomes a big scalability factor since these proxies can be performance bottlenecks. Architecture-wise, it is somewhat similar to the NDB API, where – given a cluster map provided by the NDB management node – clients can directly access the data on data nodes.

Ceph stores data in a logical container call a pool. With the pool definition comes a number of placement groups. The placement groups are shards of data across the pool. For example, on a four-node Ceph cluster, if a pool is defined with 256 placement groups (pg), then each OSD will have 64 pgs for that pool. You can view the pgs as a level of indirection to smooth out the data distribution across the nodes. At the pool level, you define the replication factor (“size” in Ceph terminology).

The recommended values are a replication factor of three for spinners and two for SSD/Flash. I often use a size of one for ephemeral test VM images. A replication factor greater than one associates each pg with one or more pgs on the other OSD nodes.  As the data is modified, it is replicated synchronously to the other associated pgs so that the data it contains is still available in case an OSD node crashes.

So far, I have just discussed the basics of an object store. But the ability to update objects atomically in place makes Ceph different and better (in my opinion) than other object stores. The underlying object access protocol, rados, updates an arbitrary number of bytes in an object at an arbitrary offset, exactly like if it is a regular file. That update capability allows for much fancier usage of the object store – for things like the support of block devices, rbd devices, and even a network file systems, cephfs.

When using MySQL on Ceph, the rbd disk block device feature is extremely interesting. A Ceph rbd disk is basically the concatenation of a series of objects (4MB objects by default) that are presented as a block device by the Linux kernel rbd module. Functionally it is pretty similar to an iSCSI device as it can be mounted on any host that has access to the storage network and it is dependent upon the performance of the network.

The benefits of using Ceph

Agility
In a world striving for virtualization and containers, Ceph gives easily moves database resources between hosts.

IO scalability
On a single host, you have access only to the IO capabilities of that host. With Ceph, you basically put in parallel all the IO capabilities of all the hosts. If each host can do 1000 iops, a four-node cluster could reach up to 4000 iops.

High availability
Ceph replicates data at the storage level, and provides resiliency to storage node crash.  A kind of DRBD on steroids…

Backups
Ceph rbd block devices support snapshots, which are quick to make and have no performance impacts. Snapshots are an ideal way of performing MySQL backups.

Thin provisioning
You can clone and mount Ceph snapshots as block devices. This is a useful feature to provision new database servers for replication, either with asynchronous replication or with Galera replication.

The caveats of using Ceph

Of course, nothing is free. Ceph use comes with some caveats.

Ceph reaction to a missing OSD
If an OSD goes down, the Ceph cluster starts copying data with fewer copies than specified. Although good for high availability, the copying process significantly impacts performance. This implies that you cannot run a Ceph with a nearly full storage, you must have enough disk space to handle the loss of one node.

The “no out” OSD attribute mitigates this, and prevents Ceph from reacting automatically to a failure (but you are then on your own). When using the “no out” attribute, you must monitor and detect that you are running in degraded mode and take action. This resembles a failed disk in a RAID set. You can choose this behavior as default with the mon_osd_auto_mark_auto_out_in setting.

Scrubbing
Every day and every week (deep), Ceph scrubs operations that, although they are throttled, can still impact performance. You can modify the interval and the hours that control the scrub action. Once per day and once per week are likely fine. But you need to set osd_scrub_begin_hour and osd_scrub_end_hour to restrict the scrubbing to off hours. Also, scrubbing throttles itself to not put too much load on the nodes. The osd_scrub_load_threshold variable sets the threshold.

Tuning
Ceph has many parameters so that tuning Ceph can be complex and confusing. Since distributed systems push hardware, properly tuning Ceph might require things like distributing interrupt load among cores and thread core pinning, handling of Numa zones – especially if you use high-speed NVMe devices.

Conclusion

Hopefully, this post provided a good introduction to Ceph. I’ve discussed the architecture, the benefits and the caveats of Ceph. In future posts, I’ll present use cases with MySQL. These cases include performing Percona XtraDB Cluster SST operations using Ceph snapshots, provisioning async slaves and building HA setups. I also hope to provide guidelines on how to build and configure an efficient Ceph cluster.

Finally, a note for the ones who think cost and complexity put building a Ceph cluster out of reach. The picture below shows my home cluster (which I use quite heavily). The cluster comprises four ARM-based nodes (Odroid-XU4), each with a two TB portable USB-3 hard disk, a 16 GB EMMC flash disk and a gigabit Ethernet port.

I won’t claim record breaking performance (although it’s decent), but cost-wise it is pretty hard to beat (at around $600)!

Ceph

https://rh2016.smarteventscloud.com/connect/sessionDetail.ww?SESSION_ID=42190&tclass=popup


PlanetMySQL Voting: Vote UP / Vote DOWN

How to monitor MongoDB (if you’re really a MySQL DBA) - Webinar Replay & Slides

$
0
0

Thanks to everyone who joined us for this week’s webinar on how to monitor MongoDB (for the MySQL DBA).

Art van Scheppingen, Senior Support Engineer at Severalnines, discussed the most important metrics to keep an eye on for MongoDB and described them in plain MySQL DBA language.

This webinar looked at answering the following questions (amongst others):

  • Which status overviews and commands really matter to you?
  • How do you trend and alert on them?
  • What is the meaning behind the metrics?

It also included a look at the open source tools available for MongoDB monitoring and trending. Finally, Art did a demo of ClusterControl’s MongoDB metrics, dashboards, custom alerting and other features to track and optimize the performance of your MongoDB system.

View the replay or read the slides

Agenda

  • How does MongoDB monitoring compare to MySQL
  • Key MongoDB metrics to know about
  • Trending or alerting?
  • Available open source MongoDB monitoring tools
  • How to monitor MongoDB using ClusterControl
  • Demo

Speaker

Art van Scheppingen is a Senior Support Engineer at Severalnines. He’s a pragmatic MySQL and Database expert with over 16 years experience in web development. He previously worked at Spil Games as Head of Database Engineering, where he kept a broad vision upon the whole database environment: from MySQL to Couchbase, Vertica to Hadoop and from Sphinx Search to SOLR. He regularly presents his work and projects at various conferences (Percona Live, FOSDEM) and related meetups.

This session is based upon the experience we have using MongoDB and implementing it for our database infrastructure management solution, ClusterControl. For more details, read through our ‘Become a MongoDB DBA’ blog series.


PlanetMySQL Voting: Vote UP / Vote DOWN

Planets9s - Watch the replay: how to monitor MongoDB (if you’re really a MySQL DBA)

$
0
0

Welcome to this week’s Planets9s, covering all the latest resources and technologies we create around automation and management of open source database infrastructures.

Watch the replay: how to monitor MongoDB (if you’re really a MySQL DBA)

Thanks to everyone who joined us for this week’s webinar on how to monitor MongoDB (for the MySQL DBA). Art van Scheppingen, Senior Support Engineer at Severalnines, discussed the most important metrics to keep an eye on for MongoDB and described them in plain MySQL DBA language and outlined the open source tools available for MongoDB monitoring and trending. The webinar also included a demo of ClusterControl’s MongoDB metrics, dashboards, custom alerting and other features to track and optimize the performance of your MongoDB system.

Watch the replay

Check out our updated ClusterControl documentation

If you haven’t upgraded to ClusterControl 1.3.1, you should! It’s full of great new features and enhancements. And we have lots of documentation to help you get started. Some of the updates include: Wizard - Create Replication Setups for Oracle MySQL, MariaDB and Percona Server; Wizard - Add Existing MySQL Cluster (NDB); ClusterControl troubleshooting with debug package … and more!

View the documentation

Download our MySQL Replication Blueprint whitepaper

The MySQL Replication Blueprint whitepaper includes all aspects of a Replication topology with the ins and outs of deployment, setting up replication, monitoring, upgrades, performing backups and managing high availability using proxies. All the tips & tricks to get you started and more in one convenient document.

Download the whitepaper

Become a MongoDB DBA: Monitoring and Trending (part 2)

Following our initial post that discussed various functions and commands in MongoDB to retrieve your metrics, we now dive a bit deeper into the metrics: group them together and see which ones are the most important ones to keep an eye on. This blog goes well with the webinar replay, which we also published this week (see above).

Read the blog

That’s it for this week! Feel free to share these resources with your colleagues and follow us in our social media channels.

Have a good end of the week,

Jean-Jérôme Schmidt
Planets9s Editor
Severalnines AB


PlanetMySQL Voting: Vote UP / Vote DOWN

Configuring LDAP Authentication and Group Mapping With MariaDB

$
0
0
In this blog post, I will demonstrate how to configure MariaDB to use LDAP authentication and group mapping. I have previously written blog posts about configuring PAM authentication and user mapping with MariaDB and configuring PAM authentication and group mapping with MariaDB. If you’ve read those blog posts, a lot of this information will be familiar to you. However, a ... Read More
PlanetMySQL Voting: Vote UP / Vote DOWN

Percona Live Europe, Amsterdam 2016: Speaking Gets You the Whole Community Event!

$
0
0
Percona Live Europe Call for Papers

Percona Live Europe Amsterdam 2016 talksCome speak at Percona Live Europe, and get access to the entire conference.

The Percona Live Open Source Database Performance Conference Europe 2016 is the premier event for the rich and diverse MySQL, MongoDB and ODBMS ecosystems in Europe. Attendees include DBAs, SysAdmins, developers, architects, CTOs, CEOs, and vendors from around the world. It’s a great place to meet and participate with the open source community.

Want to go, but having a hard time getting the budget approved? We have a solution: be a speaker and get a complimentary full pass!

Submit your speaking proposal for a Percona Live session and share your MySQL, MongoDB and ODBMS ideas, case studies, best practices, and technical knowledge in front of an intelligent, engaged audience open source technology users. If selected as a speaker by our Conference Committee, you will receive a complimentary full conference pass.

Speaking at Percona Live is a great way to further the goals of open source software, and give back to a community that is literally changing the world.

Below are examples of some of the outstanding speakers from this year’s Percona Live Conference in Santa Clara. Speakers are made up of CEOs, Directors, DBAs, and a celebrity or two:

Speaking at Percona Live puts you in some pretty great company, and pays for your pass! Submit your speaking proposal today! The submission deadline is Monday, July 18th.

See the interviews from some of our speakers from this year’s Percona Live Conference in Santa Clara below.


PlanetMySQL Voting: Vote UP / Vote DOWN

MySQL Shell, opening session in a wrong way

$
0
0

This topic is about general usage for MySQL Shell and X-Plugin.
The most important thing, i think we should keep in mind that, the X-Plugin will listen not MySQL’s port, but it’s own 33060 port as shown from log:

2016-07-15T07:21:09.454761Z 200 [Note] Plugin mysqlx reported: 'X plugin tcp connection enable at port 33060.'
2016-07-15T07:21:09.454959Z 200 [Note] Plugin mysqlx reported: 'Scheduler "work" started.'
2016-07-15T07:21:09.454976Z 200 [Note] Plugin mysqlx reported: 'X plugin initialization successes'
2016-07-15T07:21:09.484303Z 201 [Note] Plugin mysqlx reported: 'Using existing mysqlxsys@localhost account for authentication. Incomplete grants will be fixed'
2016-07-15T07:21:09.501627Z 0 [Note] Plugin mysqlx reported: 'Using OpenSSL for TCP connections'
2016-07-15T07:21:09.501752Z 0 [Note] Plugin mysqlx reported: 'Server starts handling incoming connections'

That’s why do not try to give wrong –port adress:

[root@pxc_5_7 ~]# mysqlsh -uproxysql -pproxysql -h 127.0.0.1 --py --x --port=26100
mysqlx: [Warning] Using a password on the command line interface can be insecure.
Creating an X Session to proxysql@127.0.0.1:26100
MySQL Error (2027): Unknown message received from server 10

See -> #81051

Another thing is about openning X session to MySQL sever over ProxySQL. Well the idea is good ?

root@pxc_5_7 proxysql]# mysqlsh -uproxysql -pproxysql -h 127.0.0.1 --py --x --port=3306
mysqlx: [Warning] Using a password on the command line interface can be insecure.
Creating an X Session to proxysql@127.0.0.1:3306
MySQL Error (2006): MySQL server has gone away

From ProxySQL side:

2016-07-15 12:21:08 mysql_data_stream.cpp:298:check_data_flow(): [ERROR] Session=0x7fc62a86a000, DataStream=0x7fc62aaf0800 -- Data at both ends of a MySQL data stream: IN <1 bytes 0 packets> , OUT <1 bytes 0 packets>

See -> #issue607

Same thing if you try to connect from Python shell:

mysql-py> session = mysqlx.getSession({ 'host': 'localhost',
'port':3306,
'user':'proxysql',
'password':'proxysql' })
SystemError: MySQL Error (2006): MySQL server has gone away

mysql-py> session = mysqlx.getSession({ 'host':'localhost',
'port':26100,
'user':'proxysql',
'password':proxysql'})
SystemError: MySQL Error (2027): Unknown message received from server 10

If you have some interesting findings in related topic, feel free to contact me and to add those things in our list.


PlanetMySQL Voting: Vote UP / Vote DOWN
Develop By Example – Creating schemas and collections using Node.js

$
0
0

In a previous post we explained how to connect to a MySQL server configured as a document store using the new MySQL Connector/Node.js. In this post we are going to explain how to create a schema, create a collection and add documents to the collection.

Creating a new schema is very easy; the following code demonstrates how to do it:

var mysqlx = require('mysqlx');
mysqlx.getSession({
  host: ‘host’,
  port: ‘33060’,
  dbUser: ‘root’,
  dbPassword: ‘my pass’
}).then(function (session) {
  session.createSchema(‘mySchema’).then(function(schema){
    console.log('Schema created');
    session.close();
  });
}).catch(function (err) {
  console.log(err.message);
  console.log(err.stack);
});

In the previous code example we created a connection and then used the XSession object to create a schema, finally we closed the connection.

The first line of code loads the Connector/Node.js client module, mysqlx. We then call its getSession() method to get the object that we are going to use to create the schema. We then call the createSchema method to create our schema; once the schema is created we call the session object’s close method to close our connection.

But, what will happen if we try to create a schema that already exists? An error will be thrown.

To avoid that situation we can verify if the schema exists before trying to create it.

var mysqlx = require('mysqlx');
mysqlx.getSession({
  host: ‘host’,
  port: ‘33060’,
  dbUser: ‘root’,
  dbPassword: ‘my pass’
}).then(function (session) {
  var schema = session.getSchema(config.schema);
  schema.existsInDatabase().then(function (exists) {
    if (!exists) {
      session.createSchema(‘mySchema’).then(function(schema){
      console.log('Schema created');
      session.close();
      });
    }
    else {
      console.log('Schema already exist');
      session.close();
    }
  });
}).catch(function (err) {
  console.log(err.message);
  console.log(err.stack);
});

In the previous code, before trying to create the schema we call the session object’s getSchema method. The object (schema) returned represents the schema we want to create, we then call its existsInDatabase method which will return false if the schema does not exist in the server or true otherwise. The following lines of code attempt to create the schema. The program notifies the user if the schema is created successfully, or if the schema already exists. Then it closes the session.

Now that we know how to create a schema and verify if it already exists in the database, it is time to work with collections. When creating a collection, we need to know which schema object it will belong to. This can be a new schema, or an existing one. If we try to create the collection in a schema where that collection is already present, the program returns an error. The following example demonstrates how to check if a collection already exists before creating it.

var mysqlx = require('mysqlx');
mysqlx.getSession({
  host: ‘host’,
  port: ‘33060’,
  dbUser: ‘root’,
  dbPassword: ‘my pass’
}).then(function (session) {
  var schema = session.getSchema(‘mySchema’);
  schema.existsInDatabase().then(function (exists) {
    if (!exists) {
      session.createSchema(‘mySchema’).then(function(schema){
        console.log('Schema created');
     });
    }
    else {
      console.log('Schema already exist');
    }
  });

  var coll = schema.getCollection('myColl');
  coll.existsInDatabase().then(function (exists) {
    if(!exists){
      schema.createCollection('myColl').then(function (coll) {
        console.log('Collection created');
        session.close();
      });
    }
    else{
      console.log('Collection already exist');
      session.close();
    }
  });
}).catch(function (err) {
  console.log(err.message);
  console.log(err.stack);
});

In the previous code, the first lines are the same for the code to verify if a schema exists if not it is created. Then we call the schema object’s getCollection method which returns an object that represents the collection (coll) we want to create. As we did for the schema object, we call the coll object’s existsInDatabase method. If the collection does not exist, it is created by calling the schema object’s createCollection method and we receive a confirmation message. If the collection already exists we are notified of the fact. Finally, the session is closed.

To add new documents to a collection we need to use a JSON notation for the document to create. In the following code, we are going to demonstrate how to add a document to a collection, bear in mind that in the code we assume that a schema and a collection already exist in the server.

var mysqlx = require('mysqlx');
mysqlx.getSession({
     host: ‘host’,
     port: ‘33060’,
     dbUser: ‘root’,
     dbPassword: ‘my pass’
}).then(function (session) {
  var schema = session.getSchema((‘mySchema’);
  var coll = schema.getCollection(‘myColl’);
  var newDoc = { name: 'Test Name', description: 'Test Description' };

  coll.add(newDoc).execute().then(function (added) {
    console.log('Document(s) added: ' +
                 added.getAffectedItemsCount());
    session.close();
  })
  .catch(function (err) {
    console.log(err.message);
    console.log(err.stack);
   });
}).catch(function (err) {
  console.log(err.message);
  console.log(err.stack);
});

In the previous code to add a new document, first, we get the objects that represent the schema (schema) and the collection (coll) that we want to work with. Then we created an object using JSON (newDoc). To add the document to the collection we call the coll object’s add method followed by the execute method, once the execute method has finished we receive an object (added) that contains information about the document added. By calling the added object’s getAffectedItemsCount method we know if the document was added.

In the next blog post, we are going to explain in more detail how to work with collections.
See you then.


PlanetMySQL Voting: Vote UP / Vote DOWN
Understanding Bulk Index Creation in InnoDB (and innodb_sort_buffer_size)

$
0
0
In a previous post, I presented an Unexpected Memory Consumption for Bulk Index Creation in InnoDB.  This was triggered by an increased innodb_sort_buffer_size and as stated in another post: "the sorting algorithm does not scale well with large sort buffers".  In this post, I will present why it does not scale well and I will suggest solutions. This post also answers feedback request for the
PlanetMySQL Voting: Vote UP / Vote DOWN
Galera awareness and ProxySQL Scheduler

$
0
0
One of the most common request for ProxySQL it to support Galera cluster.
Support for Galera requires a lot of features to be added to ProxySQL , from checking if a node is in sync state, if it is a garbd process, auto-detect of new nodes, send writes to only one node,  remote DC support, and more.
Furthermore, as Galera is a clustering solution and not all setups have the same requirements, to support all the possible configurations seemed to be a too complex task.

Support for Galera in all its possible configurations wasn't the only request that seems to be complex to implement in the core of ProxySQL, but also additional requests not related to Galera, like changing the weight on a node while overloaded (as measured by different metrics! CPU usage, disk IO, number of threads) or removing a node from a pool while a backup was running.

I always advised that ProxySQL is easily configurable, and anybody can write a script that configures it at runtime through the Admin interface. The script can have any complex logic or algorithm, and then configures ProxySQL accordingly. In short, I always advised that ProxySQL should be a core component, and tools can be built around it.
But there was still a missing part: a glue to link ProxySQL and the external script(s).
For this reason, recently ProxySQL supported a new feature: jobs Scheduler.
Scheduler is a cron-like solution embedded directly inside ProxySQL. For more details, please have a look at the documentation.

Scheduler can run any sort of external executable, therefore we can write a script that monitor all backends of a specific hostgroup (a Galera cluster), remove hosts that are not in sync and re-add them once in sync.
A ready to use script is distributed with ProxySQL itself: proxysql_galera_checker.sh .
The script is inspired by Percona clustercheck, and accepts 3 arguments mandatory and one optional:

$ ./proxysql_galera_checker.sh
Usage: ./proxysql_galera_checker.sh <hostname> <port> <hostgroup_id> <log_file>

When running the script we need to pass ProxySQL's hostname and the port where the Admin interface is running. The script will connect (using hardcoded credential) to the Admin interface, it will retrieves credentials to connect to the backends and a list of backends for a specific hostgroup, it will check the value of wsrep_local_state on all these backends, and if they change status will automatically reconfigure ProxySQL.

As an example, we have a Galera cluster with 3 nodes:


Admin> SELECT hostgroup_id,hostname,port,status FROM mysql_servers;
+--------------+-------------+------+--------+
| hostgroup_id | hostname | port | status |
+--------------+-------------+------+--------+
| 0 | 10.10.10.11 | 3306 | ONLINE |
| 0 | 10.10.10.12 | 3306 | ONLINE |
| 0 | 10.10.10.13 | 3306 | ONLINE |
+--------------+-------------+------+--------+
3 rows in set (0.00 sec)


Next, we need to configure the scheduler to run the script at regular interval. In this example, we will run the job every 10000 milliseconds (10 seconds):


Admin> SHOW CREATE TABLE scheduler\G
*************************** 1. row ***************************
table: scheduler
Create Table: CREATE TABLE scheduler (
id INTEGER NOT NULL,
interval_ms INTEGER CHECK (interval_ms>=100 AND interval_ms<=100000000) NOT NULL,
filename VARCHAR NOT NULL,
arg1 VARCHAR,
arg2 VARCHAR,
arg3 VARCHAR,
arg4 VARCHAR,
arg5 VARCHAR,
PRIMARY KEY(id))
1 row in set (0.00 sec)

Admin> INSERT INTO scheduler(id,interval_ms,filename,arg1,arg2,arg3,arg4) VALUES
(1,'10000','/var/lib/proxysql/proxysql_galera_checker.sh','127.0.0.1','6032','0',
'/var/lib/proxysql/proxysql_galera_checker.log');
Query OK, 1 row affected (0.00 sec)

Admin> select * from scheduler\G
*************************** 1. row ***************************
id: 1
interval_ms: 10000
filename: /var/lib/proxysql/proxysql_galera_checker.sh
arg1: 127.0.0.1
arg2: 6032
arg3: 0
arg4: /var/lib/proxysql/proxysql_galera_checker.log
arg5: NULL
1 row in set (0.00 sec)

Admin> SELECT * FROM runtime_scheduler;
Empty set (0.00 sec)


At this stage the job is not loaded at runtime yet. So next we must run LOAD SCHEDULER TO RUNTIME:

Admin> LOAD SCHEDULER TO RUNTIME;
Query OK, 0 rows affected (0.00 sec)

Admin> select * from runtime_scheduler\G
*************************** 1. row ***************************
id: 1
interval_ms: 10000
filename: /var/lib/proxysql/proxysql_galera_checker.sh
arg1: 127.0.0.1
arg2: 6032
arg3: 0
arg4: /var/lib/proxysql/proxysql_galera_checker.log
arg5: NULL
1 row in set (0.00 sec)


The first test we will run is to shutdown a node:

vagrant@n3:~$ sudo service mysql stop
* Stopping MySQL (Percona XtraDB Cluster) mysqld


From the error log of this check, we can see that the script detected that a node is not reachable, and set it to offline:

vagrant@n1:~$ sudo tail /var/lib/proxysql/proxysql_galera_checker.log -n 20
Sat Jul 16 18:41:33 UTC 2016 Check server 10.10.10.12:3306 , status ONLINE , wsrep_local_state 4
Sat Jul 16 18:41:34 UTC 2016 Check server 10.10.10.13:3306 , status ONLINE , wsrep_local_state 4
Sat Jul 16 18:41:44 UTC 2016 Check server 10.10.10.11:3306 , status ONLINE , wsrep_local_state 4
Sat Jul 16 18:41:44 UTC 2016 Check server 10.10.10.12:3306 , status ONLINE , wsrep_local_state 4
Sat Jul 16 18:41:44 UTC 2016 Check server 10.10.10.13:3306 , status ONLINE , wsrep_local_state 4
Sat Jul 16 18:41:54 UTC 2016 Check server 10.10.10.11:3306 , status ONLINE , wsrep_local_state 4
Sat Jul 16 18:41:54 UTC 2016 Check server 10.10.10.12:3306 , status ONLINE , wsrep_local_state 4
Sat Jul 16 18:41:54 UTC 2016 Check server 10.10.10.13:3306 , status ONLINE , wsrep_local_state 4
Sat Jul 16 18:42:04 UTC 2016 Check server 10.10.10.11:3306 , status ONLINE , wsrep_local_state 4
Sat Jul 16 18:42:04 UTC 2016 Check server 10.10.10.12:3306 , status ONLINE , wsrep_local_state 4
Sat Jul 16 18:42:04 UTC 2016 Check server 10.10.10.13:3306 , status ONLINE , wsrep_local_state 4
Sat Jul 16 18:42:14 UTC 2016 Check server 10.10.10.11:3306 , status ONLINE , wsrep_local_state 4
ERROR 2003 (HY000): Can't connect to MySQL server on '10.10.10.12' (111)
Sat Jul 16 18:42:14 UTC 2016 Check server 10.10.10.12:3306 , status ONLINE , wsrep_local_state
Sat Jul 16 18:42:14 UTC 2016 Changing server 10.10.10.12:3306 to status OFFLINE_SOFT
Sat Jul 16 18:42:14 UTC 2016 Check server 10.10.10.13:3306 , status ONLINE , wsrep_local_state 4
Sat Jul 16 18:42:25 UTC 2016 Check server 10.10.10.11:3306 , status ONLINE , wsrep_local_state 4
ERROR 2003 (HY000): Can't connect to MySQL server on '10.10.10.12' (111)
Sat Jul 16 18:42:25 UTC 2016 Check server 10.10.10.12:3306 , status OFFLINE_SOFT , wsrep_local_state
Sat Jul 16 18:42:25 UTC 2016 Check server 10.10.10.13:3306 , status ONLINE , wsrep_local_state 4


Also mysql_servers confirms the change:

Admin> SELECT hostgroup_id,hostname,port,status FROM mysql_servers;
+--------------+-------------+------+--------------+
| hostgroup_id | hostname | port | status |
+--------------+-------------+------+--------------+
| 0 | 10.10.10.11 | 3306 | ONLINE |
| 0 | 10.10.10.12 | 3306 | OFFLINE_SOFT |
| 0 | 10.10.10.13 | 3306 | ONLINE |
+--------------+-------------+------+--------------+
3 rows in set (0.00 sec)


To continue our tests, we will set a host in desync mode:

mysql> show global variables like 'wsrep_desync';
+---------------+-------+
| Variable_name | Value |
+---------------+-------+
| wsrep_desync | OFF |
+---------------+-------+
1 row in set (0.00 sec)

mysql> set global wsrep_desync=ON;
Query OK, 0 rows affected (0.05 sec)

mysql> show global variables like 'wsrep_desync';
+---------------+-------+
| Variable_name | Value |
+---------------+-------+
| wsrep_desync | ON |
+---------------+-------+
1 row in set (0.00 sec)


Also in this case the script will notice it:

vagrant@n1:~$ sudo tail /var/lib/proxysql/proxysql_galera_checker.log -n 20
ERROR 2003 (HY000): Can't connect to MySQL server on '10.10.10.12' (111)
Sat Jul 16 18:48:01 UTC 2016 Check server 10.10.10.12:3306 , status OFFLINE_SOFT , wsrep_local_state
Sat Jul 16 18:48:01 UTC 2016 Check server 10.10.10.13:3306 , status ONLINE , wsrep_local_state 4
Sat Jul 16 18:48:11 UTC 2016 Check server 10.10.10.11:3306 , status ONLINE , wsrep_local_state 4
ERROR 2003 (HY000): Can't connect to MySQL server on '10.10.10.12' (111)
Sat Jul 16 18:48:11 UTC 2016 Check server 10.10.10.12:3306 , status OFFLINE_SOFT , wsrep_local_state
Sat Jul 16 18:48:11 UTC 2016 Check server 10.10.10.13:3306 , status ONLINE , wsrep_local_state 4
Sat Jul 16 18:48:21 UTC 2016 Check server 10.10.10.11:3306 , status ONLINE , wsrep_local_state 4
ERROR 2003 (HY000): Can't connect to MySQL server on '10.10.10.12' (111)
Sat Jul 16 18:48:21 UTC 2016 Check server 10.10.10.12:3306 , status OFFLINE_SOFT , wsrep_local_state
Sat Jul 16 18:48:21 UTC 2016 Check server 10.10.10.13:3306 , status ONLINE , wsrep_local_state 4
Sat Jul 16 18:48:31 UTC 2016 Check server 10.10.10.11:3306 , status ONLINE , wsrep_local_state 2
Sat Jul 16 18:48:31 UTC 2016 Changing server 10.10.10.11:3306 to status OFFLINE_SOFT
ERROR 2003 (HY000): Can't connect to MySQL server on '10.10.10.12' (111)
Sat Jul 16 18:48:31 UTC 2016 Check server 10.10.10.12:3306 , status OFFLINE_SOFT , wsrep_local_state
Sat Jul 16 18:48:31 UTC 2016 Check server 10.10.10.13:3306 , status ONLINE , wsrep_local_state 4
Sat Jul 16 18:48:41 UTC 2016 Check server 10.10.10.11:3306 , status OFFLINE_SOFT , wsrep_local_state 2
ERROR 2003 (HY000): Can't connect to MySQL server on '10.10.10.12' (111)
Sat Jul 16 18:48:42 UTC 2016 Check server 10.10.10.12:3306 , status OFFLINE_SOFT , wsrep_local_state
Sat Jul 16 18:48:42 UTC 2016 Check server 10.10.10.13:3306 , status ONLINE , wsrep_local_state 4


And mysql_servers will confirm the change:

Admin> SELECT hostgroup_id,hostname,port,status FROM mysql_servers;
+--------------+-------------+------+--------------+
| hostgroup_id | hostname | port | status |
+--------------+-------------+------+--------------+
| 0 | 10.10.10.11 | 3306 | OFFLINE_SOFT |
| 0 | 10.10.10.12 | 3306 | OFFLINE_SOFT |
| 0 | 10.10.10.13 | 3306 | ONLINE |
+--------------+-------------+------+--------------+
3 rows in set (0.00 sec)


To continue this proof of concept, we will now put the last node in sync:

mysql> show global variables like 'wsrep_desync';
+---------------+-------+
| Variable_name | Value |
+---------------+-------+
| wsrep_desync | ON |
+---------------+-------+
1 row in set (0.00 sec)

mysql> set global wsrep_desync=OFF;
Query OK, 0 rows affected (0.00 sec)

mysql> show global variables like 'wsrep_desync';
+---------------+-------+
| Variable_name | Value |
+---------------+-------+
| wsrep_desync | OFF |
+---------------+-------+
1 row in set (0.00 sec)


The script will detect it that the node is back ONLINE:

vagrant@n1:~$ sudo tail /var/lib/proxysql/proxysql_galera_checker.log -n 20
ERROR 2003 (HY000): Can't connect to MySQL server on '10.10.10.12' (111)
Sat Jul 16 18:49:53 UTC 2016 Check server 10.10.10.12:3306 , status OFFLINE_SOFT , wsrep_local_state
Sat Jul 16 18:49:53 UTC 2016 Check server 10.10.10.13:3306 , status ONLINE , wsrep_local_state 4
Sat Jul 16 18:50:03 UTC 2016 Check server 10.10.10.11:3306 , status OFFLINE_SOFT , wsrep_local_state 2
ERROR 2003 (HY000): Can't connect to MySQL server on '10.10.10.12' (111)
Sat Jul 16 18:50:03 UTC 2016 Check server 10.10.10.12:3306 , status OFFLINE_SOFT , wsrep_local_state
Sat Jul 16 18:50:03 UTC 2016 Check server 10.10.10.13:3306 , status ONLINE , wsrep_local_state 4
Sat Jul 16 18:50:13 UTC 2016 Check server 10.10.10.11:3306 , status OFFLINE_SOFT , wsrep_local_state 2
ERROR 2003 (HY000): Can't connect to MySQL server on '10.10.10.12' (111)
Sat Jul 16 18:50:13 UTC 2016 Check server 10.10.10.12:3306 , status OFFLINE_SOFT , wsrep_local_state
Sat Jul 16 18:50:13 UTC 2016 Check server 10.10.10.13:3306 , status ONLINE , wsrep_local_state 4
Sat Jul 16 18:50:23 UTC 2016 Check server 10.10.10.11:3306 , status OFFLINE_SOFT , wsrep_local_state 2
ERROR 2003 (HY000): Can't connect to MySQL server on '10.10.10.12' (111)
Sat Jul 16 18:50:24 UTC 2016 Check server 10.10.10.12:3306 , status OFFLINE_SOFT , wsrep_local_state
Sat Jul 16 18:50:24 UTC 2016 Check server 10.10.10.13:3306 , status ONLINE , wsrep_local_state 4
Sat Jul 16 18:50:34 UTC 2016 Check server 10.10.10.11:3306 , status OFFLINE_SOFT , wsrep_local_state 4
Sat Jul 16 18:50:34 UTC 2016 Changing server 10.10.10.11:3306 to status ONLINE
ERROR 2003 (HY000): Can't connect to MySQL server on '10.10.10.12' (111)
Sat Jul 16 18:50:34 UTC 2016 Check server 10.10.10.12:3306 , status OFFLINE_SOFT , wsrep_local_state
Sat Jul 16 18:50:34 UTC 2016 Check server 10.10.10.13:3306 , status ONLINE , wsrep_local_state 4


And correctly reconfigure mysql_servers:

Admin> SELECT hostgroup_id,hostname,port,status FROM mysql_servers;
+--------------+-------------+------+--------------+
| hostgroup_id | hostname | port | status |
+--------------+-------------+------+--------------+
| 0 | 10.10.10.11 | 3306 | ONLINE |
| 0 | 10.10.10.12 | 3306 | OFFLINE_SOFT |
| 0 | 10.10.10.13 | 3306 | ONLINE |
+--------------+-------------+------+--------------+
3 rows in set (0.01 sec)


Finally, we will restart the node shutdown previously:

vagrant@n3:~$ sudo service mysql start
* Starting MySQL (Percona XtraDB Cluster) database server mysqld [ OK ]


Once again, the script will detect that a node is now healthy:

vagrant@n1:~$ sudo tail /var/lib/proxysql/proxysql_galera_checker.log -n 20
Sat Jul 16 18:51:15 UTC 2016 Check server 10.10.10.13:3306 , status ONLINE , wsrep_local_state 4
Sat Jul 16 18:51:25 UTC 2016 Check server 10.10.10.11:3306 , status ONLINE , wsrep_local_state 4
ERROR 2003 (HY000): Can't connect to MySQL server on '10.10.10.12' (111)
Sat Jul 16 18:51:25 UTC 2016 Check server 10.10.10.12:3306 , status OFFLINE_SOFT , wsrep_local_state
Sat Jul 16 18:51:25 UTC 2016 Check server 10.10.10.13:3306 , status ONLINE , wsrep_local_state 4
Sat Jul 16 18:51:35 UTC 2016 Check server 10.10.10.11:3306 , status ONLINE , wsrep_local_state 4
ERROR 2003 (HY000): Can't connect to MySQL server on '10.10.10.12' (111)
Sat Jul 16 18:51:35 UTC 2016 Check server 10.10.10.12:3306 , status OFFLINE_SOFT , wsrep_local_state
Sat Jul 16 18:51:35 UTC 2016 Check server 10.10.10.13:3306 , status ONLINE , wsrep_local_state 4
Sat Jul 16 18:51:45 UTC 2016 Check server 10.10.10.11:3306 , status ONLINE , wsrep_local_state 4
ERROR 2003 (HY000): Can't connect to MySQL server on '10.10.10.12' (111)
Sat Jul 16 18:51:45 UTC 2016 Check server 10.10.10.12:3306 , status OFFLINE_SOFT , wsrep_local_state
Sat Jul 16 18:51:45 UTC 2016 Check server 10.10.10.13:3306 , status ONLINE , wsrep_local_state 4
Sat Jul 16 18:51:55 UTC 2016 Check server 10.10.10.11:3306 , status ONLINE , wsrep_local_state 4
Sat Jul 16 18:51:55 UTC 2016 Check server 10.10.10.12:3306 , status OFFLINE_SOFT , wsrep_local_state 4
Sat Jul 16 18:51:55 UTC 2016 Changing server 10.10.10.12:3306 to status ONLINE
Sat Jul 16 18:51:55 UTC 2016 Check server 10.10.10.13:3306 , status ONLINE , wsrep_local_state 4
Sat Jul 16 18:52:06 UTC 2016 Check server 10.10.10.11:3306 , status ONLINE , wsrep_local_state 4
Sat Jul 16 18:52:06 UTC 2016 Check server 10.10.10.12:3306 , status ONLINE , wsrep_local_state 4
Sat Jul 16 18:52:06 UTC 2016 Check server 10.10.10.13:3306 , status ONLINE , wsrep_local_state 4


And correctly reconfigure mysql_servers:

Admin> SELECT hostgroup_id,hostname,port,status FROM mysql_servers;
+--------------+-------------+------+--------+
| hostgroup_id | hostname | port | status |
+--------------+-------------+------+--------+
| 0 | 10.10.10.11 | 3306 | ONLINE |
| 0 | 10.10.10.12 | 3306 | ONLINE |
| 0 | 10.10.10.13 | 3306 | ONLINE |
+--------------+-------------+------+--------+
3 rows in set (0.00 sec)


Finally, do not forget to save the job to disk:

Admin> SAVE SCHEDULER TO DISK;
Query OK, 0 rows affected (0.01 sec)


Conclusion

Complete Support for Galera Cluster in ProxySQL is still not ready.
Although, the ability of ProxySQL to be easily reconfigurable at runtime, together with its Scheduler, will quickly extend ProxySQL capabilities, include a better integration with Galera in complex setups.

PlanetMySQL Voting: Vote UP / Vote DOWN
Setting up Etcd cluster with DNS discovery

$
0
0

Setting up an etcd cluster with DNS discovery may be challenging. There are several building blocks:

  • Etcd – a distributed key value store
  • Amazon EC2 – cloud computing provider
  • Cloudflare – DNS provider
  • Chef – for configuring individual nodes

Each of them has their pitfalls, we will guide you through whole process.

DNS discovery

Any clustered system needs a way to maintain a list of nodes in a cluster. Usually you need to specify all cluster members when starting a node. This is the way zookeeper and consul works. Effectively you have redundancy in configuration – the list of nodes is stored on every node. The list must be consistent and it’s difficult to maintain it especially if the cluster lives long life. Old nodes break and get remove, new nodes get added, cluster size may grow/shrink over time. All that makes cluster configuration maintenance cumbersome and error prone.

DNS discovery is a killer feature of Etcd. Effectively it means you keep a list of cluster nodes in one place. All interested parties – cluster nodes, clients, monitoring agents – get it from DNS. There is a single copy of the list, thus there is no chance to get inconsistent cluster view. Etcd team should advertise this feature with capital letters on their website.

Process overview

Three nodes will form the cluster. This is the minimal number of nodes in a cluster that is tolerant to one failure whether expected or not.

For each node we start Amazon EC2 instance and create a DNS record.

When all instances are ready and DNS is prepared, we start Etcd on three nodes simultaneously.

Etcd cluster setup algorithm

Starting Amazon EC2 instance

We will illustrate each step with extracts from real code excerpts. We will skip non-important parts of the code, so copy&paste won’t work. ?

INSTANCE_TYPE = "t2.micro"
KEYPAIR_NAME = "deployer"
SUBNET_ID = "subnet-12c7b638"   # private, infra
SECURITY_GROUP = "sg-f525808e"  # default VPC security group
ROOT_VOLUME_SIZE = 16
DATA_VOLUME_SIZE = 0
ZONE_NAME = "twindb.com"
DISCOVERY_SRV_DOMAIN = ZONE_NAME
SSH_OPTIONS = "-o StrictHostKeyChecking=no"
CLUSTER_SIZE = 3

Function setup_new_cluster() starts a cluster of a given size.
It calls function launch_ec2_instance() in a loop that in its turn starts an EC2 instance and waits until it is available via SSH.

def setup_new_cluster(size=CLUSTER_SIZE):

    Log.info("Initiating cluster with %d nodes" % size)

    nodes = []
    # Create file with private SSH key
    deployer_key_file = NamedTemporaryFile(bufsize=0)
    deployer_key_file.file.write(deployer_private_key)

    for i in range(size):
        node_id = uuid.uuid1().hex
        Log.info("Configuring node %s" % node_id)

        node_name = "etcd-%s" % node_id

        Log.info("Starting instance for node %s" % node_id)
        instance_id = launch_ec2_instance(AWS_DEFAULT_AMI, INSTANCE_TYPE, KEYPAIR_NAME, SECURITY_GROUP, SUBNET_ID,
                                          ROOT_VOLUME_SIZE, DATA_VOLUME_SIZE,
                                          get_instance_username_by_ami(AWS_DEFAULT_AMI), deployer_key_file.name,
                                          public=False, name=node_name)
        if not instance_id:
            Log.error("Failed to launch EC2 instance")
            exit(-1)

        Log.info("Launched instance %s" % instance_id)

Creating DNS records

Three DNS records must be created for each node :

  1. A record to resolve host name into IP address
  2. SRV record that tells what TCP port is used to serve other cluster nodes
  3. SRV record that tells what TCP port is used to serve client requests

Eventually we should get following DNS records:

A cluster node requests these records when it wants to know what other peers are and what ports they listen to.

$ dig +noall +answer SRV _etcd-server._tcp.twindb.com
_etcd-server._tcp.twindb.com. 299 IN SRV 0 0 2380 etcd-1e1650524ba511e68a9b12cb523caae1.twindb.com.
_etcd-server._tcp.twindb.com. 299 IN SRV 0 0 2380 etcd-6794c99e4ba411e68a9b12cb523caae1.twindb.com.
_etcd-server._tcp.twindb.com. 299 IN SRV 0 0 2380 etcd-c3e9dea04ba411e68a9b12cb523caae1.twindb.com.

If a client wants to communicate to the cluster it requests these SRV records to know what host name to connect to and to which port.

$ dig +noall +answer SRV _etcd-client._tcp.twindb.com
_etcd-client._tcp.twindb.com. 299 IN    SRV 0 0 2379 etcd-6794c99e4ba411e68a9b12cb523caae1.twindb.com.
_etcd-client._tcp.twindb.com. 299 IN    SRV 0 0 2379 etcd-1e1650524ba511e68a9b12cb523caae1.twindb.com.
_etcd-client._tcp.twindb.com. 299 IN    SRV 0 0 2379 etcd-c3e9dea04ba411e68a9b12cb523caae1.twindb.com.

And finally A records to resolve host names

$ dig +noall +answer etcd-6794c99e4ba411e68a9b12cb523caae1.twindb.com. etcd-1e1650524ba511e68a9b12cb523caae1.twindb.com. etcd-c3e9dea04ba411e68a9b12cb523caae1.twindb.com.
etcd-6794c99e4ba411e68a9b12cb523caae1.twindb.com. 299 IN A 10.5.1.81
etcd-1e1650524ba511e68a9b12cb523caae1.twindb.com. 299 IN A 10.5.1.66
etcd-c3e9dea04ba411e68a9b12cb523caae1.twindb.com. 299 IN A 10.5.1.203

At TwinDB we use CloudFlare to store twindb.com zone. CloudFlare provides API that we’re going to use.

def setup_new_cluster(size=CLUSTER_SIZE):
...
        dns_record_name = node_name + "." + DISCOVERY_SRV_DOMAIN
        private_ip = get_instance_private_ip(instance_id)
        if not create_dns_record(dns_record_name,
                                 ZONE_NAME,
                                 private_ip):
            Log.error("Failed to create an A DNS record for %s" % dns_record_name)
            exit(-1)

        if not create_dns_record("_etcd-server._tcp." + DISCOVERY_SRV_DOMAIN,  # "_etcd-server._tcp.twindb.com"
                                 ZONE_NAME,
                                 "0\t2380\t%s" % dns_record_name,
                                 data={
                                     "name": DISCOVERY_SRV_DOMAIN,
                                     "port": 2380,
                                     "priority": 0,
                                     "proto": "_tcp",
                                     "service": "_etcd-server",
                                     "target": dns_record_name,
                                     "weight": 0
                                 },
                                 record_type="SRV"):
            Log.error("Failed to create a SRV record for %s" % dns_record_name)
            Log.error("Trying to delete DNS record for %s" % dns_record_name)
            delete_dns_record(dns_record_name, ZONE_NAME)
            Log.error("Trying to terminate instance %s" % instance_id)
            terminate_ec2_instance(instance_id)
            exit(-1)

        if not create_dns_record("_etcd-client._tcp." + DISCOVERY_SRV_DOMAIN,
                                 ZONE_NAME,
                                 "0\t2379\t%s" % dns_record_name,
                                 data={
                                     "name": DISCOVERY_SRV_DOMAIN,
                                     "port": 2379,
                                     "priority": 0,
                                     "proto": "_tcp",
                                     "service": "_etcd-client",
                                     "target": dns_record_name,
                                     "weight": 0
                                 },
                                 record_type="SRV"):
            Log.error("Failed to create a SRV record for %s" % dns_record_name)
            Log.error("Trying to delete DNS record for %s" % dns_record_name)
            delete_dns_record(dns_record_name, ZONE_NAME)
            Log.error("Trying to terminate instance %s" % instance_id)
            terminate_ec2_instance(instance_id)
            exit(-1)

For the reference this is the code to work with CloudFlare API:

def cf_api_call(url, method="GET", data=None):

    cmd = ["curl", "--silent", "-X", method,
           "https://api.cloudflare.com/client/v4%s" % url,
           "-H", "X-Auth-Email: %s" % CLOUDFLARE_EMAIL,
           "-H", "X-Auth-Key: %s" % CLOUDFLARE_AUTH_KEY,
           "-H", "Content-Type: application/json"
           ]
    if data:
        cmd.append("--data")
        cmd.append(data)
    try:
        Log.debug("Executing: %r" % cmd)
        cf_process = Popen(cmd, stdout=PIPE, stderr=PIPE)
        cout, cerr = cf_process.communicate()

        if cf_process.returncode != 0:
            Log.error(cerr)
            return None

        try:
            Log.debug(cout)
            return json.loads(cout)

        except ValueError as err:
            Log.error(err)
            Log.error(cerr)
            return None

    except OSError as err:
        Log.error(err)
        return None


def create_dns_record(name, zone, content, data=None, record_type="A", ttl=1):

    zone_id = get_zone_id(zone)

    url = "/zones/%s/dns_records" % zone_id
    request = {
        "name": name,
        "content": content,
        "type": record_type,
        "ttl": ttl
    }

    if data:
        request["data"] = data

    response = cf_api_call(url, method="POST", data=json.dumps(request))

    if not response["success"]:
        for error in response["errors"]:
            Log.error("Error(%d): %s" % (error["code"], error["message"]))

    return bool(response["success"])

It takes time before DNS changes we made are propagated and available on a node. We should wait until DNS is ready:

def setup_new_cluster(size=CLUSTER_SIZE):
...
        # wait till dns_record_name resolves into private_ip
        Log.info("Waiting till DNS changes are propagated")
        while True:
            try:
                ip = socket.gethostbyname(dns_record_name)
                if ip == private_ip:
                    break
                else:
                    Log.error("%s resolved into unexpected %s" % (dns_record_name, ip))
            except socket.gaierror:
                Log.info("waiting...")
                pass
            time.sleep(3)

        # Save node in a list. We will need it later
        nodes.append({
            'key': deployer_key_file.name,
            'ip': private_ip,
            'name': node_name
        })

At this point we should have three Amazon EC2 instances up&running and DNS records ready.

Bootstrapping Etcd node

We use Chef recipe for etcd cluster. There are two gotchas with the recipe:

  1. By default it installs ancient Etcd version 2.2.5 which is buggy.
  2. The recipe installs an init script that will fail if you start the first node (See Bug#63 for details). By the way, I got no feedback from Chef team as of time of writing, but they didn’t forget to send me a bunch of sales cold calls and spam. Look up to Etcd team, they’re extremely responsive even on weekends.

Etcd recipe attributes

We need to specify only one attribute – domain name.

default['etcd-server']['discovery_srv'] = 'twindb.com'

Etcd recipe

etcd_installation 'default' do
  version '3.0.2'
  action :create
end

etcd_service node.default['chef_client']['config']['node_name'] do
  discovery_srv node.default['etcd-server']['discovery_srv']

  initial_advertise_peer_urls 'http://' + node.default['chef_client']['config']['node_name'] + '.twindb.com:2380'
  advertise_client_urls 'http://' + node.default['chef_client']['config']['node_name'] + '.twindb.com:2379'

  initial_cluster_token 'etcd-cluster-1'
  initial_cluster_state 'new'

  listen_client_urls 'http://0.0.0.0:2379'
  listen_peer_urls 'http://0.0.0.0:2380'
  data_dir '/var/lib/etcd'
  action :start
end

When recipe is ready (we use our own chef server) we can bootstrap three cluster nodes. Remember, we need to start them simultaneously.

def setup_new_cluster(size=CLUSTER_SIZE):
...
    pool = Pool(processes=size)
    pool.map(bootstrap_node, nodes)

Code to bootstrap one node:

def bootstrap(key, ip, node_name):

    try:
        username = get_instance_username_by_ami(AWS_DEFAULT_AMI)

        hosts_file = os.environ['HOME'] + "/.ssh/known_hosts"
        if isfile(hosts_file):
            run_command("ssh-keygen -f " + hosts_file + " -R " + ip)

        cmd = "knife bootstrap " + ip \
              + " --ssh-user " + username \
              + " --sudo --identity-file " + key \
              + " --node-name " + node_name \
              + " --yes " \
                " --run-list 'recipe[etcd-server]'"
        run_command(cmd)

    except CalledProcessError as err:
        Log.error(err.output)
        return False

    return True


def bootstrap_node(node):
    """
    Bootstrap node
    :param node: dictionary with node parameters. Dictionary must contain keys:
        key - path to SSH private key
        ip - IP address of the node
        name - node hostname
    :return: True if success or False otherwise
    """
    try:
        return bootstrap(node['key'], node['ip'], node['name'])
    except KeyError as err:
        Log.error(err)
        return False

Checking health of Etcd cluster

Now we can communicate with the Etcd cluster from any host with installed etcdctl:

$ etcdctl --discovery-srv twindb.com cluster-health
member 83062705e5ba24af is healthy: got healthy result from http://etcd-c3e9dea04ba411e68a9b12cb523caae1.twindb.com:2379
member 9fca41c9f65e3e96 is healthy: got healthy result from http://etcd-1e1650524ba511e68a9b12cb523caae1.twindb.com:2379
member b8dfb16b4af1fd49 is healthy: got healthy result from http://etcd-6794c99e4ba411e68a9b12cb523caae1.twindb.com:2379
cluster is healthy

Have a good service discovery!

The post Setting up Etcd cluster with DNS discovery appeared first on Backup and Data Recovery for MySQL.


PlanetMySQL Voting: Vote UP / Vote DOWN
ClusterControl Tips & Tricks - Best Practices for Database Backups

$
0
0

Backups - one of the most important things to take care of while managing databases. It is said there are two types of people - those who backup their data and those who will backup their data. In this blog post, we will discuss good practices around backups and show you how you can build a reliable backup system using ClusterControl.

Backup types

There are two main types of backup:

  • Logical backup - backup of data is stored in a human-readable format like SQL
  • Physical backup - backup contains binary data

Both complement each other - logical backup allows you to (more or less easily) retrieve up to a single row of data. Physical backups would require more time to accomplish that, but, on the other hand, they allow you to restore an entire host very quickly (something which may take hours or even days when using logical backup).

ClusterControl supports both types of backup: mysqldump for logical backup and xtrabackup for physical backup.

Backup schedule

Obviously, you’d want to have a fixed schedule for your backups. How often you want the backup to execute? It depends on your application, importance of data, time needed to take the backup and so on. We’d recommend to take a backup at least daily. When possible, you’d want to take both mysqldump and xtrabackup backups on a daily basis. To cover even more bases, you may want to schedule several incremental xtrabackup runs per day.

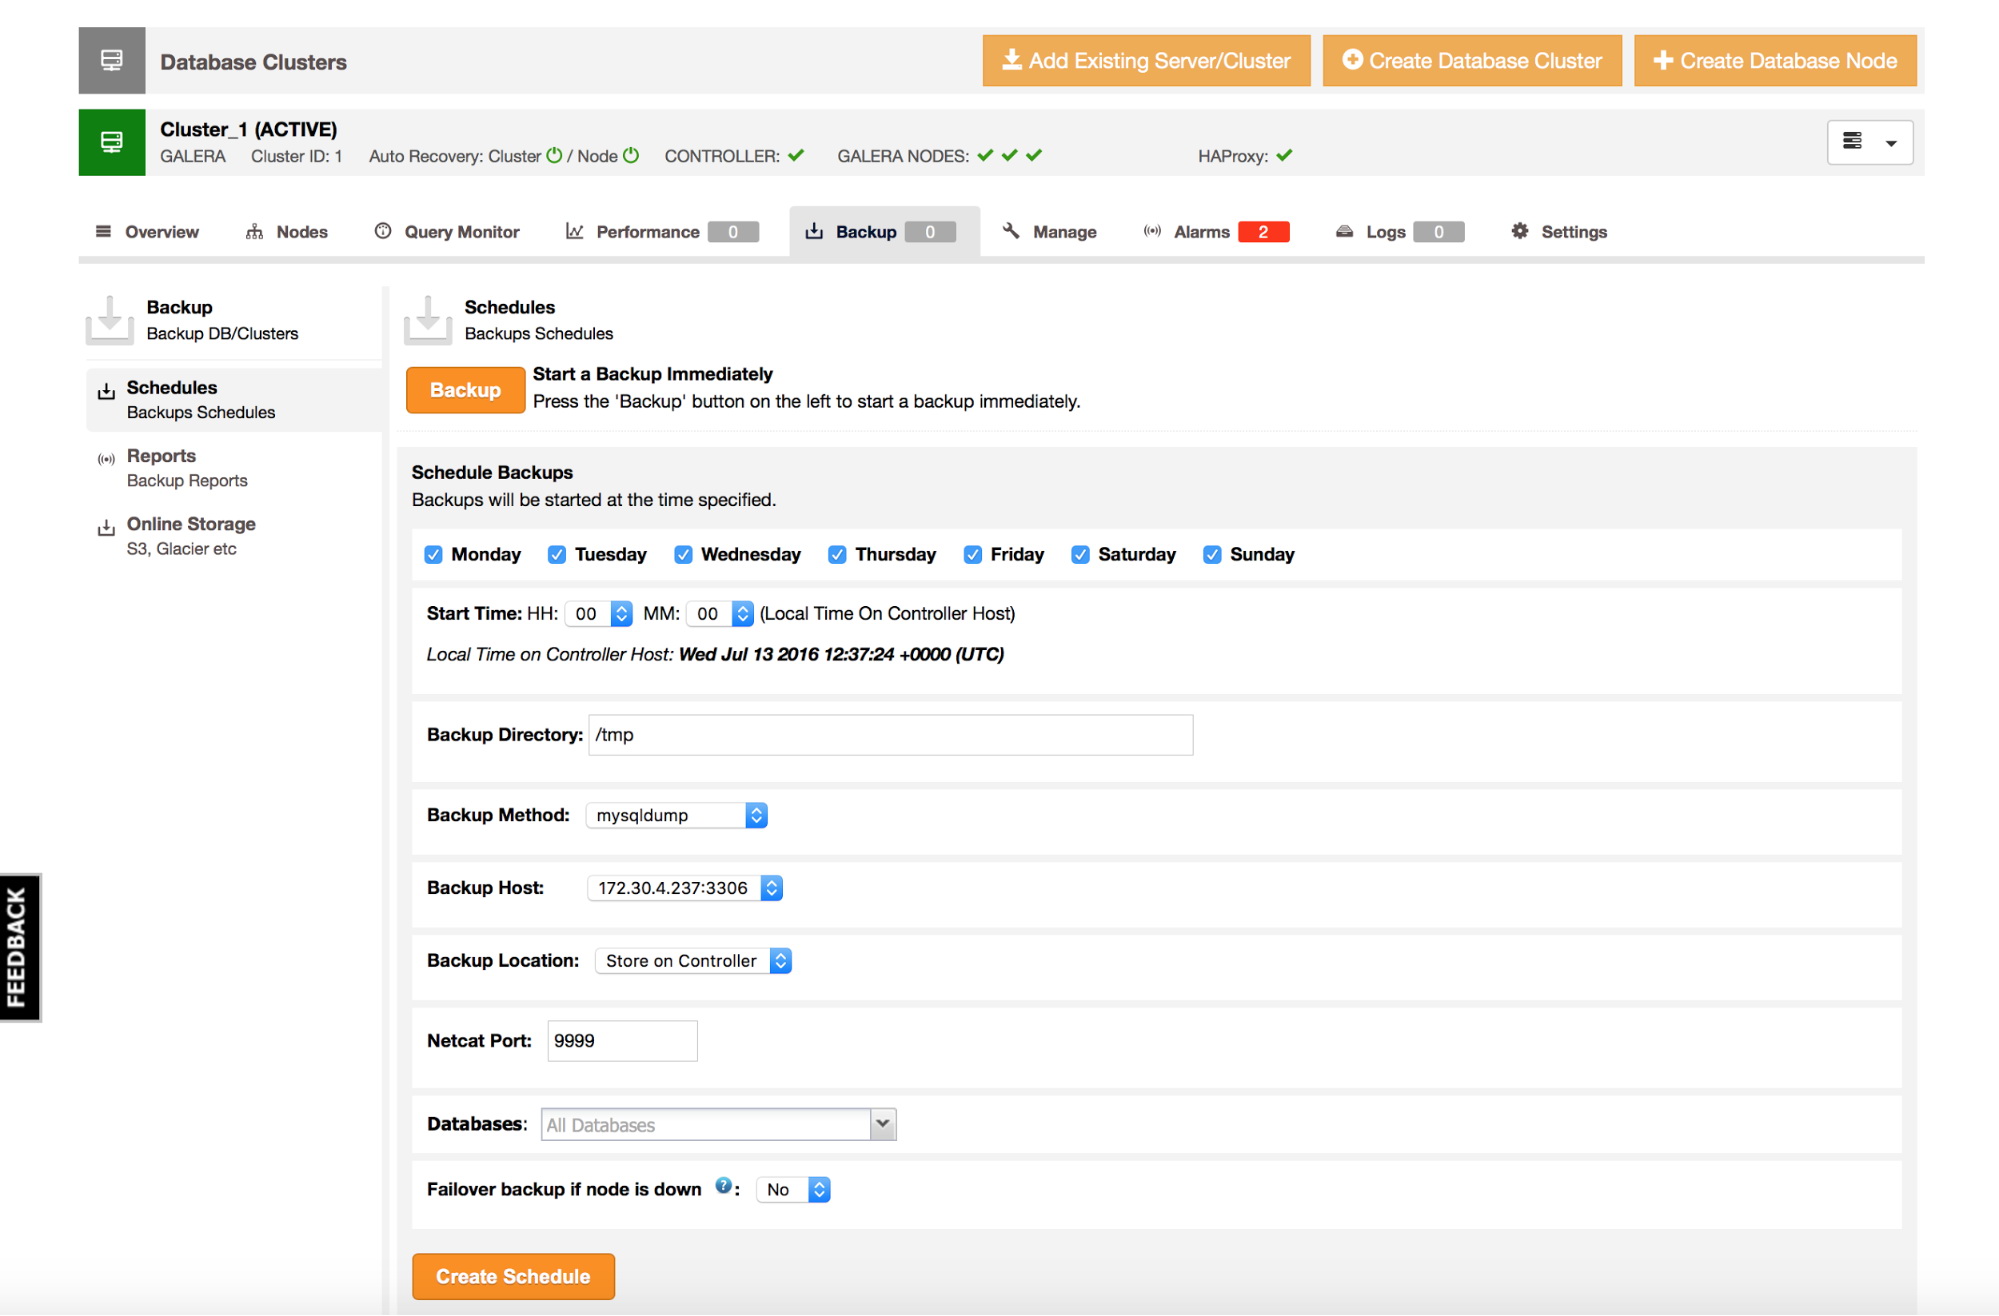
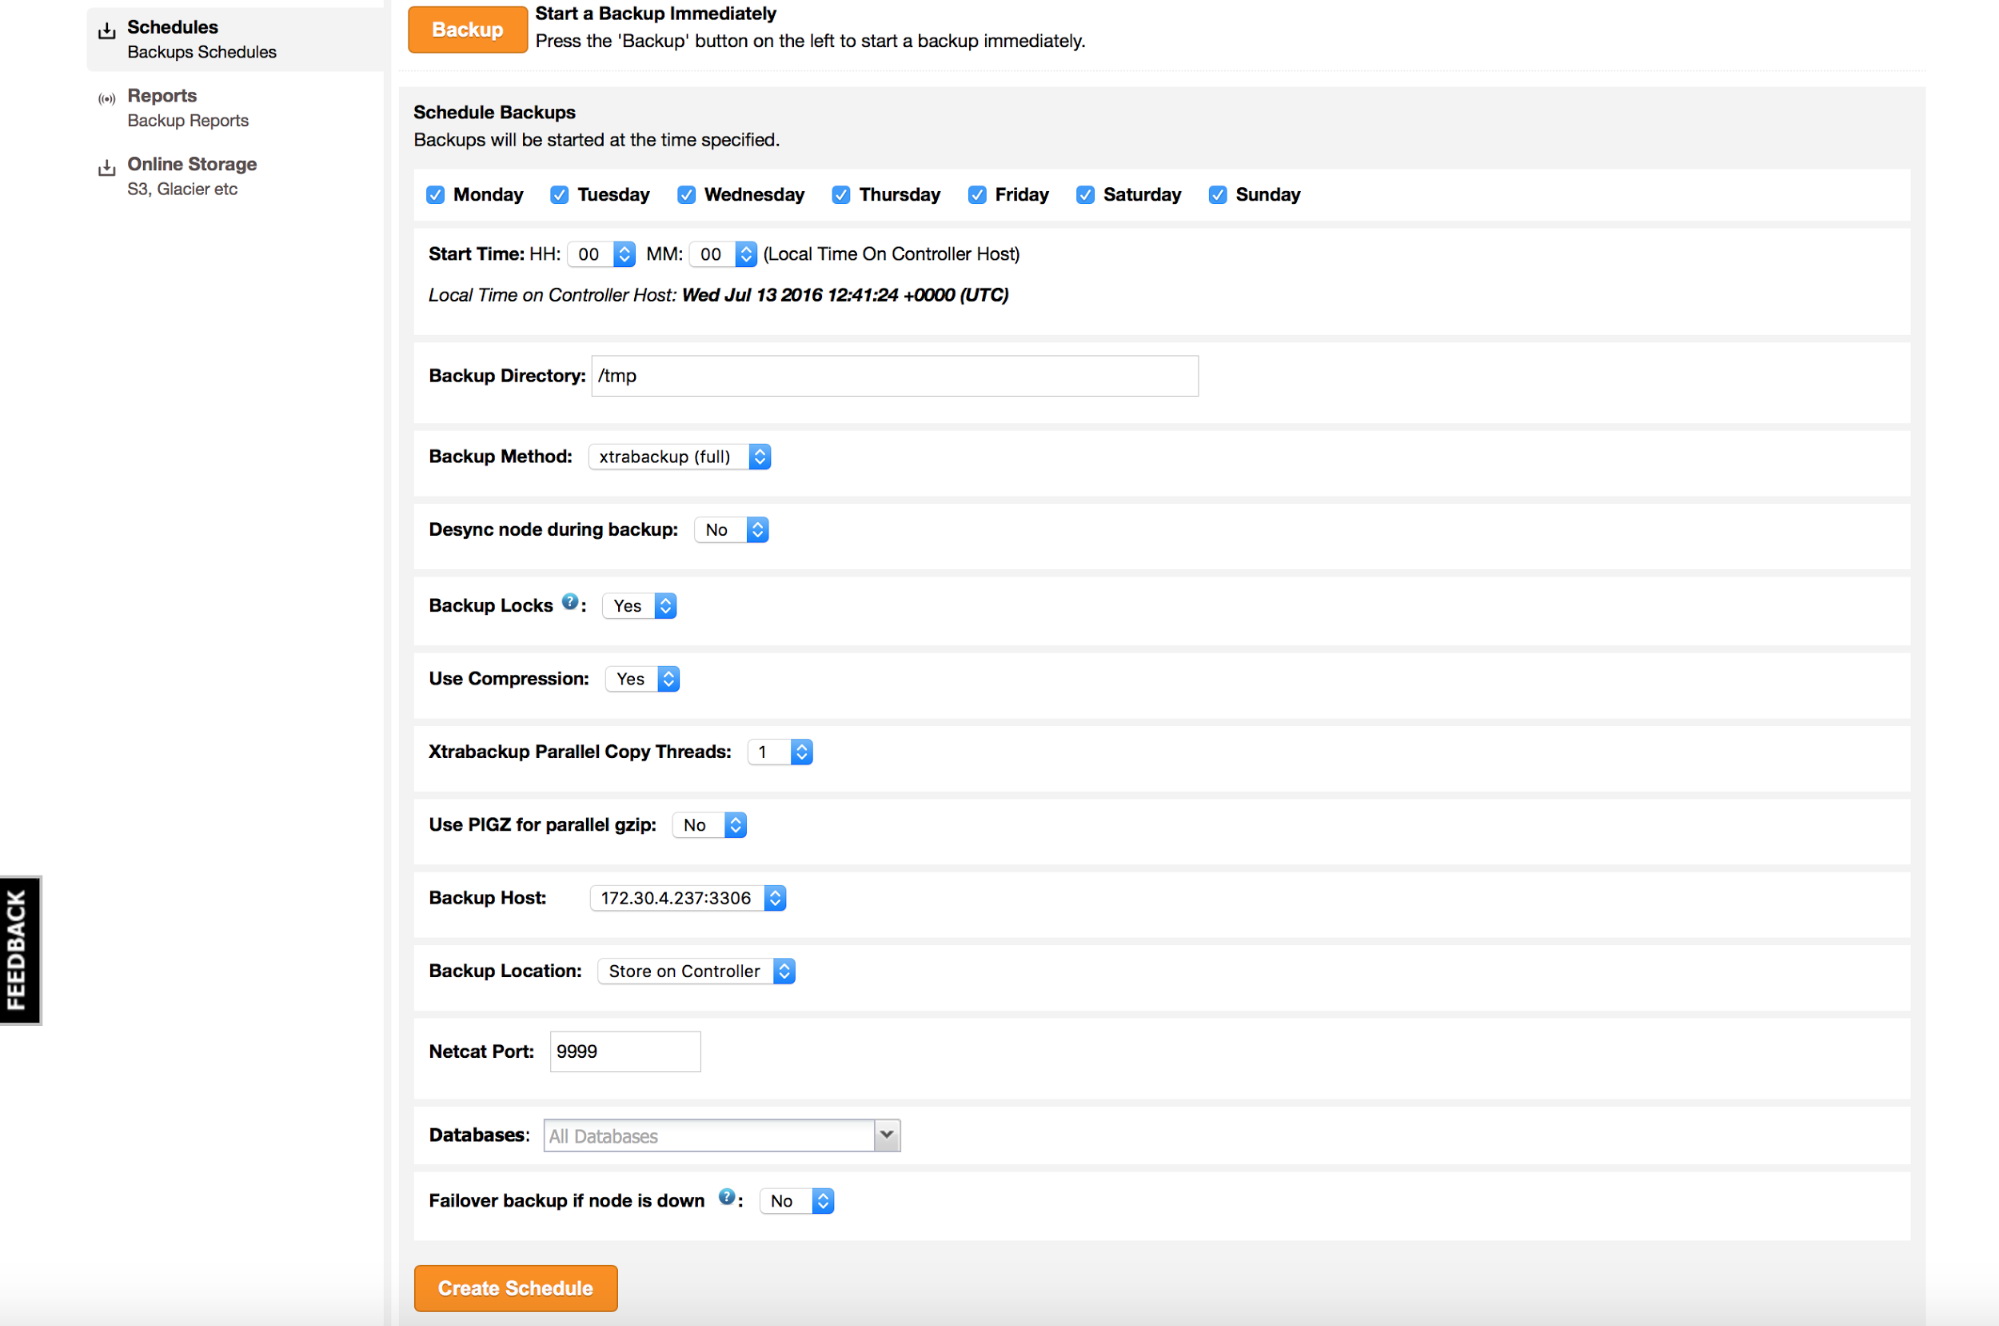
In ClusterControl you can easily schedule these different types of backups. There are a couple of settings to decide on. You can store a backup on the controller or locally, on the database node where the backup is taken. You need to decide on the location in which the backup should be stored, and which databases you’d like to backup - all data set or separate schemas? Depending on which backup type you’ve chosen, there are separate settings to configure. For Xtrabackup and Galera Cluster, you may choose if a node should be desynced or not. Are you going to use backup locks or maybe ‘FLUSH TABLES WITH READ LOCK’ should be used instead? Should the backup be compressed or not?

Which options to use will depend on your particular setup and hardware. For Galera Cluster, to avoid impact on the rest of the cluster, we’d suggest at least to think about desyncing the node for the duration of the backup. Please keep in mind this may also remove your backup node from rotation, this is especially true if you use HAProxy or MaxScale proxies.

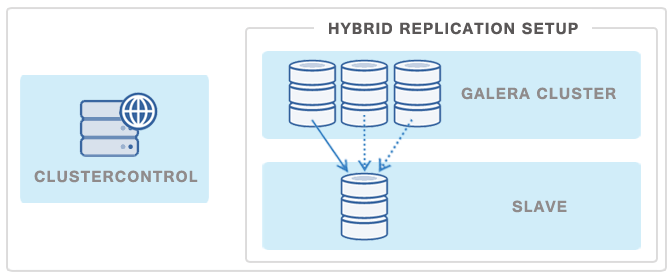
Another popular way of minimizing the impact of a backup on a Galera Cluster or a replication master is to deploy a replication slave and then use it as a source of backups - this way Galera Cluster will not be affected at any point.

You can deploy such a slave in just a few clicks using ClusterControl.

Checking backup status

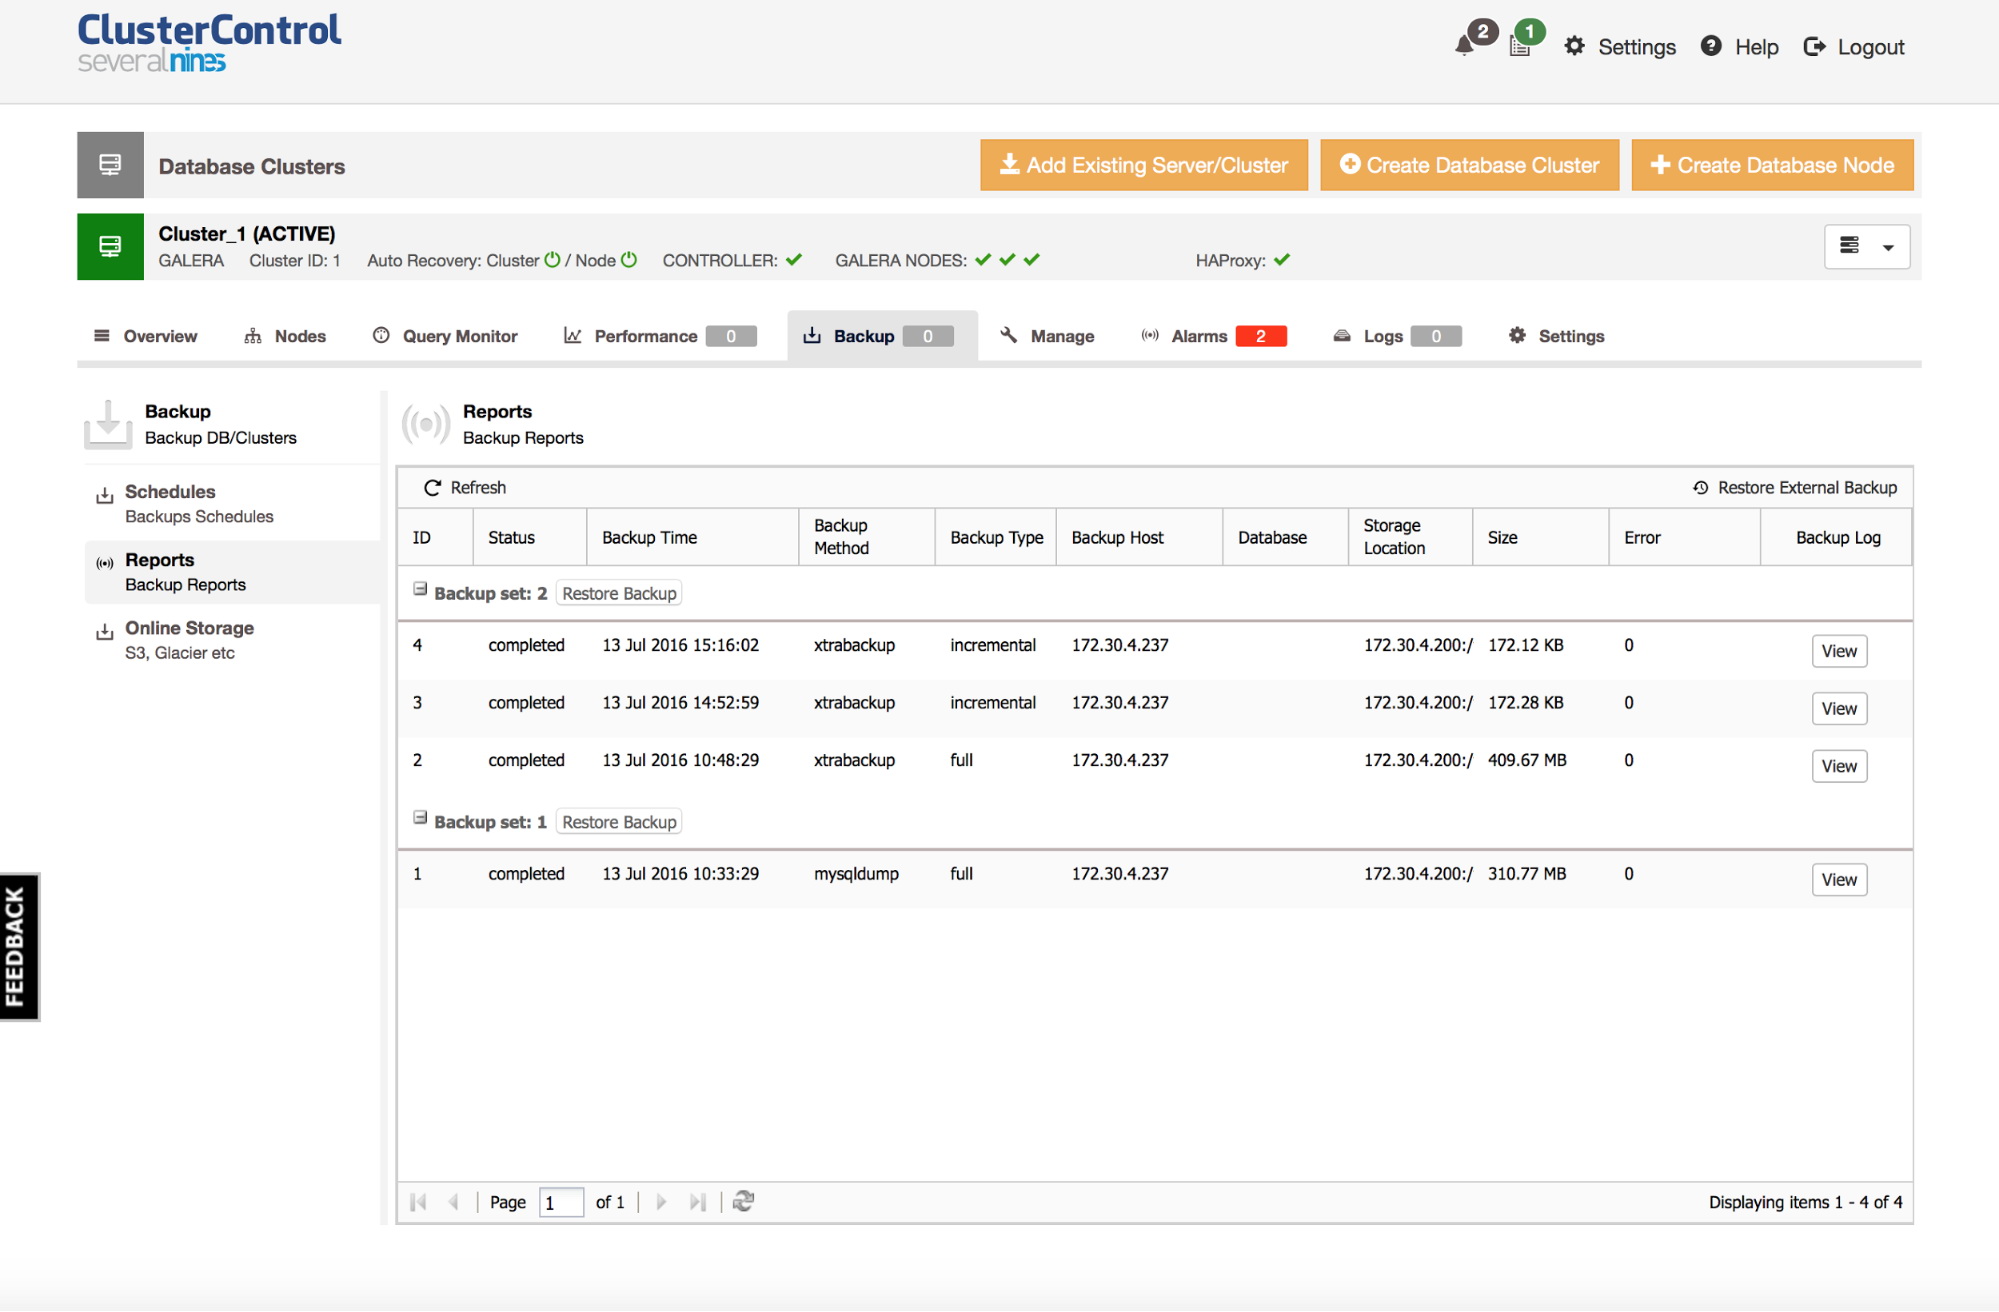
Taking a backup is not enough - you have to check if it actually completed correctly. ClusterControl can help with this. You can go to the Backup -> Reports tab and check the status of your backups. Have they completed successfully? What’s their size - is it as expected? This is a good way to do a quick sanity check - if your dataset is around 1GB of size, there’s no way a full backup can be as small as 100KB - something must have gone wrong at some point. To dig even deeper, you can take a look at the backup log and look for any errors.

Disaster Recovery

Storing backups within the cluster (either directly on a database node or on the ClusterControl host) comes in handy when you want to quickly restore your data: all backup files are in place and can be decompressed and restored promptly. When it comes to disaster recovery, this may not be the best option. Different issues may happen - servers may crash, network may not work reliably, even whole data centers may not be accessible due to some kind of outage. It may happen whether you work with a small service provider with a single data center, or a global vendor like Amazon or Rackspace. It is therefore not safe to keep all your eggs in a single basket - you should make sure you have a copy of your backup stored in some external location. ClusterControl supports Amazon S3 and Glacier services for that .

For those who would like to implement their own DR policies, ClusterControl backups are stored in a nicely structured directory. So it is perfectly fine to build and deploy your own set of scripts and handle DR according to your exact requirements.

Finally, another great way of implementing a Disaster Recovery policy is to use an asynchronous replication slave - something we mentioned earlier in this blog post. You can deploy such asynchronous slave in a remote location, some other data center maybe, and then use it to do backups and store them locally on that slave. Of course, you’d want to take a local backup of your cluster to have it around locally if you’d need to recover the cluster. Moving data between datacenters may take a long time, so having a backup files available locally can save you some time. In case you lose the access to your main production cluster, you may still have an access to the slave. This setup is very flexible - first, you have a running MySQL host with your production data so it shouldn’t be too hard to deploy your full application in the DR site. You’ll also have backups of your production data which you could use to scale out your DR environment.

We hope this gives you enough information to build a safe and reliable backup system.


PlanetMySQL Voting: Vote UP / Vote DOWN

MySQL Cluster 7.2

How to Install Percona XtraDB Cluster on CentOS 7

$
0
0
In this tutorial, I will show you how to install and configure Percona XtraDB Cluster on a CentOS 7 server. We will use Percona XtraDB Cluster 5.6 that is fully compatible to MySQL and the Percona Server.
PlanetMySQL Voting: Vote UP / Vote DOWN

MariaDB 10.1.16 now available

$
0
0

The MariaDB project is pleased to announce the immediate availability of MariaDB 10.1.16. See the release notes and changelog for details on this release. Download MariaDB 10.1.16 Release Notes Changelog What is MariaDB 10.1? MariaDB APT and YUM Repository Configuration Generator Thanks, and enjoy MariaDB!

The post MariaDB 10.1.16 now available appeared first on MariaDB.org.


PlanetMySQL Voting: Vote UP / Vote DOWN

Oracle Open World 2016

$
0
0

oow-logo-2015From September 18–22, 2016 in San Francisco will be held the 2016’s edition of Oracle Open World. The MySQL Team will be well represented with more than 20 sessions related to all the new stuff we released for 5.7 and many other amazing things for 8.0.

I have the honor to present you a tutorial on one of the most wanted feature: Group Replication.

MySQL Group Replication is a new plugin that ensures virtual synchronous updates on any member in a group of MySQL servers, with conflict handling and failure detection. Distributed recovery is also in the package to ease the process of adding new servers to your server group.

This tutorial will be full hands-on. Matt Lord and myself will guide on the process of upgrading your asynchronous replication architecture to the new multi-master group replication !

This is the link to our tutorial: TUT6394

And this is the list of all MySQL related sessions.

I hope to see you there !


PlanetMySQL Voting: Vote UP / Vote DOWN

MySQL Team’s submissions for Percona Live Amsterdam

$
0
0

Two weeks after the big annual event in San Francisco, Oracle Open World 2016 , September 18-22, there will be another MySQL focused event in Europe: Percona Live Amsterdam, October 3-5.

The MySQL Engineering Team and Community Team will be present. We have submitted a list of very interesting talks, mostly related to the upcoming new major release of MySQL.

In an effort to involve the larger community in the talks selections, PLAM’s organization implemented a community voting process for the previous edition. If this will be again the case and if you are interested by our sessions, don’t hesitate to vote, if the vote is available, for the sessions you would like to see or just tweet about them using #perconalive

Here is the list of the talks we submitted:

As you can see, we tried to cover all the main topics and focusing on our new key features like the new support for CTEs, the new data dictionary, Group Replication, using MySQL as a document store with the X Protocol and many other improvements for the future MySQL 8.0 !


PlanetMySQL Voting: Vote UP / Vote DOWN

Upcoming Webinar Wednesday July 20, 11 am PDT: Practical MySQL Performance Optimization

$
0
0
MySQL Performance Optimization

Practical MySQL Performance OptimizationAre you looking to improve your MySQL performance? Application success is often limited by poor MySQL performance. Please join Percona CEO and Founder Peter Zaitsev for this exclusive webinar on Wednesday, July 20th, 2016 at 11:00 AM PDT (UTC – 7) as he presents “Practical MySQL Performance Optimization“.

Peter Zaitsev discusses how to get excellent MySQL performance while being practical. In other words, spending time on what gives you the best return. The webinar updates Peter’s ever-popular Practical MySQL Performance Optimization presentation. It covers the important points for improving MySQL performance. It also includes a discussion of the new tools and features in the latest MySQL 5.7 release, as well as their most important aspects – so you can employ them for maximum database performance.

Areas covered:

  • Hardware
  • MySQL Configuration
  • Schema and Queries
  • Application Architecture
  • MySQL 5.7 New Tools and Features

Peter will highlight practical approaches and techniques for optimizing your time. He will also focus on the queries that are most important for your application. At the end of this webinar, you will know how to optimize MySQL performance in the most practical way.

register-now

Practical MySQL Performance OptimizationPeter Zaitsev, CEO

Peter Zaitsev co-founded Percona and assumed the role of CEO in 2006. As one of the foremost experts on MySQL strategy and optimization, Peter leveraged both his technical vision and entrepreneurial skills to grow Percona from a two-person shop to one of the most respected open source companies in the business. With over 150 professionals in 20 plus countries, Peter’s venture now serves over 3000 customers – including the “who’s who” of internet giants, large enterprises and many exciting startups. Percona was named to the Inc. 5000 in 2013, 2014 and 2015.

Peter was an early employee at MySQL AB, eventually leading the company’s High Performance Group. A serial entrepreneur, Peter co-founded his first startup while attending Moscow State University where he majored in Computer Science. Peter is a co-author of High Performance MySQL: Optimization, Backups, and Replication, one of the most popular books on MySQL performance. Peter frequently speaks as an expert lecturer at MySQL and related conferences, and regularly posts on the Percona Data Performance Blog. He has also been tapped as a contributor to Fortune and DZone, and his recent ebook Practical MySQL Performance Optimization Volume 1 is one of percona.com’s most popular downloads. Peter lives in North Carolina with his wife and two children. In his spare time, Peter enjoys travel and spending time outdoors.


PlanetMySQL Voting: Vote UP / Vote DOWN

Comparison of database encryption methods

All the Webinar Replays for the MySQL, MongoDB or PostgreSQL DBA

$
0
0

Those of you who already follow us know that we’ve been running a number of blog series for some time now that we also deliver as webinar series.

These blog series include:

And for those who are looking to automate the management of all of the above, we also have:

These blog series as well as related topics are covered monthly in our live webinars, which are available to view as replays.

Watch our webinar replays

So whether you’re interested in open source datastores such as MySQL, MariaDB, Percona, MongoDB or MySQL; load balancers such as HAProxy, MaxScale or ProxySQL; whether you’re in DB Ops or DevOps; looking to automate and manage your databases… Chances are that we have a relevant webinar replay for you!

These are the categories you can select from:

  • ClusterControl
  • DB Ops
  • DevOps
  • Galera
  • MongoDB
  • MySQL
  • PostgreSQL
  • Tips & Tricks

Or just perform a search for the topic or keyword of your choice and see what comes up.

We trust that these resources are useful!

If you have a topic you’d like to see covered that we haven’t dealt with yet, please do let us know.


PlanetMySQL Voting: Vote UP / Vote DOWN

Decoded: A Day in the Life of a Database Administrator

$
0
0

Companies know they need a database administrator, but they probably don’t have any clue about what they actually do. The primary duty for a MySQL server DBA is not waking up in a panic because the phone rang so much it fell off the nightstand during their on-call nights. Outside of that situation, a DBA’s function typically revolves around making sure the data is safe, sound and in one piece when the business needs it. Organizations use different database setups to try to confuse new database administrators, even though they typically involve the same day-to-day tasks.

Monitoring and Optimization

When database administrators get to work, they creep quietly into the building in an attempt to avoid end users chasing them down with not-so-priority problems. After a sufficient amount of caffeine, they fire up their monitoring programs to see whether the databases caught on fire overnight. They scan the landscape for potential issues, fix existing problems and make an attempt at optimizing performance, while other departments complain that IT does nothing.

Database Maintenance

Databases demand a lot of attention, so database administrators stay on top of patches, prepare data for migration to new hardware and perform other upgrades. Occasionally they take the database servers out for a walk, but only when they’re stuck on an overnight shift and someone wants to see how well server racks work as bumper cars.

Security

Cyber crime is a major global problem, and data breaches tend to ruin a DBA’s afternoon. They look for ways to keep their databases secure and may venture into the land of the IT security department to enlist additional help in this adventure. Security audits let database administrators discover who forgot to patch critical hardware and software, and end-user account management keeps people from digging around in sensitive data.

Database Deployment

When DBAs walk into the office during a database deployment project, they face the exciting possibility of everything going wrong all at once. The system administrator failed to provision the servers necessary for the work, the other DBAs in the office suspiciously took vacation time for the entirety of the project, and the intern got stuck with all the work. The database administrator’s duty in this situation is to prepare the apologetic email explaining that the project is going to run over time, and, by the way, the company needs five database administrator specialist contractors to make up for the vacationing employees. After a week, everyone in the department forgets what sleep feels like.

Disaster Recovery

A flood may have washed away the entire office, but DBAs will find their work is never done. They get the pleasure of restoring the databases to a working backup and hoping that restoration media didn’t get stored on-site. If the recovery process is successful, the database administrator gets hailed as the company savior for five minutes. No one talks about what happens if it fails.

Database Support

Practically everything is database driven these days, from to-do list apps to the company’s overpriced ERP system. When something goes wrong, the end users’ first response is to open up a trouble ticket and blame the database. A database administrator spends a lot of time going through these requests and figuring out how many of them actually need to go to the help desk. A database administrator then goes through the much smaller pile of support requests relating to databases, figure out how many they can pass off to other departments and grudgingly work on the remaining tickets.

Organizations should spend some time observing a wild database administrator in his or her natural habitat. A business runs on databases, so it’s important to provide this IT animal with the proper tools, food and caffeine to keep everything running smoothly.

The post Decoded: A Day in the Life of a Database Administrator appeared first on Webyog Blog.


PlanetMySQL Voting: Vote UP / Vote DOWN
Viewing all 18841 articles
Browse latest View live


<script src="https://jsc.adskeeper.com/r/s/rssing.com.1596347.js" async> </script>