Magento is a widely used Open Source e-commerce software and content management system for e-commerce websites based on the PHP Zend Framework. It uses MySQL or MariaDB as database backend. In this tutorial, I will show you how to install Magento 2 with Nginx, PHP 7.1 FPM, and MySQL as the database. I will use ubuntu 18.04 (Bionic Beaver) as server operating system.
↧
How to Install Magento 2 with Nginx and Letsencrypt on Ubuntu 18.04
↧
How to drop a column in mysql table
In this 101 article, I will show how to drop/remove a column from a table in MySQL.
In this article I will use an example table:
CREATE TABLE tb(
c1 INT PRIMARY KEY,
c2 char(1),
c3 varchar(2)
) ENGINE=InnoDB;
To remove a column we will make use of ALTER TABLE command:
ALTER TABLE tb DROP COLUMN c2;
The command allows you to remove multiple columns at once:
ALTER TABLE tb DROP COLUMN c2, DROP COLUMN c3;
If you are running MySQL 5.6 onwards, you can make this operation online, allowing other sessions to read and write to your table while the operation is been performed:
ALTER TABLE tb DROP COLUMN c2, ALGORITHM=INPLACE, LOCK=NONE;
Reference:
https://dev.mysql.com/doc/refman/5.7/en/alter-table.html
https://dev.mysql.com/doc/refman/5.7/en/innodb-create-index-overview.html
↧
↧
Understanding ProxySQL
In this post, I will cover a bit of ProxySQL. ProxySQL is a proxy which implements MySQL protocol, allowing it to do things that other proxies cannot do. ProxySQL is gaining a lot of traction nowadays and it’s capable to integrate with a variety of products from MySQL ecosystems, such as replication (master – slave / master – master), Percona XtraDB Cluster and Group Replication.
One of its many functionalities (which IMHO makes it awesome) is the ability to do read/write split seamless to the application. You can start sending reads to your slave without doing a single line of code.
In this article, I will cover a few important points to understand how it works.
Instalation
The instalation is easy, you can do it by downloading the corresponding package for your OS from its official github repo https://github.com/sysown/proxysql/releases
sudo yum install https://github.com/sysown/proxysql/releases/download/v1.4.9/proxysql-1.4.9-1-centos7.x86_64.rpm
Now we just need to start the service
sudo service proxysql start
Interfaces
ProxySQL splits application interface from the admin interface. It will listen on 2 network ports. Admin will be on 6032 and application will listen on 6033 (reverse of 3306 ).
Layers
Other important part to understand how the proxy works is to understand its layers. I am gonna show you a diagram that can be found on its official documentation:
+-------------------------+
|      1. RUNTIME         |
+-------------------------+
       /|\          |
        |           |
        |           |
        |          \|/
+-------------------------+
|     2.  MEMORY          |
+-------------------------+
       /|\          |
        |           |
        |           |
        |          \|/
+-------------------------+
|     3.   DISK           |
+-------------------------+
ProxySQL will always read information from 1.Runtime layer, which is stored in memory.
Every time we connect to the admin port (6032) we are manipulating information from layer 2.Memory. As the name infers, its also stored in memory.
We then have the layer 3.Disk. As the other two layers are stored in memory, we need a layer to persist information across service/server restarts.
What is the benefic of this layout?
It allows us to manipulate different areas and apply the changes at once. We can think about how a transaction works, where we run multiple queries and commit them at once. When we alter something, we will be manipulating the Memory layer, then we will run a command LOAD MYSQL [SERVERS | USERS | QUERY RULES] TO RUNTIME to load this information to runtime and we will save the information to disk layer by issuing SAVE MYSQL [SERVERS | USERS | QUERY RULES] TO DISK.
Hostgroups
ProxySQL group servers in something named hostgroup. In a topology which we have a master and two slaves, we will create a hostgroup(HG) 1 and specify that our master is part of that HG and we will create a HG 2 and specify that both slaves belong to that HG. Hostgroup creation is done at the time we specify servers on mysql_servers table. There is not fixed enumeration, you can create your HG with any ID you want.
Later we will configure user and queries to identify if the query coming in is a read it should be answered by one of the servers from HG 2 (where we configured our slaves). If the query is not a read, then our server on HG 1 will receive it.
Authentication
ProxySQL has functionalities like firewall, in which it has the capability of blocking a query even before it reaches our backend server. To do it it’s required to have the user authentication module also present on the proxy side. So we will be required to create all users that we wish to connect via ProxySQL also create on the proxy side.
Now that you understand a bit of the basic of how ProxySQL works, you can start playing with it.
↧
How to drop a column in mysql table
In this 101 article, I will show how to drop/remove a column from a table in MySQL.
In this article I will use an example table:
CREATE TABLE tb(
c1 INT PRIMARY KEY,
c2 char(1),
c3 varchar(2)
) ENGINE=InnoDB;
To remove a column we will make use of ALTER TABLE command:
ALTER TABLE tb DROP COLUMN c2;
The command allows you to remove multiple columns at once:
ALTER TABLE tb DROP COLUMN c2, DROP COLUMN c3;
If you are running MySQL 5.6 onwards, you can make this operation online, allowing other sessions to read and write to your table while the operation is been performed:
ALTER TABLE tb DROP COLUMN c2, ALGORITHM=INPLACE, LOCK=NONE;
Reference:
https://dev.mysql.com/doc/refman/5.7/en/alter-table.html
https://dev.mysql.com/doc/refman/5.7/en/innodb-create-index-overview.html
↧
Understanding ProxySQL
In this post, I will cover a bit of ProxySQL. ProxySQL is a proxy which implements MySQL protocol, allowing it to do things that other proxies cannot do. ProxySQL is gaining a lot of traction nowadays and it’s capable to integrate with a variety of products from MySQL ecosystems, such as replication (master – slave / master – master), Percona XtraDB Cluster and Group Replication.
One of its many functionalities (which IMHO makes it awesome) is the ability to do read/write split seamless to the application. You can start sending reads to your slave without doing a single line of code.
In this article, I will cover a few important points to understand how it works.
Instalation
The instalation is easy, you can do it by downloading the corresponding package for your OS from its official github repo https://github.com/sysown/proxysql/releases
sudo yum install https://github.com/sysown/proxysql/releases/download/v1.4.9/proxysql-1.4.9-1-centos7.x86_64.rpm
Now we just need to start the service
sudo service proxysql start
Interfaces
ProxySQL splits application interface from the admin interface. It will listen on 2 network ports. Admin will be on 6032 and application will listen on 6033 (reverse of 3306 ).
Layers
Other important part to understand how the proxy works is to understand its layers. I am gonna show you a diagram that can be found on its official documentation:
+-------------------------+
|      1. RUNTIME         |
+-------------------------+
       /|\          |
        |           |
        |           |
        |          \|/
+-------------------------+
|     2.  MEMORY          |
+-------------------------+
       /|\          |
        |           |
        |           |
        |          \|/
+-------------------------+
|     3.   DISK           |
+-------------------------+
ProxySQL will always read information from 1.Runtime layer, which is stored in memory.
Every time we connect to the admin port (6032) we are manipulating information from layer 2.Memory. As the name infers, its also stored in memory.
We then have the layer 3.Disk. As the other two layers are stored in memory, we need a layer to persist information across service/server restarts.
What is the benefic of this layout?
It allows us to manipulate different areas and apply the changes at once. We can think about how a transaction works, where we run multiple queries and commit them at once. When we alter something, we will be manipulating the Memory layer, then we will run a command LOAD MYSQL [SERVERS | USERS | QUERY RULES] TO RUNTIME to load this information to runtime and we will save the information to disk layer by issuing SAVE MYSQL [SERVERS | USERS | QUERY RULES] TO DISK.
Hostgroups
ProxySQL group servers in something named hostgroup. In a topology which we have a master and two slaves, we will create a hostgroup(HG) 1 and specify that our master is part of that HG and we will create a HG 2 and specify that both slaves belong to that HG. Hostgroup creation is done at the time we specify servers on mysql_servers table. There is not fixed enumeration, you can create your HG with any ID you want.
Later we will configure user and queries to identify if the query coming in is a read it should be answered by one of the servers from HG 2 (where we configured our slaves). If the query is not a read, then our server on HG 1 will receive it.
Authentication
ProxySQL has functionalities like firewall, in which it has the capability of blocking a query even before it reaches our backend server. To do it it’s required to have the user authentication module also present on the proxy side. So we will be required to create all users that we wish to connect via ProxySQL also create on the proxy side.
Now that you understand a bit of the basic of how ProxySQL works, you can start playing with it.
↧
↧
Analyze MySQL & MariaDB Error Log Messages using Monyog
The MySQL error log is an essential part of database server performance monitoring. Whenever something goes wrong or performance degrades, the Error Logs are usually the first place we look to start troubleshooting.
The MySQL Error Log is one of three related log types:
- The Error Log: It contains information about errors that occur while the server is running (as well as server start and stop events).
- The General Query Log: This is a general record of what mysqld is doing (connect, disconnect, queries).
- The Slow Query Log: It consists of “slow” SQL statements as defined in the long_query_time global variable.
You can enable error log monitoring to allow Monyog to keep an eye on your MySQL Error Log, and notify you when something goes awry. Moreover, Monyog combines the General Query, Slow Query and Error logs in a single view for both network and cloud servers. For example, in the case of Amazon RDS, Monyog utilizes the Amazon RDS Application Programming Interface (API).
In the Error Logging in MySQL 8 blog article, we were introduced to MySQL’s new component-based architecture. This new architectural model is more modular because components may only interact with each other through the services they provide. Services provided by components are available to the server as well as to other components.
These changes have added to error logging flexibility. Case in point, log messages may now be output with a particular format and output either to a file or the system log.
The improved flexibility correlates to an equal increase configuration complexity as a log component can be a filter or a sink:
- A filter processes log events, to add, remove, or modify individual event fields, or to delete events entirely.
- A sink is a destination (writer) for log events. Typically, a sink processes log events into log messages that have a particular format and writes these messages to its associated output, such as a file or the system log.
For users of Monyog, these complexities are a non-issue, as Monyog makes error log monitoring a straight-forward process of entering log details on the Settings screen and then viewing output on the Monitors screen.
This blog will describe how to configure your MySQL/MariaDB Error Log settings, view output, and glean useful insights from error messages.
What Goes in the Error Log?
The MySQL Error Log may contain messages of varying severities. It collects messages that require persistence beyond that of a single connection or the server’s runtime, that have an intended audience of the DBA or system administrator, as opposed to the application developer. Though the latter may sometimes find the Error Log contents instructive as well. Examples of Error Log entries include exhaustion of resources on the host machine, certain errors reported by the host operating system, stack traces of crashes, messages about damaged databases and indexes, errors on start-up, failed or refused connections, etc.
The error log contains a record of mysqld startup and shutdown times. It also contains diagnostic messages such as errors, warnings, and notes that occur during server startup and shutdown, and while the server is running. For example, if mysqld comes across a table that needs to be checked or repaired, it writes a message to the error log.
On some operating systems, the error log contains a stack trace if mysqld exits abnormally. The trace can be used to determine where mysqld exited.
Configuring Error Log Settings
Monitoring the error log is crucial as changes to the log are indicative of disastrous outages. Monyog makes the task of monitoring the error log very simple. All one needs to do is configure Monyog, and it will take care of the rest! Monyog will alert you of changes in the error log, and in addition, if there is an entry of type [ERROR] in the log, Monyog will extract the corresponding message and send an email it to designated persons.
The Error Log is disabled in MySQL and MariaDB by default, so we have to enable it before Monyog can read and analyze it. To do that:
- Navigate to the SERVERS screen and click on the ellipsis […] to open the context menu (#1 in the image below).
- Choose the Edit Server item from the context menu (#2 in the image below).
-
On the Server Settings dialog (#3 in the image below):
-
- Click on the ADVANCED header to bring up the advanced server settings (#3A in the image below).
- Select MySQL Server Log from the tree on the left-hand side of the dialog (#3B in the image below).
-

To configure error log monitoring:
-
To Click the Enable error log monitoring toggle switch so that the slider moves to the right. The background color will also go from grey to blue:
![]()
- You can either enter the error log FILE PATH manually, or you let Monyog get the path of the error log from the MySQL server for you. Just click on the Fetch button to the right of the FILE PATH text field, and Monyog will locate the file!
-
The READ FILE FROM field sets how Monyog will access the Error Log File. There are 3 ways of accessing the log files:
- Select Local path if the Error Log File resides on the same machine that Monyog is running on or on a shared network drive.
- Choose Via SFTP if you have configured Monyog to use SSH. You’ll then have to supply your SSH details.
-
Select RDS/Aurora (Using API) if your server is an RDS/Aurora instance. For file-based logging, you’ll have to fill four additional fields, as follows:
- DB instance identifier: A unique name to identify your RDS/Aurora instance.
- Instance region: The region in which your instance is hosted, e.g: “us-east-1”
- Access key ID: It is a 20 character long key ID which can be created from the AWS Management console. It is used to make programmatic requests to AWS.
- Secret access key: It is 40 characters long and can be created from the AWS Management console.
-
Click the TEST READING THE FILE button to check if Monyog can access the file specified in the File path. A message will appear in the bottom right corner of the browser window:
![]()
- You can APPLY THE SETTING TO Only this server or All servers with tags same as this server.


Click the SAVE button to save your Server Settings and close the dialog.
Viewing the Error Log File
MySQL Log data is combined on the MySQL Logs screen. Like all monitors, it can show log information for multiple servers. The MySQL Logs screen is accessible via the Monitors icon (on the left-hand toolbar) > MySQL Logs (in the MONITOR GROUP list).
The MySQL Log screen displays multiple servers side-by-side:

This MySQL Log screen shows the local Sakila server:

The MySQL Error Log occupies the first three rows of the MONITORS table:
- MONyog able to read MySQL error log?: A Yes/No value indicating whether Monyog is able to access the MySQL error log. If No is indicated, go back to the Error Log Settings screen and make sure that Error Log monitoring is enabled and that Monyog can read the file.
- New entries in error log?: This Yes/No value indicates whether the error log has changed during the selected TIMEFRAME.
- Recent entries of type [ERROR]: MySQL logs three kinds of Log entries – Notes, Warnings, and Errors. Any log entries recorded with an [ERROR] type are displayed here.
Getting the Most out of the MySQL Log Screen
The MySQL Log Screen does a lot more than display server errors. In addition to alerting you of changes in the error log, Monyog provides useful information about each monitor, as well as historical data. It can even extract the message from [ERROR] entries and send them to you via email.
Monitor Editing
Monitor names are actually clickable links that open the associated EDIT MONITOR screen at the right of the screen. It’s a screen where you can view and modify monitor parameters.

Here’s a description of the form fields. Mandatory fields are marked with an asterisk (*):
- Name*: The name of the monitor.
- Monitor Group*: The monitor group that this monitor belongs to.
- Type of counter: Choices include MySQL, System, or Custom SQL.
- MySQL or System indicate that this Monitor displays MySQL or system-related information respectively, while Custom SQL indicates that this Monitor is based on a Custom SQL Object. Only MySQL is applicable to existing Error Log monitors.
- Enabled?: A toggle switch indicating whether or not the monitor is enabled. Moving the slider to the right enables the monitor while moving it to the left turns the monitor off. The background color will also go from grey to blue when the monitor is enabled.
- Formula: A MySQL server parameter on which the value of this counter is based. None are applicable to the Error Log, so this field should normally be left blank.
- Value: This specifies a JavaScript function that computes the value. For example, this code fetches the last Error Log entry:
-
function x()
{
val = MONyog.MySQL.ErrorLog.Last_error;
if(typeof val == “undefined” || val == 0 || val == “”)
return “(n/a)”;
else
return val;
} - Description: A detailed summary of the monitor.
- Advice text: Provides additional information about the monitor, such as how to interpret its output as well as how to correct potential problems.
Setting Alerts
Monyog tells you that a monitor reading could be pointing to a potential issue to investigate by placing a Red or Yellow alert next to it. For example, here is a Critical alert next to a Log Error entry:

Alert settings are configured on the Alerts tab of the EDIT MONITOR screen.

The Email Recipients textbox accepts a comma-delimited list of email addresses to send notifications to when an alert is triggered. Clicking the Advanced link divides recipients into Critical and Warning lists.
You can turn Notifications on and off via the Notifications slider control. Note that you also have to configure SMTP or(and) SNMP for MONyog and Notification Settings for servers for this feature to work.
You can also override the notification settings via the Override notify when stable? and Override notify till stable? fields. Each includes radio buttons for “Yes”, “No”, and “Disable”. If set to “Disable”, this variable will not override the server-level setting.
When notifications are enabled for a monitor, the Notifications enabled icon appears beside the monitor name:
![]()
Viewing Historical Trend Values
The term “Trend Analysis” refers to the concept of collecting information in an effort to spot a pattern, or trend, in the data. With respect to database administration, analyzing history reports gives a way to track trends and identify problem areas in your infrastructure. The idea is that, by using historical information to find recurring problems, you may be able to prevent future issues.
Each server column cell has a History trend value icon on the right-hand side. Clicking it displays historical trend data for the selected TIMEFRAME.
![]()
Clicking the SHOW ONLY CHANGED VALUES slider toggles between all log entries and only those where the value has changed.


Conclusion
An essential part of database server performance monitoring, the MySQL error log is usually the first place we look to start troubleshooting database issues. In today’s blog, we learned how Monyog facilitates error log monitoring on MySQL and MariaDB servers by combining all of the log output together on one screen. Moreover, Monyog offers additional value by providing features such as Alerts, Notifications, and History Trend Values.
The post Analyze MySQL & MariaDB Error Log Messages using Monyog appeared first on Monyog Blog.
↧
Impact of sharding on query performance in MySQL Cluster

A new week of blogs about our development in MySQL Cluster 7.6.
After working a long time on a set of new developments, there is a lot
of things to describe. I will continue this week with discussing sharding
and NDB, a new cloud feature in 7.6 and provide some benchmark
results on restart performance in 7.6 compared to 7.5. I am also planning
a comparative analysis for a few more versions of NDB.
In the blog serie I have presented recently we have displayed
the performance impact of various new features in MySQL Cluster
7.5 and 7.6. All these benchmarks were executed with tables that
used 1 partition. The idea behind this is that to develop a
scalable application it is important to develop partition-aware
applications.
A partition-aware application will ensure that all partitions
except one is pruned away from the query. Thus they get the same
performance as a query on a single-partition table.
Now in this blog we analyse the difference on using 1 partition
per table and using 8 partitions per table.
The execution difference is that with 8 partitions we have to
dive into the tree 8 times instead of one time and we have to
take the startup cost of the scan as well. At the same time
using 8 partitions means that we get some amount of parallelism
in the query execution and this speeds up query execution during
low concurrency.
Thus there are two main difference with single-partition scans
and multi-partition scans.
The first difference is that the parallelism decreases the latency
of query execution at low concurrency. More partitions means a higher
speedup.
The second difference is that the data node will spend more CPU to
execute the query for multi-partition scans compared to single-partition
scans.
Most of the benchmarks I have shown are limited by the cluster connection
used. Thus we haven't focused so much on the CPU usage in data nodes.
Thus in the graph above the improvement of query speed is around 20% at
low concurrency. The performance difference for other concurrency levels
is small, the multi-partition scans uses more CPU. The multi-partition
scans is though a bit more variable in its throughput.
Tests where I focused more on data node performance showed around 10%
overhead for multi-partition scans compared to single-partition scans
in a similar setup.
An interesting observation is that although most of the applications
should be developed with partition-aware queries, those queries that
are not pruned to one partition will be automatically parallelised.
This is the advantage of the MySQL Cluster auto-sharded architecture.
In a sharded setup using any other DBMS it is necessary to ensure that
all queries are performed in only one shard since there are no automatic
queries over many shards. This means that partition-aware queries will
be ok to handle in only one data server, but the application will have to
calculate where this data server resides. Cross-shard queries have to be
automatically managed though, both sending queries in parallel to
many shards and merging the results from many shards.
With NDB all of this is automatic. If the query is partition-aware,
it will be automatically directed to the correct shard (node group
in NDB). If the query isn't partition-aware and thus a cross-shard
query, it is automatically parallelised. It is even possible to
push join queries down into the NDB data nodes to execute the
join queries using a parallel linked-join algorithm.
As we have shown in earlier blogs and will show even more in coming
blogs NDB using the Read Backup feature will ensure that read queries
are directed to a data node that is as local as possible to the MySQL
Server executing the query. This is true also for join queries being pushed
down to the NDB data nodes.
↧
MySQL 8.0 Data Dictionary
We are all familiar with “.frm” files since the earliest days of MySQL, The community has been continuously requesting for replacement of file-system based metadata for several good reasons, So with MySQL 8.0 “.frm” files are gone for ever, Going forward MySQL stores table metadata in the data dictionary tables which uses InnoDB storage engine. This blog is about MySQL 8.0 data dictionary and how it creates value for MySQL going forward:
How file based metadata management used to work in the past (before MySQL 8.0) ?
- Every table in MySQL will have corresponding .frm file, This .frm file stores information like column names and data-types in the binary format, In addition to the .frm file, there are .trn, .trg and .par files to support triggers, trigger namespace and partitioning .
What are major bottlenecks faced due to the usage of file based metadata management ?
- Operationally it always appeared very irrational, Why we need to have an separate mechanism to track the schema information ? Originally this was the idea from Drizzle – Drizzle made it very clear (almost ) that it should get out of the way and let the storage engines be the storage engines and not try to second guess them or keep track of things behind their back.
- Dictionaries out of synch.– Before MySQL 8.0, the data dictionary is a “split brain”, where the “server” and InnoDB have their own separate data dictionary, where some information duplicated. Information that is duplicated in the MySQL server dictionary and the InnoDB dictionary might get out of synch, and we need one common “source of truth” for dictionary information.
- INFORMATION_SCHEMA is the bottleneck– The main reason behind these performance issues in the INFORMATION_SCHEMA (before MySQL 8.0) implementation is that INFORMATION_SCHEMA tables are implemented as temporary tables that are created on-the-fly during query execution. For a MySQL server having hundreds of databases, each with hundreds of tables within them, the INFORMATION_SCHEMA query would end-up doing lot of I/O reading each individual FRM files from the file system. And it would also end-up using more CPU cycles in effort to open the table and prepare related in-memory data structures. It does attempt to use the MySQL server table cache (the system variable ‘table_definition_cache‘), however in large server instances it’s very rare to have a table cache that is large enough to accommodate all of these tables.
- No atomic DDL– Storing the data dictionary in non-transactional tables and files, means that DDLs are unsafe for replication (they are not transactional, not even atomic). If a compound DDL fails we still need to replicate it and hope that it fails with the same error. This is a best effort approach and there is a lot of logic coded to handle this . It is hard to maintain, slows down progress and bloats the replication codebase. The data dictionary is stored partly in non-transactional tables. These are not safe for replication building resilient HA systems on top of MySQL. For instance, some dictionary tables need to be manipulated using regular DML, which causes problems for GTIDs.
- Crash recovery. Since the DDL statements are not atomic, it is challenging to recover after crashing in the middle of a DDL execution, and is especially problematic for replication.
How things are changed with MySQL 8.0 ?
MySQL 8.0 introduced a native data dictionary based on InnoDB. This change has enabled us to get rid of file-based metadata store (FRM files) and also help MySQL to move towards supporting transactional DDL. We have now the metadata of all database tables stored in transactional data dictionary tables, it enables us to design an INFORMATION_SCHEMA table as a database VIEW over the data dictionary tables. This eliminates costs such as the creation of temporary tables for each INFORMATION_SCHEMA query during execution on-the-fly, and also scanning file-system directories to find FRM files. It is also now possible to utilize the full power of the MySQL optimizer to prepare better query execution plans using indexes on data dictionary tables.
The following diagram (Source: MySQL server team blog) explains the difference in design in MySQL 5.7 and 8.0 :
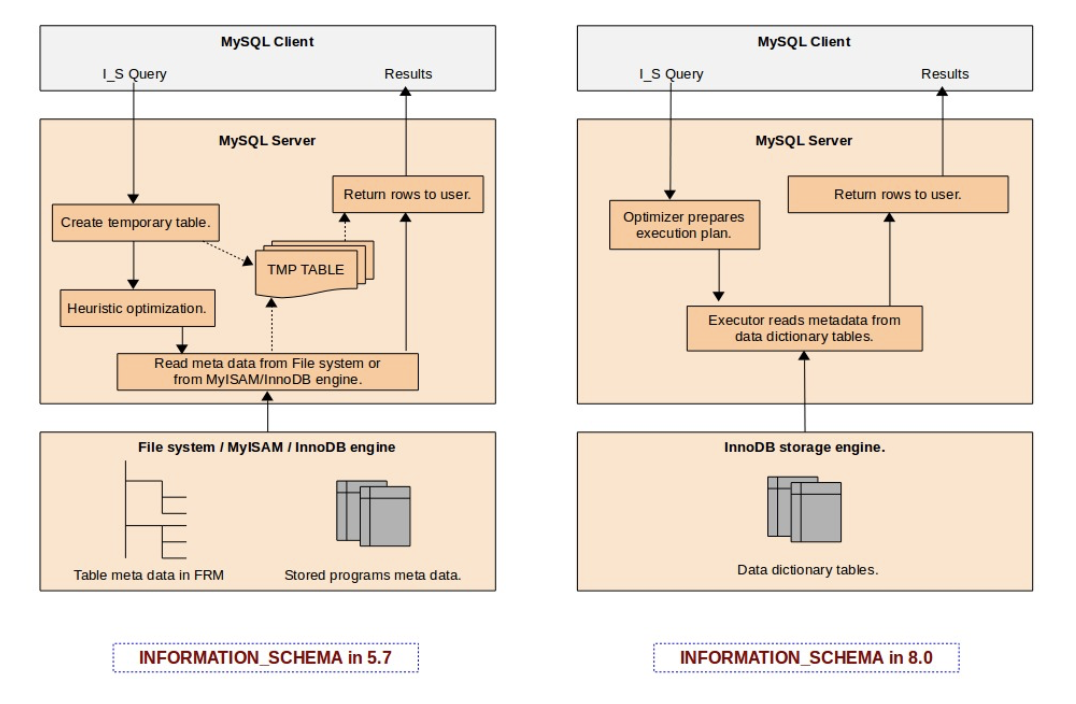
The post MySQL 8.0 Data Dictionary appeared first on MySQL Consulting, Support and Remote DBA Services By MinervaDB.
↧
ProxySQL Experimental Feature: Native ProxySQL Clustering

ProxySQL 1.4.2 introduced native clustering, allowing several ProxySQL instances to communicate with and share configuration updates with each other. In this blog post, I’ll review this new feature and how we can start working with 3 nodes.
Before I continue, let’s review two common methods to installing ProxySQL.
ProxySQL as a centralized server
This is the most common installation, where ProxySQL is between application servers and the database. It is simple, but without any high availability. If ProxySQL goes down you lose all connectivity to the database.

ProxySQL on app instances
Another common setup is to install ProxySQL onto each application server. This is good because the loss of one ProxySQL/App server will not bring down the entire application.

For more information about the previous installation, please visit this link Where Do I Put ProxySQL?
Sometimes our application and databases grow fast. Maybe you need add a loadbalancer, for example, and in that moment you start thinking … “What could I do to configure and maintain all these ProxySQL nodes without mistakes?”
To do that, there are many tools like Ansible, Puppet, and Chef, but you will need write/create/maintain scripts to do those tasks. This is really difficult to administer for one person.
Now, there is a native solution, built into ProxySQL, to create and administer a cluster in an easy way.
At the moment this feature is EXPERIMENTAL and subject to change. Think very carefully before installing it in production, in fact I strongly recommend you wait. However, if you would like to start testing this feature, you need to install ProxySQL 1.4.2, or better.
This clustering feature is really useful if you have installed one ProxySQL per application instance, because all the changes in one of the ProxySQL nodes will be propagated to all the other ProxySQL nodes. You can also configure a “master-slave” style setup with ProxySQL clustering.
There are only 4 tables where you can make changes and propagate the configuration:
- mysql_query_rules
- mysql_servers
- mysql_users
- proxysql_servers
How does it work?
It’s easy. When you make a change like INSERT/DELETE/UPDATE on any of these tables, after running the command
LOAD … TO RUNTIME, ProxySQL creates a new checksum of the table’s data and increments the version number in the table runtime_checksums_values. Below we can see an example.
admin ((none))>SELECT name, version, FROM_UNIXTIME(epoch), checksum FROM runtime_checksums_values ORDER BY name;
+-------------------+---------+----------------------+--------------------+
| name              | version | FROM_UNIXTIME(epoch) | checksum           |
+-------------------+---------+----------------------+--------------------+
| admin_variables   | 0       | 1970-01-01 00:00:00  |                    |
| mysql_query_rules | 1       | 2018-04-26 15:58:23  | 0x0000000000000000 |
| mysql_servers     | 1       | 2018-04-26 15:58:23  | 0x0000000000000000 |
| mysql_users       | 4       | 2018-04-26 18:36:12  | 0x2F35CAB62143AE41 |
| mysql_variables   | 0       | 1970-01-01 00:00:00  |                    |
| proxysql_servers  | 1       | 2018-04-26 15:58:23  | 0x0000000000000000 |
+-------------------+---------+----------------------+--------------------+
Internally, all nodes are monitoring and communicating with all the other ProxySQL nodes. When another node detects a change in the checksum and version (both at the same time), each node will get a copy of the table that was modified, make the same changes locally, and apply the new config to RUNTIME to refresh the new config, make it visible to the applications connected and automatically save it to DISK for persistence.

The following setup creates a “synchronous cluster” so any changes to these 4 tables on any ProxySQL server will be replicated to all other ProxySQL nodes. Be careful!
How can I start testing this new feature?
1) To start we need to get at least 2 nodes. Download and install ProxySQL 1.4.2 or higher and start a clean version.
2) On all nodes, we need to update the following global variables. These changes will set the username and password used by each node’s internal communication to cluster1/clusterpass. These must be the same on all nodes in this cluster.
update global_variables set variable_value='admin:admin;cluster1:clusterpass' where variable_name='admin-admin_credentials';
update global_variables set variable_value='cluster1' where variable_name='admin-cluster_username';
update global_variables set variable_value='clusterpass' where variable_name='admin-cluster_password';
update global_variables set variable_value=200 where variable_name='admin-cluster_check_interval_ms';
update global_variables set variable_value=100 where variable_name='admin-cluster_check_status_frequency';
update global_variables set variable_value='true' where variable_name='admin-cluster_mysql_query_rules_save_to_disk';
update global_variables set variable_value='true' where variable_name='admin-cluster_mysql_servers_save_to_disk';
update global_variables set variable_value='true' where variable_name='admin-cluster_mysql_users_save_to_disk';
update global_variables set variable_value='true' where variable_name='admin-cluster_proxysql_servers_save_to_disk';
update global_variables set variable_value=3 where variable_name='admin-cluster_mysql_query_rules_diffs_before_sync';
update global_variables set variable_value=3 where variable_name='admin-cluster_mysql_servers_diffs_before_sync';
update global_variables set variable_value=3 where variable_name='admin-cluster_mysql_users_diffs_before_sync';
update global_variables set variable_value=3 where variable_name='admin-cluster_proxysql_servers_diffs_before_sync';
load admin variables to RUNTIME;
save admin variables to disk;
3) Add all IPs from the other ProxySQL nodes into each other node:
INSERT INTO proxysql_servers (hostname,port,weight,comment) VALUES ('10.138.180.183',6032,100,'PRIMARY');
INSERT INTO proxysql_servers (hostname,port,weight,comment) VALUES ('10.138.244.108',6032,99,'SECONDARY');
INSERT INTO proxysql_servers (hostname,port,weight,comment) VALUES ('10.138.244.244',6032,98,'SECONDARY');
LOAD PROXYSQL SERVERS TO RUNTIME;
SAVE PROXYSQL SERVERS TO DISK;
At this moment, we have all nodes synced.
In the next example from the log file, we can see when node1 detected node2.
[root@proxysql1 ~]# $ tail /var/lib/proxysql/proxysql.log
...
2018-05-10 11:19:51 [INFO] Cluster: Fetching ProxySQL Servers from peer 10.138.244.108:6032 started
2018-05-10 11:19:51 [INFO] Cluster: Fetching ProxySQL Servers from peer 10.138.244.108:6032 completed
2018-05-10 11:19:51 [INFO] Cluster: Loading to runtime ProxySQL Servers from peer 10.138.244.108:6032
2018-05-10 11:19:51 [INFO] Destroyed Cluster Node Entry for host 10.138.148.242:6032
2018-05-10 11:19:51 [INFO] Cluster: Saving to disk ProxySQL Servers from peer 10.138.244.108:6032
2018-05-10 11:19:52 [INFO] Cluster: detected a new checksum for proxysql_servers from peer 10.138.180.183:6032, version 6, epoch 1525951191, checksum 0x3D819A34C06EF4EA . Not syncing yet ...
2018-05-10 11:19:52 [INFO] Cluster: checksum for proxysql_servers from peer 10.138.180.183:6032 matches with local checksum 0x3D819A34C06EF4EA , we won't sync.
2018-05-10 11:19:52 [INFO] Cluster: closing thread for peer 10.138.148.242:6032
2018-05-10 11:19:52 [INFO] Cluster: detected a new checksum for proxysql_servers from peer 10.138.244.244:6032, version 4, epoch 1525951163, checksum 0x3D819A34C06EF4EA . Not syncing yet ...
2018-05-10 11:19:52 [INFO] Cluster: checksum for proxysql_servers from peer 10.138.244.244:6032 matches with local checksum 0x3D819A34C06EF4EA , we won't sync
...
Another example is to add users to the table mysql_users. Remember these users are to enable MySQL connections between the application (frontend) and MySQL (backend).
We will add a new username and password on any server; in my test I’ll use node2:
admin proxysql2 ((none))>INSERT INTO mysql_users(username,password) VALUES ('user1','crazyPassword');
Query OK, 1 row affected (0.00 sec)
admin proxysql2 ((none))>LOAD MYSQL USERS TO RUNTIME;
Query OK, 0 rows affected (0.00 sec)
In the log file from node3, we can see the update immediately:
[root@proxysql3 ~]# $ tail /var/lib/proxysql/proxysql.log
...
2018-05-10 11:30:57 [INFO] Cluster: detected a new checksum for mysql_users from peer 10.138.244.108:6032, version 2, epoch 1525951873, checksum 0x2AF43564C9985EC7 . Not syncing yet ...
2018-05-10 11:30:57 [INFO] Cluster: detected a peer 10.138.244.108:6032 with mysql_users version 2, epoch 1525951873, diff_check 3. Own version: 1, epoch: 1525950968. Proceeding with remote sync
2018-05-10 11:30:57 [INFO] Cluster: detected a peer 10.138.244.108:6032 with mysql_users version 2, epoch 1525951873, diff_check 4. Own version: 1, epoch: 1525950968. Proceeding with remote sync
2018-05-10 11:30:57 [INFO] Cluster: detected peer 10.138.244.108:6032 with mysql_users version 2, epoch 1525951873
2018-05-10 11:30:57 [INFO] Cluster: Fetching MySQL Users from peer 10.138.244.108:6032 started
2018-05-10 11:30:57 [INFO] Cluster: Fetching MySQL Users from peer 10.138.244.108:6032 completed
2018-05-10 11:30:57 [INFO] Cluster: Loading to runtime MySQL Users from peer 10.138.244.108:6032
2018-05-10 11:30:57 [INFO] Cluster: Saving to disk MySQL Query Rules from peer 10.138.244.108:6032
2018-05-10 11:30:57 [INFO] Cluster: detected a new checksum for mysql_users from peer 10.138.244.244:6032, version 2, epoch 1525951857, checksum 0x2AF43564C9985EC7 . Not syncing yet ...
2018-05-10 11:30:57 [INFO] Cluster: checksum for mysql_users from peer 10.138.244.244:6032 matches with local checksum 0x2AF43564C9985EC7 , we won't sync.
2018-05-10 11:30:57 [INFO] Cluster: detected a new checksum for mysql_users from peer 10.138.180.183:6032, version 2, epoch 1525951886, checksum 0x2AF43564C9985EC7 . Not syncing yet ...
2018-05-10 11:30:57 [INFO] Cluster: checksum for mysql_users from peer 10.138.180.183:6032 matches with local checksum 0x2AF43564C9985EC7 , we won't sync.
...
What happens if some node is down?
In this example, we will see and find out what happens if one node is down or has a network glitch, or other issue. I’ll stop ProxySQL node3:
[root@proxysql3 ~]# service proxysql stop
Shutting down ProxySQL: DONE!
On ProxySQL node1, we can check that node3 is unreachable:
[root@proxysql1 ~]# tailf /var/lib/proxysql/proxysql.log
2018-05-10 11:57:33 ProxySQL_Cluster.cpp:180:ProxySQL_Cluster_Monitor_thread(): [WARNING] Cluster: unable to connect to peer 10.138.244.244:6032 . Error: Can't connect to MySQL server on '10.138.244.244' (107)
2018-05-10 11:57:33 ProxySQL_Cluster.cpp:180:ProxySQL_Cluster_Monitor_thread(): [WARNING] Cluster: unable to connect to peer 10.138.244.244:6032 . Error: Can't connect to MySQL server on '10.138.244.244' (107)
2018-05-10 11:57:33 ProxySQL_Cluster.cpp:180:ProxySQL_Cluster_Monitor_thread(): [WARNING] Cluster: unable to connect to peer 10.138.244.244:6032 . Error: Can't connect to MySQL server on '10.138.244.244' (107)
And another check can be run in any ProxySQL node like node2, for example:
admin proxysql2 ((none))>SELECT hostname, checksum, FROM_UNIXTIME(changed_at) changed_at, FROM_UNIXTIME(updated_at) updated_at FROM stats_proxysql_servers_checksums WHERE name='proxysql_servers' ORDER BY hostname;
+----------------+--------------------+---------------------+---------------------+
| hostname       | checksum           | changed_at          | updated_at          |
+----------------+--------------------+---------------------+---------------------+
| 10.138.180.183 | 0x3D819A34C06EF4EA | 2018-05-10 11:19:39 | 2018-05-10 12:01:59 |
| 10.138.244.108 | 0x3D819A34C06EF4EA | 2018-05-10 11:19:38 | 2018-05-10 12:01:59 |
| 10.138.244.244 | 0x3D819A34C06EF4EA | 2018-05-10 11:19:39 | 2018-05-10 11:56:59 |
+----------------+--------------------+---------------------+---------------------+
3 rows in set (0.00 sec)
In the previous result, we can see node3 (10.138.244.244) is not being updated; the column updated_at should have a later datetime. This means that node3 is not running (or is down or network glitch).
At this point, any change to any of the tables, mysql_query_rules, mysql_servers, mysql_users, proxysql_servers, will be replicated between nodes 1 & 2.
In this next example, while node3 is offline, we will add another user to mysql_users table.
admin proxysql2 ((none))>INSERT INTO mysql_users(username,password) VALUES ('user2','passwordCrazy');
Query OK, 1 row affected (0.00 sec)
admin proxysql2 ((none))>LOAD MYSQL USERS TO RUNTIME;
Query OK, 0 rows affected (0.00 sec)
That change was propagated to node1:
[root@proxysql3 ~]# $ tail /var/lib/proxysql/proxysql.log
...
2018-05-10 12:12:36 [INFO] Cluster: detected a peer 10.138.244.108:6032 with mysql_users version 3, epoch 1525954343, diff_check 4. Own version: 2, epoch: 1525951886. Proceeding with remote sync
2018-05-10 12:12:36 [INFO] Cluster: detected peer 10.138.244.108:6032 with mysql_users version 3, epoch 1525954343
2018-05-10 12:12:36 [INFO] Cluster: Fetching MySQL Users from peer 10.138.244.108:6032 started
2018-05-10 12:12:36 [INFO] Cluster: Fetching MySQL Users from peer 10.138.244.108:6032 completed
2018-05-10 12:12:36 [INFO] Cluster: Loading to runtime MySQL Users from peer 10.138.244.108:6032
2018-05-10 12:12:36 [INFO] Cluster: Saving to disk MySQL Query Rules from peer 10.138.244.108:6032
...
We keep seeing node3 is out of sync about 25 minutes ago.
admin proxysql2 ((none))>SELECT hostname, checksum, FROM_UNIXTIME(changed_at) changed_at, FROM_UNIXTIME(updated_at) updated_at FROM stats_proxysql_servers_checksums WHERE name='mysql_users' ORDER BY hostname;
+----------------+--------------------+---------------------+---------------------+
|      hostname  |     checksum       |     changed_at      |      updated_at     |
+----------------+--------------------+---------------------+---------------------+
| 10.138.180.183 | 0x3D819A34C06EF4EA | 2018-05-10 11:19:39 | 2018-05-10 12:21:35 |
| 10.138.244.108 | 0x3D819A34C06EF4EA | 2018-05-10 11:19:38 |2018-05-10 12:21:35  |
| 10.138.244.244 | 0x3D819A34C06EF4EA | 2018-05-10 11:19:39 |2018-05-10 12:21:35  |
+----------------+--------------------+---------------------+---------------------+
3 rows in set (0.00 sec)
Let’s start node3 and check if the sync works. node3 should connect to the other nodes and get the last changes.
[root@proxysql3 ~]# tail /var/lib/proxysql/proxysql.log
...
2018-05-10 12:30:02 [INFO] Cluster: detected a peer 10.138.244.108:6032 with mysql_users version 3, epoch 1525954343, diff_check 3. Own version: 1, epoch: 1525955402. Proceeding with remote sync
2018-05-10 12:30:02 [INFO] Cluster: detected a peer 10.138.180.183:6032 with mysql_users version 3, epoch 1525954356, diff_check 3. Own version: 1, epoch: 1525955402. Proceeding with remote sync
…
2018-05-10 12:30:03 [INFO] Cluster: detected peer 10.138.180.183:6032 with mysql_users version 3, epoch 1525954356
2018-05-10 12:30:03 [INFO] Cluster: Fetching MySQL Users from peer 10.138.180.183:6032 started
2018-05-10 12:30:03 [INFO] Cluster: Fetching MySQL Users from peer 10.138.180.183:6032 completed
2018-05-10 12:30:03 [INFO] Cluster: Loading to runtime MySQL Users from peer 10.138.180.183:6032
2018-05-10 12:30:03 [INFO] Cluster: Saving to disk MySQL Query Rules from peer 10.138.180.183:6032
Looking at the status from the checksum table, we can see node3 is now up to date.
admin proxysql2 ((none))>SELECT hostname, checksum, FROM_UNIXTIME(changed_at) changed_at, FROM_UNIXTIME(updated_at) updated_at FROM stats_proxysql_servers_checksums WHERE name='mysql_users' ORDER BY hostname;
+----------------+--------------------+---------------------+---------------------+
| hostname | checksum | changed_at | updated_at |
+----------------+--------------------+---------------------+---------------------+
| 10.138.180.183 | 0x3D819A34C06EF4EA | 2018-05-10 11:19:39 | 2018-05-10 12:21:35 |
| 10.138.244.108 | 0x3D819A34C06EF4EA | 2018-05-10 11:19:38 |2018-05-10 12:21:35 |
| 10.138.244.244 | 0x3D819A34C06EF4EA | 2018-05-10 11:19:39 |2018-05-10 12:21:35 |
+----------------+--------------------+---------------------+---------------------+
3 rows in set (0.00 sec)admin proxysql2 ((none))>SELECT hostname, checksum, FROM_UNIXTIME(changed_at) changed_at, FROM_UNIXTIME(updated_at) updated_at FROM stats_proxysql_servers_checksums WHERE name='mysql_users' ORDER BY hostname;
+----------------+--------------------+---------------------+---------------------+
| hostname | checksum | changed_at | updated_at |
+----------------+--------------------+---------------------+---------------------+
| 10.138.180.183 | 0x3928F574AFFF4C65 | 2018-05-10 12:12:24 | 2018-05-10 12:31:58 |
| 10.138.244.108 | 0x3928F574AFFF4C65 | 2018-05-10 12:12:23 | 2018-05-10 12:31:58 |
| 10.138.244.244 | 0x3928F574AFFF4C65 | 2018-05-10 12:30:19 | 2018-05-10 12:31:58 |
+----------------+--------------------+---------------------+---------------------+
3 rows in set (0.00 sec)
Now we have 3 ProxySQL nodes up to date. This example didn’t add any MySQL servers, hostgroups, etc, because the functionality is the same. The post is intended as an introduction to this new feature and how you can create and test a ProxySQL cluster.
Just remember that this is still an experimental feature and is subject to change with newer versions of ProxySQL.
Summary
This feature is really needed if you have more than one ProxySQL running for the same application in different instances. It is easy to maintain and configure for a single person and is easy to create and attach new nodes.
Hope you find this post helpful!
References
http://www.proxysql.com/blog/proxysql-cluster
http://www.proxysql.com/blog/proxysql-cluster-part2
http://www.proxysql.com/blog/proxysql-cluster-part3-mysql-servers
https://github.com/sysown/proxysql/wiki/ProxySQL-Cluster
The post ProxySQL Experimental Feature: Native ProxySQL Clustering appeared first on Percona Database Performance Blog.
↧
↧
MariaDB 10.3 support Oracle mode sequences
Sequences are used to requesting unique values on demand, The best use case of sequences is to have a unique ID. , that can be used across multiple tables. In some cases sequences are really helpful to have an identifier before an actual row is inserted. With the normal way of having an automatically incrementing identifier, the identifier value will only be available after insert of the row and the identifier will only be unique inside its own table. MariaDB Server 10.3 follows the standard and includes compatibility with the way Oracle does sequences introduced in Oracle Database Server on top of the standard.
Simple steps to create a sequence in MariaDB 10.3 onwards, a create statement is used:
MariaDB [MDB101]> CREATE SEQUENCE Seq1_100
    -> START WITH 100
    -> INCREMENT BY 1;
Query OK, 0 rows affected (0.015 sec)
This creates a sequence that starts at 100 and is incremented with 1 every time a value is requested from the sequence. The sequence will be visible among the tables in the database, i.e. if you run SHOW TABLES it will be there. You can use DESCRIBE on the sequence to see what columns it has.
To test out the usage of sequences let’s create a table:
MariaDB [MDB101]> CREATE TABLE TAB1 (
    -> Col1 int(10) NOT NULL,
    -> Col2 varchar(30) NOT NULL,
    -> Col3 int(10) NOT NULL,
    ->  PRIMARY KEY (Col1)
    -> );
Query OK, 0 rows affected (0.018 sec)
Since we want to use sequences this time, we did not put AUTO_INCREMENT on the Col1 column. Instead we will ask for the next value from the sequence in the INSERT statements:
MariaDB [MDB101]> INSERT INTO TAB1 (Col1, Col2, Col3) VALUES (NEXT VALUE FOR Seq1_100, 'India', 10);
Query OK, 1 row affected (0.011 sec)

MariaDB [MDB101]> INSERT INTO TAB1 (Col1, Col2, Col3) VALUES (NEXT VALUE FOR Seq1_100, 'Jakarta', 20);
Query OK, 1 row affected (0.008 sec)

MariaDB [MDB101]> INSERT INTO TAB1 (Col1, Col2, Col3) VALUES (NEXT VALUE FOR Seq1_100, 'Singapore', 20);
Query OK, 1 row affected (0.016 sec)

MariaDB [MDB101]> INSERT INTO TAB1 (Col1, Col2, Col3) VALUES (NEXT VALUE FOR Seq1_100, 'Japan', 30);
Query OK, 1 row affected (0.007 sec)
Instead of having the NEXT VALUE FOR in each INSERT statement, it could have been the default value of the column in this way:
MariaDB [MDB101]> ALTER TABLE TAB1 MODIFY Col1 int(10) NOT NULL DEFAULT NEXT VALUE FOR Seq1_100;
Query OK, 0 rows affected (0.007 sec)
Records: 0  Duplicates: 0  Warnings: 0
Running a SELECT over the TAB1 table will look like this:
MariaDB [MDB101]> SELECT * FROM TAB1;;
+------+-----------+------+
| Col1 | Col2      | Col3 |
+------+-----------+------+
|  100 | India     |   10 |
|  101 | Jakarta   |   20 |
|  102 | Singapore |   20 |
|  103 | Japan     |   30 |
+------+-----------+------+
4 rows in set (0.000 sec)
As we can see the Col1 column has been populated with numbers that start from 100 and are incremented with 1 as defined in the sequence’s CREATE statement. To get the last retrieved number from the sequence PREVIOUS VALUE is used:
MariaDB [MDB101]> SELECT PREVIOUS VALUE FOR Seq1_100;
+-----------------------------+
| PREVIOUS VALUE FOR Seq1_100 |
+-----------------------------+
|                         103 |
+-----------------------------+
1 row in set (0.000 sec)
MariaDB 10.3 shipped another very useful option for sequences is CYCLE, which means that we start again from the beginning after reaching a certain value. For example, if there are 5 phases in a process that are done sequentially and then start again from the beginning, we could easily create a sequence to always be able to retrieve the number of the next phase:
MariaDB [MDB101]> CREATE SEQUENCE Seq1_100_c5
    ->   START WITH 100
    ->   INCREMENT BY 1
    -> MAXVALUE = 200
    -> CYCLE;
Query OK, 0 rows affected (0.012 sec)
The sequence above starts at 100 and is incremented with 1 every time the next value is requested. But when it reaches 200 (MAXVALUE) it will restart from 100 (CYCLE).
We can also set the next value of a sequence, to ALTER a sequence or using sequences in Oracle mode with Oracle specific syntax. To switch to Oracle mode use:
MariaDB [MDB101]> SET SQL_MODE=ORACLE;
Query OK, 0 rows affected (0.000 sec)
After that you can retrieve the next value of a sequence in Oracle style:
MariaDB [MDB101]> SELECT Seq1_100.nextval;
+------------------+
| Seq1_100.nextval |
+------------------+
|              104 |
+------------------+
1 row in set (0.009 sec)
You can read about MariaDB sequences in the documentation, MariaDB documentation
The post MariaDB 10.3 support Oracle mode sequences appeared first on MySQL Consulting, Support and Remote DBA Services By MinervaDB.
↧
Benchmark of new cloud feature in MySQL Cluster 7.6

In previous blogs we have shown how MySQL Cluster can use the Read Backup
feature to improve performance when the MySQL Server and the NDB data
node are colocated.
There are two scenarios in a cloud setup where additional measures are
needed to ensure localized read accesses even when using the Read Backup
feature.
The first scenario is when data nodes and MySQL Servers are not colocated.
In this case by default we have no notion of closeness between nodes in
the cluster.
The second case is when we have multiple node groups and using colocated
data nodes and MySQL Server. In this case we have a notion of closeness
to the data in the node group we are colocated with, but not to other
node groups.
In a cloud setup the closeness is dependent on whether two nodes are in
the same availability domain (availability zone in Amazon/Google) or not.
In your own network other scenarios could exist.
In MySQL Cluster 7.6 we added a new feature where it is possible
to configure nodes to be contained in a certain location domain.
Nodes that are close to each other should be configured to be part of
the same location domain. Nodes belonging to different location domains
are always considered to be further away than the one with the same
location domain.
We will use this knowledge to always use a transaction coordinator placed
in the same location domain and if possible we will always read from a
replica placed in the same location domain as the transaction coordinator.
We use this feature to direct reads to a replica that is contained
in the same availability domain.
This provides a much better throughput for read queries in MySQL Cluster
when the data nodes and MySQL servers span multiple availability domains.
In the figure below we see the setup, each sysbench application is working
against one MySQL Server, both of these are located in the same availability
domain. The MySQL Server works against a set of 3 replicas in the NDB data
nodes. Each of those 3 replicas reside in a different availabilty domain.
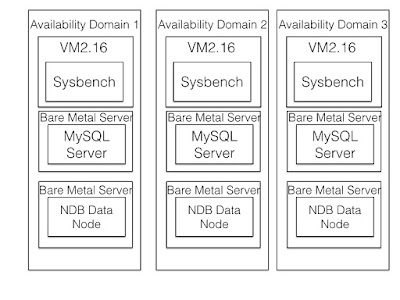
The graph above shows the difference between using location domain ids in
this setup compared to not using them. The lacking measurements is missing
simply because there wasn't enough time to complete this particular
benchmark, but the measurements show still the improvements possible and
the improvement is above 40%.
The Bare Metal Server used for data nodes was the DenseIO2 machines and
the MySQL Server used a bare metal server without any attached disks and
not even any block storage is needed in the MySQL Server instances. The
MySQL Servers in an NDB setup are more or stateless, all the required state
is available in the NDB data nodes. Thus it is quite ok to start up a MySQL
Server from scratch all the time. The exception is when the MySQL Server
is used for replicating to another cluster, in this case the binlog state is required
to be persistent on the MySQL Server.
↧
How to drop a column in mysql table
In this 101 article, I will show how to drop/remove a column from a table in MySQL.
In this article I will use an example table:
CREATE TABLE tb(
c1 INT PRIMARY KEY,
c2 char(1),
c3 varchar(2)
) ENGINE=InnoDB;
To remove a column we will make use of ALTER TABLE command:
ALTER TABLE tb DROP COLUMN c2;
The command allows you to remove multiple columns at once:
ALTER TABLE tb DROP COLUMN c2, DROP COLUMN c3;
If you are running MySQL 5.6 onwards, you can make this operation online, allowing other sessions to read and write to your table while the operation is been performed:
ALTER TABLE tb DROP COLUMN c2, ALGORITHM=INPLACE, LOCK=NONE;
Reference:
https://dev.mysql.com/doc/refman/5.7/en/alter-table.html
https://dev.mysql.com/doc/refman/5.7/en/innodb-create-index-overview.html
↧
MySQL 8.0 Group Replication Limitations
We build highly available and fault tolerant MySQL database infrastructure operations for some of the largest internet properties in this planet, Our consulting team spend several hours daily researching on MySQL documentation and MySQL blogs to understand what are the best possible ways we can build optimal, scalable, highly available and reliable database infrastructure operations for planet-scale web properties. The most common approach towards building a fault-tolerant system is to make all the components in the ecosystem redundant, To make it even simple, component can be removed and system should continue to operate as expected. MySQL replication is an proven method to build redundant database infrastructure operations, operationally these systems are highly complex, requiring maintenance and administration of several servers instead of just one, You need Sr. DBAs to manage such systems.
MySQL Group Replication can operate in both single-primary mode with automatic primary election, where only one server accepts updates at a time and multi-primary mode, where all servers can accept updates, even if they are issued concurrently. The built-in group membership service retains view of the group consistent and available for all servers at any given point in time, Servers can leave and join the group and the view is updated accordingly. If servers leave the group unexpectedly, the failure detection mechanism detects this and notifies the group that the view has changed, All this happens automatically !
For any transaction to commit, the majority of group members have to agree on the order of a given transaction in the global sequence of transactions. Decision to commit or abort a transaction is taken by respective servers, but all servers make same decision. In the case of systems built on network partition, When the members of the group are unable to reach agreement on a transaction, the system halt till the issue is resolved, This guarantees split-brain protection mechanism.
All these fault tolerance mechanisms are powered by Group Communication System (GCS) protocols, a group membership service, and completely safe ordered message delivery system. Group Replication is powered by Paxos algorithm (https://en.wikipedia.org/wiki/Paxos_(computer_science)), which acts as the group communication engine.
Till now, we have just posted about the capabilities of Group Replication, Now we have mentioned below (in bullets) about all the limitations of Group Replication:
- set –binlog-checksum=NONE – Group replication cannot benefit from –binlog-checksum due to the design limitation of replication event checksums.
- Gap Locks not supported – The information about gap locks are not available outside InnoDB so certification process cannot acknowledge gap locks .
- Table Locks and Named Locks not supported – Certification process will not acknowledge table / named locks.
- Concurrent DDL versus DML Operations – Concurrent data definition statements and data manipulation statements executing against the same object but on different servers is not supported when using multi-primary mode. During execution of Data Definition Language (DDL) statements on an object, executing concurrent Data Manipulation Language (DML) on the same object but on a different server instance has the risk of conflicting DDL executing on different instances not being detected.
- Very Large Transactions. Individual transactions that result in GTID contents which are large enough that it cannot be copied between group members over the network within a 5 second window can cause failures in the group communication. To avoid this issue try and limit the size of your transactions as much as possible. For example, split up files used with LOAD DATA INFILE into smaller chunks.
- Multi-primary Mode Deadlock. When a group is operating in multi-primary mode, SELECT … FOR UPDATE statements can result in a deadlock. This is because the lock is not shared across the members of the group, therefore the expectation for such a statement might not be reached.
The post MySQL 8.0 Group Replication Limitations appeared first on MySQL Consulting, Support and Remote DBA Services By MinervaDB.
↧
↧
PXC loves firewalls (and System Admins loves iptables)

 Let them stay together.
In the last YEARS, I have seen quite often that users, when installing a product such as PXC, instead of spending five minutes to understand what to do just run
iptables -Fand save.
In short, they remove any rules for their firewall.
With this post, I want to show you how easy it can be to do the right thing instead of putting your server at risk. I’ll show you how a slightly more complex setup like PXC (compared to MySQL), can be easily achieved without risky shortcuts.
iptables is the utility used to manage the chains of rules used by the Linux kernel firewall, which is your basic security tool.
Linux comes with a wonderful firewall built into the kernel. As an administrator, you can configure this firewall with interfaces like ipchains — which we are not going to cover — and iptables, which we shall talk about.
iptables is stateful, which means that the firewall can make decisions based on received packets. This means that I can, for instance, DROP a packet if it’s coming from bad-guy.com.
I can also create a set of rules that either will allow or reject the package, or that will redirect it to another rule. This potentially can create a very complex scenario.
However, for today and for this use case let’s keep it simple… Looking at my own server:
iptables -v -L
Chain INPUT (policy ACCEPT 0 packets, 0 bytes)
 pkts bytes target     prot opt in     out     source               destination
 250K   29M ACCEPT     all  --  any    any     anywhere             anywhere             state RELATED,ESTABLISHED
    6   404 ACCEPT     icmp --  any    any     anywhere             anywhere
    0     0 ACCEPT     all  --  lo     any     anywhere             anywhere
    9   428 ACCEPT     tcp  --  any    any     anywhere             anywhere             state NEW tcp dpt:ssh
    0     0 ACCEPT     tcp  --  any    any     anywhere             anywhere             state NEW tcp dpt:mysql
    0     0 ACCEPT     tcp  --  any    any     anywhere             anywhere
  210 13986 REJECT     all  --  any    any     anywhere             anywhere             reject-with icmp-host-prohibited
Chain FORWARD (policy ACCEPT 0 packets, 0 bytes)
 pkts bytes target     prot opt in     out     source               destination
    0     0 REJECT     all  --  any    any     anywhere             anywhere             reject-with icmp-host-prohibited
Chain OUTPUT (policy ACCEPT 241K packets, 29M bytes)
 pkts bytes target     prot opt in     out     source               destination
That’s not too bad, my server is currently accepting only SSH and packets on port 3306. Please note that I used the -v option to see more information like IN/OUT and that allows me to identify that actually row #3 is related to my loopback device, and as such it’s good to have it open.
The point is that if I try to run the PXC cluster with these settings it will fail, because the nodes will not be able to see each other.
A quite simple example when try to start the second node of the cluster:
2018-05-21T17:56:14.383686Z 0 [Note] WSREP: (3cb4b3a6, 'tcp://10.0.0.21:4567') connection to peer 584762e6 with addr tcp://10.0.0.23:4567 timed out, no messages seen in PT3S
Starting a new node will fail, given that the connectivity will not be established correctly. In the Percona documentation there is a notes section in which we mention that these ports must be open to have the cluster working correctly.:
- 3306 For MySQL client connections and State Snapshot Transfer that use the mysqldump method.
- 4567 For Galera Cluster replication traffic, multicast replication uses both UDP transport and TCP on this port.
- 4568 For Incremental State Transfer.
- 4444 For all other State Snapshot Transfer.
Of course, if you don’t know how to do it that could be a problem, but it is quite simple. Just use the following commands to add the needed rules:
iptables -I INPUT 2 --protocol tcp --match tcp --dport 3306 --source 10.0.0.1/24 --jump ACCEPT
iptables -I INPUT 3 --protocol tcp --match tcp --dport 4567 --source 10.0.0.1/24 --jump ACCEPT
iptables -I INPUT 4 --protocol tcp --match tcp --dport 4568 --source 10.0.0.1/24 --jump ACCEPT
iptables -I INPUT 5 --protocol tcp --match tcp --dport 4444 --source 10.0.0.1/24 --jump ACCEPT
iptables -I INPUT 6 --protocol udp --match udp --dport 4567 --source 10.0.0.1/24 --jump ACCEPT
Once you have done this check the layout again and you should have something like this:
[root@galera1h1n5 gal571]# iptables -L
Chain INPUT (policy ACCEPT)
target prot opt source destination
ACCEPT all -- anywhere anywhere state RELATED,ESTABLISHED
ACCEPT tcp -- 10.0.0.0/24 anywhere tcp dpt:mysql
ACCEPT tcp -- 10.0.0.0/24 anywhere tcp dpt:tram
ACCEPT tcp -- 10.0.0.0/24 anywhere tcp dpt:bmc-reporting
ACCEPT tcp -- 10.0.0.0/24 anywhere tcp dpt:krb524
ACCEPT udp -- 10.0.0.0/24 anywhere udp dpt:tram
ACCEPT icmp -- anywhere anywhere
ACCEPT tcp -- anywhere anywhere tcp dpt:ssh
ACCEPT tcp -- anywhere anywhere tcp dpt:mysql
REJECT all -- anywhere anywhere reject-with icmp-port-unreachable
Chain FORWARD (policy ACCEPT)
target prot opt source destination
REJECT all -- anywhere anywhere reject-with icmp-port-unreachable
Chain OUTPUT (policy ACCEPT)
target prot opt source destination
Try to start the secondary node, and — tadaaa — the node will connect, will provision itself, and finally will start correctly.
All good? Well not really, you still need to perform a final step. We need to make our server accessible also for PMM monitoring agents.
You have PMM right? If you don’t take a look here and you will want it. 
Anyhow PMM will not work correctly with the rules I have, and the result will be an empty set of graphs when accessing the server statistics. Luckily, PMM has a very easy way to help you identify the issue:
[root@galera1h1n5 gal571]# pmm-admin check-network
PMM Network Status
Server Address | 192.168.1.52
Client Address | 192.168.1.205
* System Time
NTP Server (0.pool.ntp.org) | 2018-05-24 08:05:37 -0400 EDT
PMM Server | 2018-05-24 12:05:34 +0000 GMT
PMM Client | 2018-05-24 08:05:37 -0400 EDT
PMM Server Time Drift | OK
PMM Client Time Drift | OK
PMM Client to PMM Server Time Drift | OK
* Connection: Client --> Server
-------------------- -------
SERVER SERVICE STATUS
-------------------- -------
Consul API OK
Prometheus API OK
Query Analytics API OK
Connection duration | 1.051724ms
Request duration | 311.924µs
Full round trip | 1.363648ms
* Connection: Client <-- Server
-------------- ------------ -------------------- ------- ---------- ---------
SERVICE TYPE NAME REMOTE ENDPOINT STATUS HTTPS/TLS PASSWORD
-------------- ------------ -------------------- ------- ---------- ---------
linux:metrics galera1h1n5 192.168.1.205:42000 DOWN NO NO
mysql:metrics gal571 192.168.1.205:42002 DOWN NO NO
When an endpoint is down it may indicate that the corresponding service is stopped (run 'pmm-admin list' to verify).
If it's running, check out the logs /var/log/pmm-*.log
When all endpoints are down but 'pmm-admin list' shows they are up and no errors in the logs,
check the firewall settings whether this system allows incoming connections from server to address:port in question.
Also you can check the endpoint status by the URL: http://192.168.1.52/prometheus/targets
What you want more? You have all the information to debug and build your new rules. I just need to open the ports 42000 42002 on my firewall:
iptables -I INPUT 7 --protocol tcp --match tcp --dport 42000 --source 192.168.1.1/24 --jump ACCEPT
iptables -I INPUT 8 --protocol tcp --match tcp --dport 42002 --source 192.168.1.1/24 --jump ACCEPT
Please note that we are handling the connectivity for PMM using a different range of IPs/subnet. This because it is best practice to have PXC nodes communicate to a dedicated network/subnet (physical and logical).
Run the test again:
* Connection: Client <-- Server
-------------- ------------ -------------------- ------- ---------- ---------
SERVICE TYPE NAME REMOTE ENDPOINT STATUS HTTPS/TLS PASSWORD
-------------- ------------ -------------------- ------- ---------- ---------
linux:metrics galera1h1n5 192.168.1.205:42000 OK YES YES
mysql:metrics gal571 192.168.1.205:42002 OK YES YES
Done … I just repeat this on all my nodes and I will have set my firewall to handle the PXC related security.
Now that all my settings are working well I can save my firewall’s rules:
iptables-save > /etc/sysconfig/iptables
For Ubuntu you may need some additional steps as for (https://help.ubuntu.com/community/IptablesHowTo#Using_iptables-save.2Frestore_to_test_rules)
There are some nice tools to help you even more, if you are very lazy, like UFW and the graphical one, GUFW. Developed to ease iptables firewall configuration, ufw provides a user friendly way to create an IPv4 or IPv6 host-based firewall. By default UFW is disabled in Ubuntu. Given that ultimately they use iptables, and their use is widely covered in other resources such as the official Ubuntu documentation, I won’t cover these here.
Conclusion
Please don’t make the mistake of flushing/ignoring your firewall, when to make this right is just a matter of 5 commands. It’s easy enough to be done by everyone and it’s good enough to stop the basic security attacks.
Happy MySQL (and PXC) to everyone.
The post PXC loves firewalls (and System Admins loves iptables) appeared first on Percona Database Performance Blog.
↧
Webinar Weds 6/13: Performance Analysis and Troubleshooting Methodologies for Databases

 Please join Percona’s CEO, Peter Zaitsev as he presents Performance Analysis and Troubleshooting Methodologies for Databases on Wednesday, June 13th, 2018 at 11:00 AM PDT (UTC-7) / 2:00 PM EDT (UTC-4).
Have you heard about the USE Method (Utilization – Saturation – Errors)? RED (Rate – Errors – Duration), or Golden Signals (Latency – Traffic – Errors – Saturations)?
In this presentation, we will talk briefly about these different-but-similar “focuses”. We’ll discuss how we can apply them to data infrastructure performance analysis, troubleshooting, and monitoring.
We will use MySQL as an example, but most of this talk applies to other database technologies too.
About Peter Zaitsev, CEO
Peter Zaitsev co-founded Percona and assumed the role of CEO in 2006. As one of the foremost experts on MySQL strategy and optimization, Peter leveraged both his technical vision and entrepreneurial skills to grow Percona from a two-person shop to one of the most respected open source companies in the business. With over 140 professionals in 30 plus countries, Peter’s venture now serves over 3000 customers – including the “who’s who” of internet giants, large enterprises and many exciting startups. Percona was named to the Inc. 5000 in 2013, 2014, 2015 and 2016.
Peter was an early employee at MySQL AB, eventually leading the company’s High Performance Group. A serial entrepreneur, Peter co-founded his first startup while attending Moscow State University where he majored in Computer Science. Peter is a co-author of High Performance MySQL: Optimization, Backups, and Replication, one of the most popular books on MySQL performance. Peter frequently speaks as an expert lecturer at MySQL and related conferences, and regularly posts on the Percona Database Performance Blog. He has also been tapped as a contributor to Fortune and DZone, and his recent ebook Practical MySQL Performance Optimization Volume 1 is one of percona.com’s most popular downloads. Peter lives in North Carolina with his wife and two children. In his spare time, Peter enjoys travel and spending time outdoors.
The post Webinar Weds 6/13: Performance Analysis and Troubleshooting Methodologies for Databases appeared first on Percona Database Performance Blog.
↧
MySQL 8.0: Optimizing Small Partial Update of LOB in InnoDB
In this article I will explain the partial update optimizations for smaller (LOBs) in InnoDB. Small here qualifies the size of the modification and not the size of the LOB. For some background information about the partial update feature, kindly go through our previous posts on this (here, here and here).…
↧
How to Benchmark Performance of MySQL & MariaDB using SysBench

What is SysBench? If you work with MySQL on a regular basis, then you most probably have heard of it. SysBench has been in the MySQL ecosystem for a long time. It was originally written by Peter Zaitsev, back in 2004. Its purpose was to provide a tool to run synthetic benchmarks of MySQL and the hardware it runs on. It was designed to run CPU, memory and I/O tests. It had also an option to execute OLTP workload on a MySQL database. OLTP stands for online transaction processing, typical workload for online applications like e-commerce, order entry or financial transaction systems.
In this blog post, we will focus on the SQL benchmark feature but keep in mind that hardware benchmarks can also be very useful in identifying issues on database servers. For example, I/O benchmark was intended to simulate InnoDB I/O workload while CPU tests involve simulation of highly concurrent, multi-treaded environment along with tests for mutex contentions - something which also resembles a database type of workload.
SysBench history and architecture
As mentioned, SysBench was originally created in 2004 by Peter Zaitsev. Soon after, Alexey Kopytov took over its development. It reached version 0.4.12 and the development halted. After a long break Alexey started to work on SysBench again in 2016. Soon version 0.5 has been released with OLTP benchmark rewritten to use LUA-based scripts. Then, in 2017, SysBench 1.0 was released. This was like day and night compared to the old, 0.4.12 version. First and the foremost, instead of hardcoded scripts, now we have the ability to customize benchmarks using LUA. For instance, Percona created TPCC-like benchmark which can be executed using SysBench. Let’s take a quick look at the current SysBench architecture.
SysBench is a C binary which uses LUA scripts to execute benchmarks. Those scripts have to:
- Handle input from command line parameters
- Define all of the modes which the benchmark is supposed to use (prepare, run, cleanup)
- Prepare all of the data
- Define how the benchmark will be executed (what queries will look like etc)
Scripts can utilize multiple connections to the database, they can also process results should you want to create complex benchmarks where queries depend on the result set of previous queries. With SysBench 1.0 it is possible to create latency histograms. It is also possible for the LUA scripts to catch and handle errors through error hooks. There’s support for parallelization in the LUA scripts, multiple queries can be executed in parallel, making, for example, provisioning much faster. Last but not least, multiple output formats are now supported. Before SysBench generated only human-readable output. Now it is possible to generate it as CSV or JSON, making it much easier to do post-processing and generate graphs using, for example, gnuplot or feed the data into Prometheus, Graphite or similar datastore.
Why SysBench?
The main reason why SysBench became popular is the fact that it is simple to use. Someone without prior knowledge can start to use it within minutes. It also provides, by default, benchmarks which cover most of the cases - OLTP workloads, read-only or read-write, primary key lookups and primary key updates. All which caused most of the issues for MySQL, up to MySQL 8.0. This was also a reason why SysBench was so popular in different benchmarks and comparisons published on the Internet. Those posts helped to promote this tool and made it into the go-to synthetic benchmark for MySQL.
Another good thing about SysBench is that, since version 0.5 and incorporation of LUA, anyone can prepare any kind of benchmark. We already mentioned TPCC-like benchmark but anyone can craft something which will resemble her production workload. We are not saying it is simple, it will be most likely a time-consuming process, but having this ability is beneficial if you need to prepare a custom benchmark.
Being a synthetic benchmark, SysBench is not a tool which you can use to tune configurations of your MySQL servers (unless you prepared LUA scripts with custom workload or your workload happen to be very similar to the benchmark workloads that SysBench comes with). What it is great for is to compare performance of different hardware. You can easily compare performance of, let’s say, different type of nodes offered by your cloud provider and maximum QPS (queries per second) they offer. Knowing that metric and knowing what you pay for given node, you can then calculate even more important metric - QP$ (queries per dollar). This will allow you to identify what node type to use when building a cost-efficient environment. Of course, SysBench can be used also for initial tuning and assessing feasibility of a given design. Let’s say we build a Galera cluster spanning across the globe - North America, EU, Asia. How many inserts per second can such a setup handle? What would be the commit latency? Does it even make sense to do a proof of concept or maybe network latency is high enough that even a simple workload does not work as you would expect it to.
What about stress-testing? Not everyone has moved to the cloud, there are still companies preferring to build their own infrastructure. Every new server acquired should go through a warm-up period during which you will stress it to pinpoint potential hardware defects. In this case SysBench can also help. Either by executing OLTP workload which overloads the server, or you can also use dedicated benchmarks for CPU, disk and memory.
As you can see, there are many cases in which even a simple, synthetic benchmark can be very useful. In the next paragraph we will look at what we can do with SysBench.
What SysBench can do for you?
What tests you can run?
As mentioned at the beginning, we will focus on OLTP benchmarks and just as a reminder we’ll repeat that SysBench can also be used to perform I/O, CPU and memory tests. Let’s take a look at the benchmarks that SysBench 1.0 comes with (we removed some helper LUA files and non-database LUA scripts from this list).
-rwxr-xr-x 1 root root 1.5K May 30 07:46 bulk_insert.lua
-rwxr-xr-x 1 root root 1.3K May 30 07:46 oltp_delete.lua
-rwxr-xr-x 1 root root 2.4K May 30 07:46 oltp_insert.lua
-rwxr-xr-x 1 root root 1.3K May 30 07:46 oltp_point_select.lua
-rwxr-xr-x 1 root root 1.7K May 30 07:46 oltp_read_only.lua
-rwxr-xr-x 1 root root 1.8K May 30 07:46 oltp_read_write.lua
-rwxr-xr-x 1 root root 1.1K May 30 07:46 oltp_update_index.lua
-rwxr-xr-x 1 root root 1.2K May 30 07:46 oltp_update_non_index.lua
-rwxr-xr-x 1 root root 1.5K May 30 07:46 oltp_write_only.lua
-rwxr-xr-x 1 root root 1.9K May 30 07:46 select_random_points.lua
-rwxr-xr-x 1 root root 2.1K May 30 07:46 select_random_ranges.lua
Let’s go through them one by one.
First, bulk_insert.lua. This test can be used to benchmark the ability of MySQL to perform multi-row inserts. This can be quite useful when checking, for example, performance of replication or Galera cluster. In the first case, it can help you answer a question: “how fast can I insert before replication lag will kick in?”. In the later case, it will tell you how fast data can be inserted into a Galera cluster given the current network latency.
All oltp_* scripts share a common table structure. First two of them (oltp_delete.lua and oltp_insert.lua) execute single DELETE and INSERT statements. Again, this could be a test for either replication or Galera cluster - push it to the limits and see what amount of inserting or purging it can handle. We also have other benchmarks focused on particular functionality - oltp_point_select, oltp_update_index and oltp_update_non_index. These will execute a subset of queries - primary key-based selects, index-based updates and non-index-based updates. If you want to test some of these functionalities, the tests are there. We also have more complex benchmarks which are based on OLTP workloads: oltp_read_only, oltp_read_write and oltp_write_only. You can run either a read-only workload, which will consist of different types of SELECT queries, you can run only writes (a mix of DELETE, INSERT and UPDATE) or you can run a mix of those two. Finally, using select_random_points and select_random_ranges you can run some random SELECT either using random points in IN() list or random ranges using BETWEEN.
How you can configure a benchmark?
What is also important, benchmarks are configurable - you can run different workload patterns using the same benchmark. Let’s take a look at the two most common benchmarks to execute. We’ll have a deep dive into OLTP read_only and OLTP read_write benchmarks. First of all, SysBench has some general configuration options. We will discuss here only the most important ones, you can check all of them by running:
sysbench --helpLet’s take a look at them.
--threads=N number of threads to use [1]You can define what kind of concurrency you’d like SysBench to generate. MySQL, as every software, has some scalability limitations and its performance will peak at some level of concurrency. This setting helps to simulate different concurrencies for a given workload and check if it already has passed the sweet spot.
  --events=N                      limit for total number of events [0]
  --time=N                        limit for total execution time in seconds [10]
Those two settings govern how long SysBench should keep running. It can either execute some number of queries or it can keep running for a predefined time.
--warmup-time=N execute events for this many seconds with statistics disabled before the actual benchmark run with statistics enabled [0]This is self-explanatory. SysBench generates statistical results from the tests and those results may be affected if MySQL is in a cold state. Warmup helps to identify “regular” throughput by executing benchmark for a predefined time, allowing to warm up the cache, buffer pools etc.
--rate=N average transactions rate. 0 for unlimited rate [0]By default SysBench will attempt to execute queries as fast as possible. To simulate slower traffic this option may be used. You can define here how many transactions should be executed per second.
--report-interval=N periodically report intermediate statistics with a specified interval in seconds. 0 disables intermediate reports [0]By default SysBench generates a report after it completed its run and no progress is reported while the benchmark is running. Using this option you can make SysBench more verbose while the benchmark still runs.
--rand-type=STRING random numbers distribution {uniform, gaussian, special, pareto, zipfian} to use by default [special]SysBench gives you ability to generate different types of data distribution. All of them may have their own purposes. Default option, ‘special’, defines several (it is configurable) hot-spots in the data, something which is quite common in web applications. You can also use other distributions if your data behaves in a different way. By making a different choice here you can also change the way your database is stressed. For example, uniform distribution, where all of the rows have the same likeliness of being accessed, is much more memory-intensive operation. It will use more buffer pool to store all of the data and it will be much more disk-intensive if your data set won’t fit in memory. On the other hand, special distribution with couple of hot-spots will put less stress on the disk as hot rows are more likely to be kept in the buffer pool and access to rows stored on disk is much less likely. For some of the data distribution types, SysBench gives you more tweaks. You can find this info in ‘sysbench --help’ output.
--db-ps-mode=STRING prepared statements usage mode {auto, disable} [auto]Using this setting you can decide if SysBench should use prepared statements (as long as they are available in the given datastore - for MySQL it means PS will be enabled by default) or not. This may make a difference while working with proxies like ProxySQL or MaxScale - they should treat prepared statements in a special way and all of them should be routed to one host making it impossible to test scalability of the proxy.
In addition to the general configuration options, each of the tests may have its own configuration. You can check what is possible by running:
root@vagrant:~# sysbench ./sysbench/src/lua/oltp_read_write.lua  help
sysbench 1.1.0-2e6b7d5 (using bundled LuaJIT 2.1.0-beta3)

oltp_read_only.lua options:
  --distinct_ranges=N           Number of SELECT DISTINCT queries per transaction [1]
  --sum_ranges=N                Number of SELECT SUM() queries per transaction [1]
  --skip_trx[=on|off]           Don't start explicit transactions and execute all queries in the AUTOCOMMIT mode [off]
  --secondary[=on|off]          Use a secondary index in place of the PRIMARY KEY [off]
  --create_secondary[=on|off]   Create a secondary index in addition to the PRIMARY KEY [on]
  --index_updates=N             Number of UPDATE index queries per transaction [1]
  --range_size=N                Range size for range SELECT queries [100]
  --auto_inc[=on|off]           Use AUTO_INCREMENT column as Primary Key (for MySQL), or its alternatives in other DBMS. When disabled, use client-generated IDs [on]
  --delete_inserts=N            Number of DELETE/INSERT combinations per transaction [1]
  --tables=N                    Number of tables [1]
  --mysql_storage_engine=STRING Storage engine, if MySQL is used [innodb]
  --non_index_updates=N         Number of UPDATE non-index queries per transaction [1]
  --table_size=N                Number of rows per table [10000]
  --pgsql_variant=STRING        Use this PostgreSQL variant when running with the PostgreSQL driver. The only currently supported variant is 'redshift'. When enabled, create_secondary is automatically disabled, and delete_inserts is set to 0
  --simple_ranges=N             Number of simple range SELECT queries per transaction [1]
  --order_ranges=N              Number of SELECT ORDER BY queries per transaction [1]
  --range_selects[=on|off]      Enable/disable all range SELECT queries [on]
  --point_selects=N             Number of point SELECT queries per transaction [10]
Again, we will discuss the most important options from here. First of all, you have a control of how exactly a transaction will look like. Generally speaking, it consists of different types of queries - INSERT, DELETE, different type of SELECT (point lookup, range, aggregation) and UPDATE (indexed, non-indexed). Using variables like:
  --distinct_ranges=N           Number of SELECT DISTINCT queries per transaction [1]
  --sum_ranges=N                Number of SELECT SUM() queries per transaction [1]
  --index_updates=N             Number of UPDATE index queries per transaction [1]
  --delete_inserts=N            Number of DELETE/INSERT combinations per transaction [1]
  --non_index_updates=N         Number of UPDATE non-index queries per transaction [1]
  --simple_ranges=N             Number of simple range SELECT queries per transaction [1]
  --order_ranges=N              Number of SELECT ORDER BY queries per transaction [1]
  --point_selects=N             Number of point SELECT queries per transaction [10]
  --range_selects[=on|off]      Enable/disable all range SELECT queries [on]
You can define what a transaction should look like. As you can see by looking at the default values, majority of queries are SELECTs - mainly point selects but also different types of range SELECTs (you can disable all of them by setting range_selects to off). You can tweak the workload towards more write-heavy workload by increasing the number of updates or INSERT/DELETE queries. It is also possible to tweak settings related to secondary indexes, auto increment but also data set size (number of tables and how many rows each of them should hold). This lets you customize your workload quite nicely.
--skip_trx[=on|off] Don't start explicit transactions and execute all queries in the AUTOCOMMIT mode [off]This is another setting, quite important when working with proxies. By default, SysBench will attempt to execute queries in explicit transaction. This way the dataset will stay consistent and not affected: SysBench will, for example, execute INSERT and DELETE on the same row, making sure the data set will not grow (impacting your ability to reproduce results). However, proxies will treat explicit transactions differently - all queries executed within a transaction should be executed on the same host, thus removing the ability to scale the workload. Please keep in mind that disabling transactions will result in data set diverging from the initial point. It may also trigger some issues like duplicate key errors or such. To be able to disable transactions you may also want to look into:
--mysql-ignore-errors=[LIST,...] list of errors to ignore, or "all" [1213,1020,1205]This setting allows you to specify error codes from MySQL which SysBench should ignore (and not kill the connection). For example, to ignore errors like: error 1062 (Duplicate entry '6' for key 'PRIMARY') you should pass this error code: --mysql-ignore-errors=1062
What is also important, each benchmark should present a way to provision a data set for tests, run them and then clean it up after the tests complete. This is done using ‘prepare’, ‘run’ and ‘cleanup’ commands. We will show how this is done in the next section.
Examples
In this section we’ll go through some examples of what SysBench can be used for. As mentioned earlier, we’ll focus on the two most popular benchmarks - OLTP read only and OLTP read/write. Sometimes it may make sense to use other benchmarks, but at least we’ll be able to show you how those two can be customized.
Primary Key lookups
First of all, we have to decide which benchmark we will run, read-only or read-write. Technically speaking it does not make a difference as we can remove writes from R/W benchmark. Let’s focus on the read-only one.
As a first step, we have to prepare a data set. We need to decide how big it should be. For this particular benchmark, using default settings (so, secondary indexes are created), 1 million rows will result in ~240 MB of data. Ten tables, 1000 000 rows each equals to 2.4GB:
root@vagrant:~# du -sh /var/lib/mysql/sbtest/
2.4G    /var/lib/mysql/sbtest/
root@vagrant:~# ls -alh /var/lib/mysql/sbtest/
total 2.4G
drwxr-x--- 2 mysql mysql 4.0K Jun  1 12:12 .
drwxr-xr-x 6 mysql mysql 4.0K Jun  1 12:10 ..
-rw-r----- 1 mysql mysql   65 Jun  1 12:08 db.opt
-rw-r----- 1 mysql mysql 8.5K Jun  1 12:12 sbtest10.frm
-rw-r----- 1 mysql mysql 240M Jun  1 12:12 sbtest10.ibd
-rw-r----- 1 mysql mysql 8.5K Jun  1 12:10 sbtest1.frm
-rw-r----- 1 mysql mysql 240M Jun  1 12:10 sbtest1.ibd
-rw-r----- 1 mysql mysql 8.5K Jun  1 12:10 sbtest2.frm
-rw-r----- 1 mysql mysql 240M Jun  1 12:10 sbtest2.ibd
-rw-r----- 1 mysql mysql 8.5K Jun  1 12:10 sbtest3.frm
-rw-r----- 1 mysql mysql 240M Jun  1 12:10 sbtest3.ibd
-rw-r----- 1 mysql mysql 8.5K Jun  1 12:10 sbtest4.frm
-rw-r----- 1 mysql mysql 240M Jun  1 12:10 sbtest4.ibd
-rw-r----- 1 mysql mysql 8.5K Jun  1 12:11 sbtest5.frm
-rw-r----- 1 mysql mysql 240M Jun  1 12:11 sbtest5.ibd
-rw-r----- 1 mysql mysql 8.5K Jun  1 12:11 sbtest6.frm
-rw-r----- 1 mysql mysql 240M Jun  1 12:11 sbtest6.ibd
-rw-r----- 1 mysql mysql 8.5K Jun  1 12:11 sbtest7.frm
-rw-r----- 1 mysql mysql 240M Jun  1 12:11 sbtest7.ibd
-rw-r----- 1 mysql mysql 8.5K Jun  1 12:11 sbtest8.frm
-rw-r----- 1 mysql mysql 240M Jun  1 12:11 sbtest8.ibd
-rw-r----- 1 mysql mysql 8.5K Jun  1 12:12 sbtest9.frm
-rw-r----- 1 mysql mysql 240M Jun  1 12:12 sbtest9.ibd
This should give you idea how many tables you want and how big they should be. Let’s say we want to test in-memory workload so we want to create tables which will fit into InnoDB buffer pool. On the other hand, we want also to make sure there are enough tables not to become a bottleneck (or, that the amount of tables matches what you would expect in your production setup). Let’s prepare our dataset. Please keep in mind that, by default, SysBench looks for ‘sbtest’ schema which has to exist before you prepare the data set. You may have to create it manually.
root@vagrant:~# sysbench /root/sysbench/src/lua/oltp_read_only.lua --threads=4 --mysql-host=10.0.0.126 --mysql-user=sbtest --mysql-password=pass --mysql-port=3306 --tables=10 --table-size=1000000 prepare
sysbench 1.1.0-2e6b7d5 (using bundled LuaJIT 2.1.0-beta3)

Initializing worker threads...

Creating table 'sbtest2'...
Creating table 'sbtest3'...
Creating table 'sbtest4'...
Creating table 'sbtest1'...
Inserting 1000000 records into 'sbtest2'
Inserting 1000000 records into 'sbtest4'
Inserting 1000000 records into 'sbtest3'
Inserting 1000000 records into 'sbtest1'
Creating a secondary index on 'sbtest2'...
Creating a secondary index on 'sbtest3'...
Creating a secondary index on 'sbtest1'...
Creating a secondary index on 'sbtest4'...
Creating table 'sbtest6'...
Inserting 1000000 records into 'sbtest6'
Creating table 'sbtest7'...
Inserting 1000000 records into 'sbtest7'
Creating table 'sbtest5'...
Inserting 1000000 records into 'sbtest5'
Creating table 'sbtest8'...
Inserting 1000000 records into 'sbtest8'
Creating a secondary index on 'sbtest6'...
Creating a secondary index on 'sbtest7'...
Creating a secondary index on 'sbtest5'...
Creating a secondary index on 'sbtest8'...
Creating table 'sbtest10'...
Inserting 1000000 records into 'sbtest10'
Creating table 'sbtest9'...
Inserting 1000000 records into 'sbtest9'
Creating a secondary index on 'sbtest10'...
Creating a secondary index on 'sbtest9'...
Once we have our data, let’s prepare a command to run the test. We want to test Primary Key lookups therefore we will disable all other types of SELECT. We will also disable prepared statements as we want to test regular queries. We will test low concurrency, let’s say 16 threads. Our command may look like below:
sysbench /root/sysbench/src/lua/oltp_read_only.lua --threads=16 --events=0 --time=300 --mysql-host=10.0.0.126 --mysql-user=sbtest --mysql-password=pass --mysql-port=3306 --tables=10 --table-size=1000000 --range_selects=off --db-ps-mode=disable --report-interval=1 runWhat did we do here? We set the number of threads to 16. We decided that we want our benchmark to run for 300 seconds, without a limit of executed queries. We defined connectivity to the database, number of tables and their size. We also disabled all range SELECTs, we also disabled prepared statements. Finally, we set report interval to one second. This is how a sample output may look like:
[ 297s ] thds: 16 tps: 97.21 qps: 1127.43 (r/w/o: 935.01/0.00/192.41) lat (ms,95%): 253.35 err/s: 0.00 reconn/s: 0.00
[ 298s ] thds: 16 tps: 195.32 qps: 2378.77 (r/w/o: 1985.13/0.00/393.64) lat (ms,95%): 189.93 err/s: 0.00 reconn/s: 0.00
[ 299s ] thds: 16 tps: 178.02 qps: 2115.22 (r/w/o: 1762.18/0.00/353.04) lat (ms,95%): 155.80 err/s: 0.00 reconn/s: 0.00
[ 300s ] thds: 16 tps: 217.82 qps: 2640.92 (r/w/o: 2202.27/0.00/438.65) lat (ms,95%): 125.52 err/s: 0.00 reconn/s: 0.00
Every second we see a snapshot of workload stats. This is quite useful to track and plot - final report will give you averages only. Intermediate results will make it possible to track the performance on a second by second basis. The final report may look like below:
SQL statistics:
    queries performed:
        read:                            614660
        write:                           0
        other:                           122932
        total:                           737592
    transactions:                        61466  (204.84 per sec.)
    queries:                             737592 (2458.08 per sec.)
    ignored errors:                      0      (0.00 per sec.)
    reconnects:                          0      (0.00 per sec.)

Throughput:
    events/s (eps):                      204.8403
    time elapsed:                        300.0679s
    total number of events:              61466

Latency (ms):
         min:                                   24.91
         avg:                                   78.10
         max:                                  331.91
         95th percentile:                      137.35
         sum:                              4800234.60

Threads fairness:
    events (avg/stddev):           3841.6250/20.87
    execution time (avg/stddev):   300.0147/0.02
You will find here information about executed queries and other (BEGIN/COMMIT) statements. You’ll learn how many transactions were executed, how many errors happened, what was the throughput and total elapsed time. You can also check latency metrics and the query distribution across threads.
If we were interested in latency distribution, we could also pass ‘--histogram’ argument to SysBench. This results in an additional output like below:
Latency histogram (values are in milliseconds)
       value  ------------- distribution ------------- count
      29.194 |******                                   1
      30.815 |******                                   1
      31.945 |***********                              2
      33.718 |******                                   1
      34.954 |***********                              2
      35.589 |******                                   1
      37.565 |***********************                  4
      38.247 |******                                   1
      38.942 |******                                   1
      39.650 |***********                              2
      40.370 |***********                              2
      41.104 |*****************                        3
      41.851 |*****************************            5
      42.611 |*****************                        3
      43.385 |*****************                        3
      44.173 |***********                              2
      44.976 |**************************************** 7
      45.793 |***********************                  4
      46.625 |***********                              2
      47.472 |*****************************            5
      48.335 |**************************************** 7
      49.213 |***********                              2
      50.107 |**********************************       6
      51.018 |***********************                  4
      51.945 |**************************************** 7
      52.889 |*****************                        3
      53.850 |*****************                        3
      54.828 |***********************                  4
      55.824 |***********                              2
      57.871 |***********                              2
      58.923 |***********                              2
      59.993 |******                                   1
      61.083 |******                                   1
      63.323 |***********                              2
      66.838 |******                                   1
      71.830 |******                                   1
Once we are good with our results, we can clean up the data:
sysbench /root/sysbench/src/lua/oltp_read_only.lua --threads=16 --events=0 --time=300 --mysql-host=10.0.0.126 --mysql-user=sbtest --mysql-password=pass --mysql-port=3306 --tables=10 --table-size=1000000 --range_selects=off --db-ps-mode=disable --report-interval=1 cleanupWrite-heavy traffic
Let’s imagine here that we want to execute a write-heavy (but not write-only) workload and, for example, test I/O subsystem’s performance. First of all, we have to decide how big the dataset should be. We’ll assume ~48GB of data (20 tables, 10 000 000 rows each). We need to prepare it. This time we will use the read-write benchmark.
root@vagrant:~# sysbench /root/sysbench/src/lua/oltp_read_write.lua --threads=4 --mysql-host=10.0.0.126 --mysql-user=sbtest --mysql-password=pass --mysql-port=3306 --tables=20 --table-size=10000000 prepareOnce this is done, we can tweak the defaults to force more writes into the query mix:
root@vagrant:~# sysbench /root/sysbench/src/lua/oltp_read_write.lua --threads=16 --events=0 --time=300 --mysql-host=10.0.0.126 --mysql-user=sbtest --mysql-password=pass --mysql-port=3306 --tables=20 --delete_inserts=10 --index_updates=10 --non_index_updates=10 --table-size=10000000 --db-ps-mode=disable --report-interval=1 runAs you can see from the intermediate results, transactions are now on a write-heavy side:
[ 5s ] thds: 16 tps: 16.99 qps: 946.31 (r/w/o: 231.83/680.50/33.98) lat (ms,95%): 1258.08 err/s: 0.00 reconn/s: 0.00
[ 6s ] thds: 16 tps: 17.01 qps: 955.81 (r/w/o: 223.19/698.59/34.03) lat (ms,95%): 1032.01 err/s: 0.00 reconn/s: 0.00
[ 7s ] thds: 16 tps: 12.00 qps: 698.91 (r/w/o: 191.97/482.93/24.00) lat (ms,95%): 1235.62 err/s: 0.00 reconn/s: 0.00
[ 8s ] thds: 16 tps: 14.01 qps: 683.43 (r/w/o: 195.12/460.29/28.02) lat (ms,95%): 1533.66 err/s: 0.00 reconn/s: 0.00Understanding the results
As we showed above, SysBench is a great tool which can help to pinpoint some of the performance issues of MySQL or MariaDB. It can also be used for initial tuning of your database configuration. Of course, you have to keep in mind that, to get the best out of your benchmarks, you have to understand why results look like they do. This would require insights into the MySQL internal metrics using monitoring tools, for instance, ClusterControl. This is quite important to remember - if you don’t understand why the performance was like it was, you may draw incorrect conclusions out of the benchmarks. There is always a bottleneck, and SysBench can help raise the performance issues, which you then have to identify.
↧
↧
Understanding ProxySQL
In this post, I will cover a bit of ProxySQL. ProxySQL is a proxy which implements MySQL protocol, allowing it to do things that other proxies cannot do. ProxySQL is gaining a lot of traction nowadays and it’s capable to integrate with a variety of products from MySQL ecosystems, such as replication (master – slave / master – master), Percona XtraDB Cluster and Group Replication.
One of its many functionalities (which IMHO makes it awesome) is the ability to do read/write split seamless to the application. You can start sending reads to your slave without doing a single line of code.
In this article, I will cover a few important points to understand how it works.
Instalation
The instalation is easy, you can do it by downloading the corresponding package for your OS from its official github repo https://github.com/sysown/proxysql/releases
sudo yum install https://github.com/sysown/proxysql/releases/download/v1.4.9/proxysql-1.4.9-1-centos7.x86_64.rpm
Now we just need to start the service
sudo service proxysql start
Interfaces
ProxySQL splits application interface from the admin interface. It will listen on 2 network ports. Admin will be on 6032 and application will listen on 6033 (reverse of 3306 ).
Layers
Other important part to understand how the proxy works is to understand its layers. I am gonna show you a diagram that can be found on its official documentation:
+-------------------------+
|      1. RUNTIME         |
+-------------------------+
       /|\          |
        |           |
        |           |
        |          \|/
+-------------------------+
|     2.  MEMORY          |
+-------------------------+
       /|\          |
        |           |
        |           |
        |          \|/
+-------------------------+
|     3.   DISK           |
+-------------------------+
ProxySQL will always read information from 1.Runtime layer, which is stored in memory.
Every time we connect to the admin port (6032) we are manipulating information from layer 2.Memory. As the name infers, its also stored in memory.
We then have the layer 3.Disk. As the other two layers are stored in memory, we need a layer to persist information across service/server restarts.
What is the benefic of this layout?
It allows us to manipulate different areas and apply the changes at once. We can think about how a transaction works, where we run multiple queries and commit them at once. When we alter something, we will be manipulating the Memory layer, then we will run a command LOAD MYSQL [SERVERS | USERS | QUERY RULES] TO RUNTIME to load this information to runtime and we will save the information to disk layer by issuing SAVE MYSQL [SERVERS | USERS | QUERY RULES] TO DISK.
Hostgroups
ProxySQL group servers in something named hostgroup. In a topology which we have a master and two slaves, we will create a hostgroup(HG) 1 and specify that our master is part of that HG and we will create a HG 2 and specify that both slaves belong to that HG. Hostgroup creation is done at the time we specify servers on mysql_servers table. There is not fixed enumeration, you can create your HG with any ID you want.
Later we will configure user and queries to identify if the query coming in is a read it should be answered by one of the servers from HG 2 (where we configured our slaves). If the query is not a read, then our server on HG 1 will receive it.
Authentication
ProxySQL has functionalities like firewall, in which it has the capability of blocking a query even before it reaches our backend server. To do it it’s required to have the user authentication module also present on the proxy side. So we will be required to create all users that we wish to connect via ProxySQL also create on the proxy side.
Now that you understand a bit of the basic of how ProxySQL works, you can start playing with it.
↧
Build a Health Tracking App with React, GraphQL, and User Authentication
I think you’ll like the story I’m about to tell you. I’m going to show you how to build a GraphQL API with Vesper framework, TypeORM, and MySQL. These are Node frameworks, and I’ll use TypeScript for the language. For the client, I’ll use React, reactstrap, and Apollo Client to talk to the API. Once you have this environment working, and you add secure user authentication, I believe you’ll love the experience!
Why focus on secure authentication? Well, aside from the fact that I work for Okta, I think we can all agree that pretty much every application depends upon a secure identity management system. For most developers who are building React apps, there’s a decision to be made between rolling your own authentication/authorization or plugging in a service like Okta. Before I dive into building a React app, I want to tell you a bit about Okta, and why I think it’s an excellent solution for all JavaScript developers.
What is Okta?
In short, we make identity management a lot easier, more secure, and more scalable than what you’re used to. Okta is a cloud service that allows developers to create, edit, and securely store user accounts and user account data, and connect them with one or multiple applications. Our API enables you to:
- Authenticate and authorize your users
- Store data about your users
- Perform password-based and social login
- Secure your application with multi-factor authentication
- And much more! Check out our product documentation
Are you sold? Register for a forever-free developer account, and when you’re done, come on back so we can learn more about building secure apps in React!
Why a Health Tracking App?
In late September through mid-October 2014, I'd done a 21-Day Sugar Detox during which I stopped eating sugar, started exercising regularly, and stopped drinking alcohol. I'd had high blood pressure for over ten years and was on blood-pressure medication at the time. During the first week of the detox, I ran out of blood-pressure medication. Since a new prescription required a doctor visit, I decided I'd wait until after the detox to get it. After three weeks, not only did I lose 15 pounds, but my blood pressure was at normal levels!
Before I started the detox, I came up with a 21-point system to see how healthy I was each week. Its rules were simple: you can earn up to three points per day for the following reasons:
- If you eat healthy, you get a point. Otherwise, zero.
- If you exercise, you get a point.
- If you don't drink alcohol, you get a point.
I was surprised to find I got eight points the first week I used this system. During the detox, I got 16 points the first week, 20 the second, and 21 the third. Before the detox, I thought eating healthy meant eating anything except fast food. After the detox, I realized that eating healthy for me meant eating no sugar. I'm also a big lover of craft beer, so I modified the alcohol rule to allow two healthier alcohol drinks (like a greyhound or red wine) per day.
My goal is to earn 15 points per week. I find that if I get more, I'll likely lose weight and have good blood pressure. If I get fewer than 15, I risk getting sick. I've been tracking my health like this since September 2014. I've lost weight, and my blood pressure has returned to and maintained normal levels. I haven't had good blood pressure since my early 20s, so this has been a life changer for me.
I built 21-Points Health to track my health. I figured it'd be fun to recreate a small slice of that app, just tracking daily points.
Building an API with TypeORM, GraphQL, and Vesper
TypeORM is a nifty ORM (object-relational mapper) framework that can run in most JavaScript platforms, including Node, a browser, Cordova, React Native, and Electron. It’s heavily influenced by Hibernate, Doctrine, and Entity Framework. Install TypeORM globally to begin creating your API.
npm i -g typeorm@0.2.7Create a directory to hold the React client and GraphQL API.
mkdir health-tracker
cd health-tracker
Create a new project with MySQL using the following command:
typeorm init --name graphql-api --database mysqlEdit graphql-api/ormconfig.json to customize the username, password, and database.
{
    ...
    "username": "health",
    "password": "pointstest",
    "database": "healthpoints",
    ...
}
TIP: To see the queries being executed against MySQL, change the "logging" value in this file to be "all". Many other logging options are available too.
Install MySQL
Install MySQL if you don’t already have it installed. On Ubuntu, you can use sudo apt-get install mysql-server. On macOS, you can use Homebrew and brew install mysql. For Windows, you can use the MySQL Installer.
Once you’ve got MySQL installed and configured with a root password, login and create a healthpoints database.
mysql -u root -p
create database healthpoints;
use healthpoints;
grant all privileges on *.* to 'health'@'localhost' identified by 'points';
Navigate to your graphql-api project in a terminal window, install the project’s dependencies, then start it to ensure you can connect to MySQL.
cd graphql-api
npm i
npm start
You should see the following output:
Inserting a new user into the database...
Saved a new user with id: 1
Loading users from the database...
Loaded users:  [ User { id: 1, firstName: 'Timber', lastName: 'Saw', age: 25 } ]
Here you can setup and run express/koa/any other framework.
Install Vesper to Integrate TypeORM and GraphQL
Vesper is a Node framework that integrates TypeORM and GraphQL. To install it, use good ol' npm.
npm i vesper@0.1.9Now it's time to create some GraphQL models (that define what your data looks like) and some controllers (that explain how to interact with your data).
Create graphql-api/src/schema/model/Points.graphql:
type Points {
  id: Int
  date: Date
  exercise: Int
  diet: Int
  alcohol: Int
  notes: String
  user: User
}
Create graphql-api/src/schema/model/User.graphql:
type User {
  id: String
  firstName: String
  lastName: String
  points: [Points]
}
Next, create a graphql-api/src/schema/controller/PointsController.graphql with queries and mutations:
type Query {
  points: [Points]
  pointsGet(id: Int): Points
  users: [User]
}

type Mutation {
  pointsSave(id: Int, date: Date, exercise: Int, diet: Int, alcohol: Int, notes: String): Points
  pointsDelete(id: Int): Boolean
}
Now that your data has GraphQL metadata create entities that will be managed by TypeORM. Change src/entity/User.ts to have the following code that allows points to be associated with a user.
import { Column, Entity, OneToMany, PrimaryColumn } from 'typeorm';
import { Points } from './Points';

@Entity()
export class User {

  @PrimaryColumn()
  id: string;

  @Column()
  firstName: string;

  @Column()
  lastName: string;

  @OneToMany(() => Points, points => points.user)
  points: Points[];
}
In the same src/entity directory, create a Points.ts class with the following code.
import { Entity, PrimaryGeneratedColumn, Column, ManyToOne } from 'typeorm';
import { User } from './User';

@Entity()
export class Points {

  @PrimaryGeneratedColumn()
  id: number;

  @Column({ type: 'timestamp', default: () => 'CURRENT_TIMESTAMP'})
  date: Date;

  @Column()
  exercise: number;

  @Column()
  diet: number;

  @Column()
  alcohol: number;

  @Column()
  notes: string;

  @ManyToOne(() => User, user => user.points, { cascade: ["insert"] })
  user: User|null;
}
Note the cascade: ["insert"] option on the @ManyToOne annotation above. This option will automatically insert a user if it's present on the entity. Create src/controller/PointsController.ts to handle converting the data from your GraphQL queries and mutations.
import { Controller, Mutation, Query } from 'vesper';
import { EntityManager } from 'typeorm';
import { Points } from '../entity/Points';

@Controller()
export class PointsController {

  constructor(private entityManager: EntityManager) {
  }

  // serves "points: [Points]" requests
  @Query()
  points() {
    return this.entityManager.find(Points);
  }

  // serves "pointsGet(id: Int): Points" requests
  @Query()
  pointsGet({id}) {
    return this.entityManager.findOne(Points, id);
  }

  // serves "pointsSave(id: Int, date: Date, exercise: Int, diet: Int, alcohol: Int, notes: String): Points" requests
  @Mutation()
  pointsSave(args) {
    const points = this.entityManager.create(Points, args);
    return this.entityManager.save(Points, points);
  }

  // serves "pointsDelete(id: Int): Boolean" requests
  @Mutation()
  async pointsDelete({id}) {
    await this.entityManager.remove(Points, {id: id});
    return true;
  }
}
Change src/index.ts to use Vesper's bootstrap() to configure everything.
import { bootstrap } from 'vesper';
import { PointsController } from './controller/PointsController';
import { Points } from './entity/Points';
import { User } from './entity/User';

bootstrap({
  port: 4000,
  controllers: [
    PointsController
  ],
  entities: [
    Points,
    User
  ],
  schemas: [
    __dirname + '/schema/**/*.graphql'
  ],
  cors: true
}).then(() => {
  console.log('Your app is up and running on http://localhost:4000. ' +
    'You can use playground in development mode on http://localhost:4000/playground');
}).catch(error => {
  console.error(error.stack ? error.stack : error);
});
This code tells Vesper to register controllers, entities, GraphQL schemas, to run on port 4000, and to enable CORS (cross-origin resource sharing).
Start your API using npm start and navigate to http://localhost:4000/playground. In the left pane, enter the following mutation and press the play button. You might try typing the code below so you can experience the code completion that GraphQL provides you.
mutation {
  pointsSave(exercise:1, diet:1, alcohol:1, notes:"Hello World") {
    id
    date
    exercise
    diet
    alcohol
    notes
  }
}
Your result should look similar to mine.
You can click the "SCHEMA" tab on the right to see the available queries and mutations. Pretty slick, eh?!
You can use the following points query to verify that data is in your database.
query {
  points {id date exercise diet notes}
}
Fix Dates
You might notice that the date returned from pointsSave and the points query is in a format the might be difficult for a JavaScript client to understand. You can fix that, install graphql-iso-date.
npm i graphql-iso-date@3.5.0Then, add an import in src/index.ts and configure custom resolvers for the various date types. This example only uses Date, but it's helpful to know the other options.
import { GraphQLDate, GraphQLDateTime, GraphQLTime } from 'graphql-iso-date';

bootstrap({
  ...
  // https://github.com/vesper-framework/vesper/issues/4
  customResolvers: {
    Date: GraphQLDate,
    Time: GraphQLTime,
    DateTime: GraphQLDateTime
  },
  ...
});
Now running the points query will return a more client-friendly result.
{
  "data": {
    "points": [
      {
        "id": 1,
        "date": "2018-06-04",
        "exercise": 1,
        "diet": 1,
        "notes": "Hello World"
      }
    ]
  }
}
You've written an API with GraphQL and TypeScript in about 20 minutes. How cool is that?! There's still work to do though. In the next sections, you'll create a React client for this API and add authentication with OIDC. Adding authentication will give you the ability to get the user's information and associate a user with their points.
Get Started with React
One of the quickest ways to get started with React is to use Create React App. Install the latest release using the command below.
npm i -g create-react-app@1.1.4Navigate to the directory where you created your GraphQL API and create a React client.
cd health-tracker
create-react-app react-client
Install the dependencies you'll need to talk to integrate Apollo Client with React, as well as Bootstrap and reactstrap.
npm i apollo-boost@0.1.7 react-apollo@2.1.4 graphql-tag@2.9.2 graphql@0.13.2Configure Apollo Client for Your API
Open react-client/src/App.js and import ApolloClient from apollo-boost and add the endpoint to your GraphQL API.
import ApolloClient from 'apollo-boost';

const client = new ApolloClient({
  uri: "http://localhost:4000/graphql"
});
That's it! With only three lines of code, your app is ready to start fetching data. You can prove it by importing the gql function from graphql-tag. This will parse your query string and turn it into a query document.
import gql from 'graphql-tag';

class App extends Component {

  componentDidMount() {
    client.query({
      query: gql`
        {
          points {
            id date exercise diet alcohol notes
          }
        }
      `
    })
    .then(result => console.log(result));
  }
...
}
Make sure to open your browser's developer tools so you can see the data after making this change. You could modify the console.log() to use this.setState({points: results.data.points}), but then you'd have to initialize the default state in the constructor. But there's an easier way: you can use ApolloProvider and Query components from react-apollo!
Below is a modified version of react-client/src/App.js that uses these components.
import React, { Component } from 'react';
import logo from './logo.svg';
import './App.css';
import ApolloClient from 'apollo-boost';
import gql from 'graphql-tag';
import { ApolloProvider, Query } from 'react-apollo';
const client = new ApolloClient({
  uri: "http://localhost:4000/graphql"
});

class App extends Component {

  render() {
    return (
      <ApolloProvider client={client}>
        <div className="App">
          <header className="App-header">
            <img src={logo} className="App-logo" alt="logo" />
            <h1 className="App-title">Welcome to React</h1>
          </header>
          <p className="App-intro">
            To get started, edit <code>src/App.js</code> and save to reload.
          </p>
          <Query query={gql`
            {
              points {id date exercise diet alcohol notes}
            }
          `}>
            {({loading, error, data}) => {
              if (loading) return <p>Loading...</p>;
              if (error) return <p>Error: {error}</p>;
              return data.points.map(p => {
                return <div key={p.id}>
                  <p>Date: {p.date}</p>
                  <p>Points: {p.exercise + p.diet + p.alcohol}</p>
                  <p>Notes: {p.notes}</p>
                </div>
              })
            }}
          </Query>
        </div>
      </ApolloProvider>
    );
  }
}

export default App;
You've built a GraphQL API and a React UI that talks to it - excellent work! However, there's still more to do. In the next sections, I'll show you how to add authentication to React, verify JWTs with Vesper, and add CRUD functionality to the UI. CRUD functionality already exists in the API thanks to the mutations you wrote earlier.
Add Authentication for React with OpenID Connect
You'll need to configure React to use Okta for authentication. You'll need to create an OIDC app in Okta for that.
Log in to your Okta Developer account (or sign up if you don’t have an account) and navigate to Applications > Add Application. Click Single-Page App, click Next, and give the app a name you’ll remember. Change all instances of localhost:8080 to localhost:3000 and click Done. Your settings should be similar to the screenshot below.
Okta's React SDK allows you to integrate OIDC into a React application. To install, run the following commands:
npm i @okta/okta-react@1.0.2 react-router-dom@4.2.2Okta's React SDK depends on react-router, hence the reason for installing react-router-dom. Configuring routing in client/src/App.tsx is a common practice, so replace its code with the JavaScript below that sets up authentication with Okta.
import React, { Component } from 'react';
import { BrowserRouter as Router, Route } from 'react-router-dom';
import { ImplicitCallback, SecureRoute, Security } from '@okta/okta-react';
import Home from './Home';
import Login from './Login';
import Points from './Points';

function onAuthRequired({history}) {
  history.push('/login');
}

class App extends Component {
  render() {
    return (
      <Router>
        <Security issuer='https://{yourOktaDomain}.com/oauth2/default'
                  client_id='{yourClientId}'
                  redirect_uri={window.location.origin + '/implicit/callback'}
                  onAuthRequired={onAuthRequired}>
          <Route path='/' exact={true} component={Home}/>
          <SecureRoute path='/points' component={Points}/>
          <Route path='/login' render={() => <Login baseUrl='https://{yourOktaDomain}.com'/>}/>
          <Route path='/implicit/callback' component={ImplicitCallback}/>
        </Security>
      </Router>
    );
  }
}

export default App;
Make sure to replace {yourOktaDomain} and {yourClientId} in the code above. Your Okta domain should be something like dev-12345.oktapreview. Make sure you don't end up with two .com values in the URL!
The code in App.js references two components that don't exist yet: Home, Login, and Points. Create src/Home.js with the following code. This component renders the default route, provides a Login button, and links to your points and logout after you've logged in.
import React, { Component } from 'react';
import { withAuth } from '@okta/okta-react';
import { Button, Container } from 'reactstrap';
import AppNavbar from './AppNavbar';
import { Link } from 'react-router-dom';

export default withAuth(class Home extends Component {
  constructor(props) {
    super(props);
    this.state = {authenticated: null, userinfo: null, isOpen: false};
    this.checkAuthentication = this.checkAuthentication.bind(this);
    this.checkAuthentication();
    this.login = this.login.bind(this);
    this.logout = this.logout.bind(this);
  }

  async checkAuthentication() {
    const authenticated = await this.props.auth.isAuthenticated();
    if (authenticated !== this.state.authenticated) {
      if (authenticated && !this.state.userinfo) {
        const userinfo = await this.props.auth.getUser();
        this.setState({authenticated, userinfo});
      } else {
        this.setState({authenticated});
      }
    }
  }

  async componentDidMount() {
    this.checkAuthentication();
  }

  async componentDidUpdate() {
    this.checkAuthentication();
  }

  async login() {
    this.props.auth.login('/');
  }

  async logout() {
    this.props.auth.logout('/');
    this.setState({authenticated: null, userinfo: null});
  }

  render() {
    if (this.state.authenticated === null) return null;
    const button = this.state.authenticated ?
        <div>
          <Button color="link"><Link to="/points">Manage Points</Link></Button><br/>
          <Button color="link" onClick={this.logout}>Logout</Button>
        </div>:
      <Button color="primary" onClick={this.login}>Login</Button>;

    const message = this.state.userinfo ?
      <p>Hello, {this.state.userinfo.given_name}!</p> :
      <p>Please log in to manage your points.</p>;

    return (
      <div>
        <AppNavbar/>
        <Container fluid>
          {message}
          {button}
        </Container>
      </div>
    );
  }
});
This component uses <Container/> and <Button/> from reactstrap. Install reactstrap, so everything compiles. It depends on Bootstrap, so include it too.
npm i reactstrap@6.1.0 bootstrap@4.1.1Add Bootstrap's CSS file as an import in src/index.js.
import 'bootstrap/dist/css/bootstrap.min.css';You might notice there's a <AppNavbar/> in the Home component's render() method. Create src/AppNavbar.js so you can use a common header between components.
import React, { Component } from 'react';
import { Collapse, Nav, Navbar, NavbarBrand, NavbarToggler, NavItem, NavLink } from 'reactstrap';
import { Link } from 'react-router-dom';

export default class AppNavbar extends Component {
  constructor(props) {
    super(props);
    this.state = {isOpen: false};
    this.toggle = this.toggle.bind(this);
  }

  toggle() {
    this.setState({
      isOpen: !this.state.isOpen
    });
  }

  render() {
    return <Navbar color="success" dark expand="md">
      <NavbarBrand tag={Link} to="/">Home</NavbarBrand>
      <NavbarToggler onClick={this.toggle}/>
      <Collapse isOpen={this.state.isOpen} navbar>
        <Nav className="ml-auto" navbar>
          <NavItem>
            <NavLink
              href="https://twitter.com/oktadev">@oktadev</NavLink>
          </NavItem>
          <NavItem>
            <NavLink href="https://github.com/oktadeveloper/okta-react-graphql-example/">GitHub</NavLink>
          </NavItem>
        </Nav>
      </Collapse>
    </Navbar>;
  }
}
In this example, I'm going to embed Okta's Sign-In Widget. Another option is to redirect to Okta and use a hosted login page. Install the Sign-In Widget using npm.
npm i @okta/okta-signin-widget@2.9.0Create src/Login.js and add the following code to it.
import React, { Component } from 'react';
import { Redirect } from 'react-router-dom';
import OktaSignInWidget from './OktaSignInWidget';
import { withAuth } from '@okta/okta-react';

export default withAuth(class Login extends Component {
  constructor(props) {
    super(props);
    this.onSuccess = this.onSuccess.bind(this);
    this.onError = this.onError.bind(this);
    this.state = {
      authenticated: null
    };
    this.checkAuthentication();
  }

  async checkAuthentication() {
    const authenticated = await this.props.auth.isAuthenticated();
    if (authenticated !== this.state.authenticated) {
      this.setState({authenticated});
    }
  }

  componentDidUpdate() {
    this.checkAuthentication();
  }

  onSuccess(res) {
    return this.props.auth.redirect({
      sessionToken: res.session.token
    });
  }

  onError(err) {
    console.log('error logging in', err);
  }

  render() {
    if (this.state.authenticated === null) return null;
    return this.state.authenticated ?
      <Redirect to={{pathname: '/'}}/> :
      <OktaSignInWidget
        baseUrl={this.props.baseUrl}
        onSuccess={this.onSuccess}
        onError={this.onError}/>;
  }
});
The Login component has a reference to OktaSignInWidget. Create src/OktaSignInWidget.js:
import React, {Component} from 'react';
import ReactDOM from 'react-dom';
import OktaSignIn from '@okta/okta-signin-widget';
import '@okta/okta-signin-widget/dist/css/okta-sign-in.min.css';
import '@okta/okta-signin-widget/dist/css/okta-theme.css';
import './App.css';

export default class OktaSignInWidget extends Component {
  componentDidMount() {
    const el = ReactDOM.findDOMNode(this);
    this.widget = new OktaSignIn({
      baseUrl: this.props.baseUrl
    });
    this.widget.renderEl({el}, this.props.onSuccess, this.props.onError);
  }

  componentWillUnmount() {
    this.widget.remove();
  }

  render() {
    return <div/>;
  }
};
Create src/Points.js to render the list of points from your API.
import React, { Component } from 'react';
import { ApolloClient } from 'apollo-client';
import { createHttpLink } from 'apollo-link-http';
import { setContext } from 'apollo-link-context';
import { InMemoryCache } from 'apollo-cache-inmemory';
import gql from 'graphql-tag';
import { withAuth } from '@okta/okta-react';
import AppNavbar from './AppNavbar';
import { Alert, Button, Container, Table } from 'reactstrap';
import PointsModal from './PointsModal';

export const httpLink = createHttpLink({
  uri: 'http://localhost:4000/graphql'
});

export default withAuth(class Points extends Component {
  client;

  constructor(props) {
    super(props);
    this.state = {points: [], error: null};

    this.refresh = this.refresh.bind(this);
    this.remove = this.remove.bind(this);
  }

  refresh(item) {
    let existing = this.state.points.filter(p => p.id === item.id);
    let points = [...this.state.points];
    if (existing.length === 0) {
      points.push(item);
      this.setState({points});
    } else {
      this.state.points.forEach((p, idx) => {
        if (p.id === item.id) {
          points[idx] = item;
          this.setState({points});
        }
      })
    }
  }

  remove(item, index) {
    const deletePoints = gql`mutation pointsDelete($id: Int) { pointsDelete(id: $id) }`;

    this.client.mutate({
      mutation: deletePoints,
      variables: {id: item.id}
    }).then(result => {
      if (result.data.pointsDelete) {
        let updatedPoints = [...this.state.points].filter(i => i.id !== item.id);
        this.setState({points: updatedPoints});
      }
    });
  }

  componentDidMount() {
    const authLink = setContext(async (_, {headers}) => {
      const token = await this.props.auth.getAccessToken();
      const user = await this.props.auth.getUser();

      // return the headers to the context so httpLink can read them
      return {
        headers: {
          ...headers,
          authorization: token ? `Bearer ${token}` : '',
          'x-forwarded-user': user ? JSON.stringify(user) : ''
        }
      }
    });

    this.client = new ApolloClient({
      link: authLink.concat(httpLink),
      cache: new InMemoryCache(),
      connectToDevTools: true
    });

    this.client.query({
      query: gql`
        {
          points {
              id,
              user {
                  id,
                  lastName
              }
              date,
              alcohol,
              exercise,
              diet,
              notes
          }
        }`
    }).then(result => {
      this.setState({points: result.data.points});
    }).catch(error => {
      this.setState({error: <Alert color="danger">Failure to communicate with API.</Alert>});
    });
  }

  render() {
    const {points, error} = this.state;
    const pointsList = points.map(p => {
      const total = p.exercise + p.diet + p.alcohol;
      return <tr key={p.id}>
        <td style={{whiteSpace: 'nowrap'}}><PointsModal item={p} callback={this.refresh}/></td>
        <td className={total <= 1 ? 'text-danger' : 'text-success'}>{total}</td>
        <td>{p.notes}</td>
        <td><Button size="sm" color="danger" onClick={() => this.remove(p)}>Delete</Button></td>
      </tr>
    });

    return (
      <div>
        <AppNavbar/>
        <Container fluid>
          {error}
          <h3>Your Points</h3>
          <Table>
            <thead>
            <tr>
              <th width="10%">Date</th>
              <th width="10%">Points</th>
              <th>Notes</th>
              <th width="10%">Actions</th>
            </tr>
            </thead>
            <tbody>
            {pointsList}
            </tbody>
          </Table>
          <PointsModal callback={this.refresh}/>
        </Container>
      </div>
    );
  }
})
This code starts with refresh() and remove() methods, which I'll get to in a moment. The important part happens in componentDidMount(), where the access token is added in an Authorization header, and the user's information is stuffed in an x-forwarded-user header. An ApolloClient is created with this information, a cache is added, and the connectToDevTools flag is turned on. This can be useful for debugging with Apollo Client Developer Tools.
componentDidMount() {
  const authLink = setContext(async (_, {headers}) => {
    const token = await this.props.auth.getAccessToken();

    // return the headers to the context so httpLink can read them
    return {
      headers: {
        ...headers,
        authorization: token ? `Bearer ${token}` : '',
        'x-forwarded-user': user ? JSON.stringify(user) : ''
      }
    }
  });

  this.client = new ApolloClient({
    link: authLink.concat(httpLink),
    cache: new InMemoryCache(),
    connectToDevTools: true
  });

  // this.client.query(...);
}
Authentication with Apollo Client requires a few new dependencies. Install these now.
npm apollo-link-context@1.0.8 apollo-link-http@1.5.4In the JSX of the page, there is a delete button that calls the remove() method in Points. There's also 'component. This is referenced for each item, as well as at the bottom. You'll notice both of these reference therefresh()` method, which updates the list.
<PointsModal item={p} callback={this.refresh}/>
<PointsModal callback={this.refresh}/>
This component renders a link to edit a component, or an Add button when no item is set.
Create src/PointsModal.js and add the following code to it.
import React, { Component } from 'react';
import { Button, Form, FormGroup, Input, Label, Modal, ModalBody, ModalFooter, ModalHeader } from 'reactstrap';
import { withAuth } from '@okta/okta-react';
import { httpLink } from './Points';
import { ApolloClient } from 'apollo-client';
import { setContext } from 'apollo-link-context';
import { InMemoryCache } from 'apollo-cache-inmemory';
import gql from 'graphql-tag';
import { Link } from 'react-router-dom';

export default withAuth(class PointsModal extends Component {
  client;
  emptyItem = {
    date: (new Date()).toISOString().split('T')[0],
    exercise: 1,
    diet: 1,
    alcohol: 1,
    notes: ''
  };

  constructor(props) {
    super(props);
    this.state = {
      modal: false,
      item: this.emptyItem
    };

    this.toggle = this.toggle.bind(this);
    this.handleChange = this.handleChange.bind(this);
    this.handleSubmit = this.handleSubmit.bind(this);
  }

  componentDidMount() {
    if (this.props.item) {
      this.setState({item: this.props.item})
    }

    const authLink = setContext(async (_, {headers}) => {
      const token = await this.props.auth.getAccessToken();
      const user = await this.props.auth.getUser();

      // return the headers to the context so httpLink can read them
      return {
        headers: {
          ...headers,
          authorization: token ? `Bearer ${token}` : '',
          'x-forwarded-user': JSON.stringify(user)
        }
      }
    });

    this.client = new ApolloClient({
      link: authLink.concat(httpLink),
      cache: new InMemoryCache()
    });
  }

  toggle() {
    if (this.state.modal && !this.state.item.id) {
      this.setState({item: this.emptyItem});
    }
    this.setState({modal: !this.state.modal});
  }

  render() {
    const {item} = this.state;
    const opener = item.id ? <Link onClick={this.toggle} to="#">{this.props.item.date}</Link> :
      <Button color="primary" onClick={this.toggle}>Add Points</Button>;

    return (
      <div>
        {opener}
        <Modal isOpen={this.state.modal} toggle={this.toggle}>
          <ModalHeader toggle={this.toggle}>{(item.id ? 'Edit' : 'Add')} Points</ModalHeader>
          <ModalBody>
            <Form onSubmit={this.handleSubmit}>
              <FormGroup>
                <Label for="date">Date</Label>
                <Input type="date" name="date" id="date" value={item.date}
                       onChange={this.handleChange}/>
              </FormGroup>
              <FormGroup check>
                <Label check>
                  <Input type="checkbox" name="exercise" id="exercise" checked={item.exercise}
                         onChange={this.handleChange}/>{' '}
                  Did you exercise?
                </Label>
              </FormGroup>
              <FormGroup check>
                <Label check>
                  <Input type="checkbox" name="diet" id="diet" checked={item.diet}
                         onChange={this.handleChange}/>{' '}
                  Did you eat well?
                </Label>
              </FormGroup>
              <FormGroup check>
                <Label check>
                  <Input type="checkbox" name="alcohol" id="alcohol" checked={item.alcohol}
                         onChange={this.handleChange}/>{' '}
                  Did you drink responsibly?
                </Label>
              </FormGroup>
              <FormGroup>
                <Label for="notes">Notes</Label>
                <Input type="textarea" name="notes" id="notes" value={item.notes}
                       onChange={this.handleChange}/>
              </FormGroup>
            </Form>
          </ModalBody>
          <ModalFooter>
            <Button color="primary" onClick={this.handleSubmit}>Save</Button>{' '}
            <Button color="secondary" onClick={this.toggle}>Cancel</Button>
          </ModalFooter>
        </Modal>
      </div>
    )
  };

  handleChange(event) {
    const target = event.target;
    const value = target.type === 'checkbox' ? (target.checked ? 1 : 0) : target.value;
    const name = target.name;
    let item = {...this.state.item};
    item[name] = value;
    this.setState({item});
  }

  handleSubmit(event) {
    event.preventDefault();
    const {item} = this.state;

    const updatePoints = gql`
      mutation pointsSave($id: Int, $date: Date, $exercise: Int, $diet: Int, $alcohol: Int, $notes: String) {
        pointsSave(id: $id, date: $date, exercise: $exercise, diet: $diet, alcohol: $alcohol, notes: $notes) {
          id date
        }
      }`;

    this.client.mutate({
      mutation: updatePoints,
      variables: {
        id: item.id,
        date: item.date,
        exercise: item.exercise,
        diet: item.diet,
        alcohol: item.alcohol,
        notes: item.notes
      }
    }).then(result => {
      let newItem = {...item};
      newItem.id = result.data.pointsSave.id;
      this.props.callback(newItem);
      this.toggle();
    });
  }
});
Make sure your GraphQL backend is started, then start the React frontend with npm start. The text squishes up against the top navbar, so add some padding by adding a rule in src/index.css.
.container-fluid {
  padding-top: 10px;
}
You should see the Home component and a button to log in.
Click Login and you'll be prompted to enter your Okta credentials.
And then you'll be logged in!
Click Manage Points to see the points list.
It's cool to see everything working, isn't it?! :D
Your React frontend is secured, but your API is still wide open. Let's fix that.
Get User Information from JWTs
Navigate to your graphql-api project in a terminal window and install Okta's JWT Verifier.
npm i @okta/jwt-verifier@0.0.12Create graphql-api/src/CurrentUser.ts to hold the current user's information.
export class CurrentUser {
  constructor(public id: string, public firstName: string, public lastName: string) {}
}
Import OktaJwtVerifier and CurrentUser in graphql-api/src/index.ts and configure the JWT verifier to use your OIDC app's settings.
import * as OktaJwtVerifier from '@okta/jwt-verifier';
import { CurrentUser } from './CurrentUser';

const oktaJwtVerifier = new OktaJwtVerifier({
  clientId: '{yourClientId},
  issuer: 'https://{yourOktaDomain}.com/oauth2/default'
});
In the bootstrap configuration, define setupContainer to require an authorization header and set the current user from the x-forwarded-user header.
bootstrap({
  …
  cors: true,
  setupContainer: async (container, action) => {
    const request = action.request;
    // require every request to have an authorization header
    if (!request.headers.authorization) {
      throw Error('Authorization header is required!');
    }
    let parts = request.headers.authorization.trim().split(' ');
    let accessToken = parts.pop();
    await oktaJwtVerifier.verifyAccessToken(accessToken)
      .then(async jwt => {
        const user = JSON.parse(request.headers['x-forwarded-user'].toString());
        const currentUser = new CurrentUser(jwt.claims.uid, user.given_name, user.family_name);
        container.set(CurrentUser, currentUser);
      })
      .catch(error => {
        throw Error('JWT Validation failed!');
      })
  }
  ...
});
Modify graphql-api/src/controller/PointsController.ts to inject the CurrentUser as a dependency. While you're in there, adjust the points() method to filter by user ID and modify pointsSave() to set the user when saving.
import { Controller, Mutation, Query } from 'vesper';
import { EntityManager } from 'typeorm';
import { Points } from '../entity/Points';
import { User } from '../entity/User';
import { CurrentUser } from '../CurrentUser';

@Controller()
export class PointsController {

  constructor(private entityManager: EntityManager, private currentUser: CurrentUser) {
  }

  // serves "points: [Points]" requests
  @Query()
  points() {
    return this.entityManager.getRepository(Points).createQueryBuilder("points")
      .innerJoin("points.user", "user", "user.id = :id", { id: this.currentUser.id })
      .getMany();
  }

  // serves "pointsGet(id: Int): Points" requests
  @Query()
  pointsGet({id}) {
    return this.entityManager.findOne(Points, id);
  }

  // serves "pointsSave(id: Int, date: Date, exercise: Int, diet: Int, alcohol: Int, notes: String): Points" requests
  @Mutation()
  pointsSave(args) {
    // add current user to points saved
    if (this.currentUser) {
      const user = new User();
      user.id = this.currentUser.id;
      user.firstName = this.currentUser.firstName;
      user.lastName = this.currentUser.lastName;
      args.user = user;
    }

    const points = this.entityManager.create(Points, args);
    return this.entityManager.save(Points, points);
  }

  // serves "pointsDelete(id: Int): Boolean" requests
  @Mutation()
  async pointsDelete({id}) {
    await this.entityManager.remove(Points, {id: id});
    return true;
  }
}
Restart the API, and you should be off to the races!
Source Code
You can find the source code for this article at https://github.com/oktadeveloper/okta-electron-react-example.
Learn More About React, Node, and User Authentication
This article showed you how to build a secure React app with GraphQL, TypeORM, and Node/Vesper. I hope you enjoyed the experience!
At Okta, we care about making authentication with React and Node easy to implement. We have several blog posts on the topic, and documentation too! I encourage you to check out the following links:
- Build User Registration with Node, React, and Okta
- Build a React Application with User Authentication in 15 Minutes
- Build a React Native App and Authenticate with OAuth 2.0
- Add Okta Authentication to Your React app
- Build a Basic CRUD App with Vue.js and Node
I hope you have an excellent experience building apps with React and GraphQL. If you have any questions, please hit me up on Twitter or my whole kick-ass team on @oktadev. Our DMs are wide open! :)
↧
MariaDB Audit Plugin
MariaDB DBAs are accountable for auditing database infrastructure operations to proactively troubleshoot performance and operational issues, MariaDB Audit Plugin is capable of auditing the database operations of both MariaDB and MySQL. MariaDB Audit Plugin is provided as a dynamic library: server_audit.so (server_audit.dll for Windows). The plugin must be located in the plugin directory, the directory containing all plugin libraries for MariaDB.
MariaDB [(none)]> select @@plugin_dir;
+--------------------------+
| @@plugin_dir             |
+--------------------------+
| /usr/lib64/mysql/plugin/ |
+--------------------------+
1 row in set (0.000 sec)
There are two ways you can install MariaDB Audit Plugin:
INSTALL SONAME statement while logged into MariaDB, You need to use administrative account which has INSERT privilege for the mysql.plugin table.
MariaDB [(none)]> INSTALL SONAME 'server_audit';
Query OK, 0 rows affected (0.012 sec)

MariaDB [(none)]>
Load Plugin at Start-Up
The plugin can be loaded by setting -plugin_load system variable in my.cnf (my.ini in windows)
[mysqld]
#
# include all files from the config directory
#
!includedir /etc/my.cnf.d

plugin_load=server_audit=server_audit.so
System variables to configure MariaDB Audit Plugin
MariaDB Audit Plugin is highly configurable, Please fine below the system variables available for MariaDB Audit Plugin:
MariaDB [(none)]> SHOW GLOBAL VARIABLES LIKE '%server_audit%';
+-------------------------------+-----------------------+
| Variable_name                 | Value                 |
+-------------------------------+-----------------------+
| server_audit_events           |                       |
| server_audit_excl_users       |                       |
| server_audit_file_path        | server_audit.log      |
| server_audit_file_rotate_now  | OFF                   |
| server_audit_file_rotate_size | 1000000               |
| server_audit_file_rotations   | 9                     |
| server_audit_incl_users       |                       |
| server_audit_logging          | OFF                   |
| server_audit_mode             | 0                     |
| server_audit_output_type      | file                  |
| server_audit_query_log_limit  | 1024                  |
| server_audit_syslog_facility  | LOG_USER              |
| server_audit_syslog_ident     | mysql-server_auditing |
| server_audit_syslog_info      |                       |
| server_audit_syslog_priority  | LOG_INFO              |
+-------------------------------+-----------------------+
15 rows in set (0.001 sec)
configure system variable server_audit_events for auditing MariaDB transaction events:
MariaDB [(none)]> SET GLOBAL server_audit_events = 'CONNECT,QUERY,TABLE';
Query OK, 0 rows affected (0.008 sec)
Enable MariaDB Audit Plugin
MariaDB [(none)]> set global server_audit_logging=on;
Query OK, 0 rows affected (0.007 sec)
MariaDB Audit Plugin creates audit log file “server_audit.log” on path /var/lib/mysql/
Testing MariaDB Audit Plugin
MariaDB [employees]> update employees
    -> set last_name='Gupta'
    -> where emp_no= 499999;
Query OK, 1 row affected (0.010 sec)
Rows matched: 1  Changed: 1  Warnings: 0
[root@localhost mysql]# tail -f  server_audit.log
20180612 20:32:07,localhost.localdomain,root,localhost,16,433,QUERY,,'SHOW GLOBAL VARIABLES LIKE \'%server_audit%\'',0
20180612 20:32:26,localhost.localdomain,root,localhost,16,434,QUERY,,'update employees set last_name=\'Gupta\' where emp_no= 499999',1046
20180612 20:32:37,localhost.localdomain,root,localhost,16,435,QUERY,,'SELECT DATABASE()',0
20180612 20:32:37,localhost.localdomain,root,localhost,16,437,QUERY,employees,'show databases',0
20180612 20:32:37,localhost.localdomain,root,localhost,16,438,QUERY,employees,'show tables',0
20180612 20:32:41,localhost.localdomain,root,localhost,16,447,WRITE,employees,employees,
20180612 20:32:41,localhost.localdomain,root,localhost,16,447,READ,employees,dept_emp,
20180612 20:32:41,localhost.localdomain,root,localhost,16,447,READ,employees,dept_manager,
20180612 20:32:41,localhost.localdomain,root,localhost,16,447,QUERY,employees,'update employees set last_name=\'Gupta\' where emp_no= 499999',0
How can we block UNINSTALL PLUGIN ?
The INSTALL PLUGIN statement can be used to uninstall a plugin but you can disable this by adding following line in my.cnf after plugin is loaded once:
[mysqld]
#
# include all files from the config directory
#
!includedir /etc/my.cnf.d

plugin_load=server_audit=server_audit.so
server_audit=FORCE_PLUS_PERMANENT
The post MariaDB Audit Plugin appeared first on MySQL Consulting, Support and Remote DBA Services By MinervaDB.
↧