TEXT and BLOB are special types in MySQL/MariaDB. This article helps to understand them and use them properly.
The post TEXT and BLOB good practices appeared first on Federico Razzoli.
TEXT and BLOB are special types in MySQL/MariaDB. This article helps to understand them and use them properly.
The post TEXT and BLOB good practices appeared first on Federico Razzoli.
Readers of my blog know that I like how MySQL Shell allows you to customize it and use it’s Python and JavaScript support to create custom libraries with tools that help with your daily tasks and even creating auto-refreshing reports. Lefred has even taken this a step further and started to port Innotop to MySQL Shell.
One disadvantage of my example of auto-refreshing reports and the Innotop port is they both rely on the curses Python module to refresh the screen. While avoiding to reinvent the wheel is usually a good thing, and the curses library is both powerful and easy to use, it is not well supported on Microsoft Windows. The good news is that in MySQL 8.0.16 and later, you can also get auto-refreshing reports with a new built-in reporting framework in MySQL Shell. This blog shows how this framework works.
The great thing with the built-in framework is that you can start using it even without coding as it comes with a pre-configured report. The framework consists of three parts:
\show: This is the most basic command which runs a report once and displays the result.\watch: This is similar to the watch command on Linux, where a command (report in this case) is repeatedly executed with the screen refreshed to show the new result.shell.registerReport(): This method can be used to register custom reports. The details of custom reports will be saved for a later blog.The \show command is a good place to start.
You can get more information about how the \show command works and reports in general using the built-in help system:
mysql-js> \h \show
NAME
      \show - Executes the given report with provided options and arguments.

SYNTAX
      \show <report_name> [options] [arguments]

DESCRIPTION
      The report name accepted by the \show command is case-insensitive, '-'
      and '_' characters can be used interchangeably.

      Common options:

      - --help - Display help of the given report.
      - --vertical, -E - For 'list' type reports, display records vertically.

      The output format of \show command depends on the type of report:

      - 'list' - displays records in tabular form (or vertically, if --vertical
        is used),
      - 'report' - displays a YAML text report,
      - 'print' - does not display anything, report is responsible for text
        output.

      If executed without the report name, lists available reports.

      Note: user-defined reports can be registered with shell.registerReport()
      method.

EXAMPLES
      \show
            Lists available reports, both built-in and user-defined.

      \show query show session status like 'Uptime%'
            Executes 'query' report with the provided SQL statement.

      \show query --vertical show session status like 'Uptime%'
            As above, but results are displayed in vertical form.

      \show query --help
            Displays help for the 'query' report.

SEE ALSO

Additional entries were found matching \show

The following topics were found at the SQL Syntax category:

- SHOW

For help on a specific topic use: \? <topic>

e.g.: \? SHOW
This already gives a lot of information, not only about the \show command, but also about reports. Reports can be in one of three formats (more on that in a later blog), if they are using the list format (which the query report discussed below uses), you can get the output in tabular format (the default) or vertical using the --vertical or -e option. And finally, you can get more information about known reports by running the report with the --help option, and you can get a list of known reports running \show without arguments:
mysql-js> \show
Available reports: query.
Let’s take a closer look at the query report.
The query report is a very simple report that take a query and runs it. You can get the help text for it by executing \show query --help:
mysql-js> \show query --help
query - Executes the SQL statement given as arguments.

Usage:
       \show query [OPTIONS] [ARGUMENTS]
       \watch query [OPTIONS] [ARGUMENTS]

Options:
  --help                        Display this help and exit.
  --vertical, -E                Display records vertically.

Arguments:
  This report accepts 1-* arguments.
So, to run it, you simply provide the query as an argument – you can do this either just providing the query as is or as a quoted string. Let’s say you want to use the following query for the report:
SELECT conn_id,
       sys.format_statement(current_statement) AS statement,
       format_pico_time(statement_latency) AS latency
  FROM sys.x$session
 ORDER BY statement_latency DESC
 LIMIT 10
This will show the longest running queries limited to 10 queries. Note that is uses the new format_pico_time() function that replaces the sys.format_time() function in MySQL 8.0.16. Newlines are not allowed in the query when generating the report, so the command becomes:
mysql-js> \show query SELECT conn_id, sys.format_statement(current_statement) AS statement, format_pico_time(statement_latency) AS latency FROM sys.x$session ORDER BY statement_latency DESC LIMIT 10
+---------+-------------------------------------------------------------------+----------+
| conn_id | statement                                                         | latency  |
+---------+-------------------------------------------------------------------+----------+
| 8       | SELECT conn_id, sys.format_sta ... tatement_latency DESC LIMIT 10 | 33.34 ms |
| 4       | NULL                                                              |   0 ps   |
+---------+-------------------------------------------------------------------+----------+
Granted, this is not particular useful – you could just have executed the query on its own. However, if you consider the \watch command instead, it become more useful.
The \watch the command supports two additional arguments on its own:
--interval=float, -i float: The amount of time in seconds to wait between displaying the result of the report until the report is run again. Valid values are 0.1 second to 86400 seconds (one day).--nocls: Do not clear the screen between iterations of the report. This will make the subsequent output be displayed below the previous output. This can for example be useful for reports returning a single line of output and you that way have the history of the report up the screen.Report may also add options of their own. The query report for example accepts one argument, which is the query to execute. Other reports may accept other arguments.
Otherwise, you start the report the same way as when using \show. For example, to run the query every five seconds:
mysql-js> \watch query --interval=5 SELECT conn_id, sys.format_statement(current_statement) AS statement, format_pico_time(statement_latency) AS latency FROM sys.x$session ORDER BY statement_latency DESC LIMIT 10
That’s it. If you want to stop the report again, use CTRL+c and the report will stop after the next refresh.
The report framework in MySQL Shell 8.0.16 gives a nice starting point for generating reports. The built-in query function may not be the most fancy you can think of, but it is very easy way to quickly make a query run repeatedly at set intervals. However, the real power of the report framework is that you now have a framework to create cross-platform custom reports. That will be the topic of a later blog.
The MySQL Development Team is very happy to announce a new 8.0 GA Maintenance Release of InnoDB Cluster – 8.0.16!
In addition to important bug fixes, 8.0.16 brings very useful new features!
This blog post will cover MySQL Shell and the AdminAPI, for detailed information of what’s new in MySQL Router stay tuned for an upcoming blog post!…
Previously, after installation of a new version of MySQL, the MySQL server automatically upgrades the data dictionary tables at the next startup, after which the DBA is expected to invoke mysql_upgrade manually to upgrade the system tables in the mysql schema, as well as objects in other schemas such as the sys schema and user schemas.
Previously, if the grant tables were corrupted, the MySQL server wrote a message to the error log but continued as if the --skip-grant-tables option had been specified. This resulted in the server operating in an unexpected state unless --skip-grant-tables had in fact been specified. Now, the server stops after writing a message to the error log unless started with --skip-grant-tables.
In my blog yesterday, I wrote about the new reporting framework in MySQL Shell. It is part of the 8.0.16 release. I also noted that it includes the possibility to create your own custom reports and use those with the \show and \watch commands. This blog will explore how you can create a report and register it, so it automatically is available when you start MySQL Shell.
You can write the code that generates the report in either JavaScript or Python. The reports can be used from either language mode – even SQL – irrespective of which language you choose, so go with what you are most comfortable with.
Once you have written your code, you save it in the init.d folder (does not exist by default) inside the user configuration folder. By default this is at the following location depending on whether you are on Microsoft Windows or Linux:
%AppData%MySQL\mysqlsh
~/.mysqlsh
You can overwrite this path with the MYSQLSH_USER_CONFIG_HOME environment variable.
You are free to choose any file name, but a good rule is to name the file the same as the report. However, it is required that you use .py as the file name extension if you wrote the report in Python and .js if you used JavaScript.
At that point, you need to register the report, so you can use it through the reporting framework. You do that using the shell.registerReport() method from inside the same file that has the report code. It takes four arguments: the name of the report, the report type, the function generating the report (as a function object), and optional a dictionary with the description. I will not go into the details of these argument here beyond providing an example of using it. The manual has a quite detailed section on registering your report including what the arguments are.
One thing that is worth discussing a bit as it influences how the report content should be formatted is the report type. This can have one of three values:
\show and \watch commands can then show the data either using the familiar tabular format or in vertical. The decision of which display format to use can be made when running the report.The report and print types are the more flexible, but the list type works well with query results.
This can all feel very abstract. The best way to actually understand how it works is to write an example report to go through the steps.
The custom report, I will create is based on the one in the reference manual, but modified to allow you to choose what to sort by. The example should help make it clearer how to create your own reports.
The example is quite simple and could be generated using the built-in query report, but it serves as a good starting point to understand the mechanics of custom reports, and even simple reports like this provides a way to have your report logic saved in one place and easily accessible from within MySQL Shell. The example is written in Python, but a report generating the same result written in JavaScript would look similar (although not identical).
The first thing is to define the report itself. This report is called sessions, so the function with the code is also called sessions. This is not required, but it is best practice:
sort_allowed = {
    'thread': 'thd_id',
    'connection': 'conn_id',
    'user': 'user',
    'db': 'db',
    'latency': 'statement_latency',
    'memory': 'current_memory',
}

def sessions(session, args, options):
First a dictionary is defined with the keys specifying the allowed values for the --sort option and the values as what will actually be used for the ordering. Then there is the definition of the reporting function itself. The function takes three arguments:
session: A MySQL Shell session object. This gives you access to all of the session properties and methods when you create the report.args: A list of any additional arguments passed to the the report. This is what the query report uses to get the query that will be executed. This report does not use any such arguments, so anything passed this way will be ignored.options: This is a dictionary with named options. This report will support two such named options:--limit or -l which sets the maximum number of rows to retrieve. The option will use the limit key in the dictionary. The default is not to impose any limit.--sort or -s which chooses what to sort by. The option will use the sort key in the dictionary. The report will support ordering by thread, connection, user, db, latency, and memory. The default is to sort by latency.You can choose different names for the arguments if you prefer.
The next thing is to define the query that will retrieve the result that will be used in the report. You can do this in several ways. If you want to execute an SQL query, you can use session.sql() (where session is the name of the session object in your argument list). However, it is simpler to code the query using the X DevAPI as that makes it trivial to customize the query, for example with the limit option and what to order by.
    sys = session.get_schema('sys')
    session_view = sys.get_table('x$session')
    query = session_view.select(
        'thd_id', 'conn_id', 'user', 'db',
        'sys.format_statement(current_statement) AS statement',
        'sys.format_time(statement_latency) AS latency',
        'format_bytes(current_memory) AS memory')
The statement will query the sys.x$session view. This is the non-formatted version of sys.session. The reason for using this is to allow custom sorting of the result set according to the --sort option. The view is obtained using the session.get_schema() method first to get a schema object for the sys schema, then the get_table() method of the schema object.
The query can then be defined from the table (view in this case) object by using the select() method. The arguments are the columns that should be included in the result. As you can see, it if possible to manipulate the columns and rename them.
The X DevAPI makes it trivial to modify the query with the options the report are invoked with. First handle the --sort option:
    # Set what to sort the rows by (--sort)
    try:
        order_by = options['sort']
    except SystemError:
        order_by = 'latency'

    if order_by not in sort_allowed:
        raise ValueError(
            'Unknown sort value: "{0}". Supported values: {1}'
            .format(order_by, sort_allowed.keys()))

    if order_by in ('latency', 'memory'):
        direction = 'DESC'
    else:
        direction = 'ASC'
    query.order_by('{0} {1}'.format(
        sort_allowed[order_by], direction))

    # If ordering by latency, ignore those statements with a NULL latency
    # (they are not active)
    if order_by == 'latency':
        query.where('statement_latency IS NOT NULL')
If the --sort option is not provided, then a SystemError exception is raised. The first part of the snippet handles this, and ensures that the report default to ordering by the latency. Then, it is checked if the provided value is one of the supported values.
The next step is to decide whether to sort in descending or ascending order. You can of course add another option for this, but here the logic is contained within the report choosing descending when sorting by latency or memory usage; otherwise ascending.
The final step is to tell MySQL what to order by which is done in lines 34-35 by invoking the order_by() method. This is where the programmatic approach of the X DevAPI makes it easier to gradually put the query together compared to working directly with the SQL statement.
This report adds a little extra logic to the query. If the result is ordered by latency, only queries that are currently executing (the latency IS NOT NULL are included). This is one of the advantages of creating a custom report rather than writing the query ad-hoc as you can include logic like that.
The --limit option is handled in a similar way:
    # Set the maximum number of rows to retrieve is --limit is set.
    try:
        limit = options['limit']
    except SystemError:
        limit = 0
    if limit > 0:
        query.limit(limit)
There is not much to note about this code snippet. In line 48 the limit is applied (if the value is greater than 0) by invoking the limit() method. Finally, the query can be executed and the report generated:
    result = query.execute()
    report = [result.get_column_names()]
    for row in result.fetch_all():
        report.append(list(row))

    return {'report': report}
The execute() method is used to tell MySQL that the query can be executed. This returns a result object. The get_column_names() method of the result object can be used to get the column names. Then, the rows are added by iterating over them. As you can see, there is only one report list: the first element is a list with the column headers, the remaining are the row values.
Finally, the result is returned as a dictionary. That is it for generating the report, but it should also be registered.
The registration of the report is done in the same file as where the report function was defined. You perform the registration by calling the shell.register_report() method:
shell.register_report(
    'sessions',
    'list',
    sessions,
    {
        'brief': 'Shows which sessions exist.',
        'details': ['You need the SELECT privilege on sys.session view and the '
                    + 'underlying tables and functions used by it.'],
        'options': [
            {
                'name': 'limit',
                'brief': 'The maximum number of rows to return.',
                'shortcut': 'l',
                'type': 'integer'
            },
            {
                'name': 'sort',
                'brief': 'The field to sort by. Allowed values are: {0}'.format(
                    sort_allowed.keys()),
                'shortcut': 's',
                'type': 'string'
            }
        ],
        'argc': '0'
    }
)
The first argument is the name of the report, ‘sessions’, then the report type. The third argument is the function itself. Then comes a dictionary describing the report.
There are two parts to the dictionary: the two first arguments with a description of the report – first a short (brief) description, then more details. Then a list of the options that the report supports. The final argument is the number of additional arguments.
Now, you are ready to test the report.
First the report must be installed. If you do not already have the init.d directory, create it under %AppData%MySQL\mysqlsh if you are on Microsoft Windows or under ~/.mysqlsh if you are on Linux. Then copy sessions.py into the directory.
Now, start MySQL Shell and the report is ready to be used:
mysql-js> \show
Available reports: query, sessions.

mysql-js> \show sessions --help
sessions - Shows which sessions exist.

You need the SELECT privilege on sys.session view and the underlying tables and
functions used by it.

Usage:
       \show sessions [OPTIONS]
       \watch sessions [OPTIONS]

Options:
  --help                        Display this help and exit.
  --vertical, -E                Display records vertically.
  --limit=integer, -l           The maximum number of rows to return.
  --sort=string, -s             The field to sort by. Allowed values are:
                                ['latency', 'thread', 'db', 'connection',
                                'user', 'memory']

mysql-js> \show sessions
+--------+---------+---------------+------+-------------------------------------------------------------------+----------+------------+
| thd_id | conn_id | user          | db   | statement                                                         | latency  | memory     |
+--------+---------+---------------+------+-------------------------------------------------------------------+----------+------------+
| 65     | 28      | mysqlx/worker | NULL | SELECT `thd_id`,`conn_id`,`use ... ER BY `statement_latency` DESC | 38.09 ms | 965.58 KiB |
+--------+---------+---------------+------+-------------------------------------------------------------------+----------+------------+

mysql-js> \show sessions -E
*************************** 1. row ***************************
   thd_id: 65
  conn_id: 28
     user: mysqlx/worker
       db: NULL
statement: SELECT `thd_id`,`conn_id`,`use ... ER BY `statement_latency` DESC
  latency: 35.49 ms
   memory: 968.88 KiB
Notice how the help text has been generated from the information that was provided when the report was registered, and how the -E option can be used to turn the tabular output format into the vertical format. Note also that the report is invoked from JavaScript mode and still works even though the report is written in Python – MySQL Shell will automatically handle that for you and ensure the report is executed using the correct interpreter.
It is left as an exercise for the reader to add the --sort and --limit options and to use the report with the \watch command.
One related feature that is worth covering before finishing is the shell.reports object.
This far the \show and \watch commands have been used to invoke the reports, but there is a lower level way to do it – using the shell.reports object. It is also a very useful way to explore which reports are available.
Let’s start with the latter – exploring reports – as that also shows you how the shell.reports object work. As usual in MySQL Shell, it has built-in help:
mysql-py> shell.reports.help()
NAME
      reports - Gives access to built-in and user-defined reports.

SYNTAX
      shell.reports

DESCRIPTION
      The 'reports' object provides access to built-in reports.

      All user-defined reports registered using the shell.register_report()
      method are also available here.

      The reports are provided as methods of this object, with names
      corresponding to the names of the available reports.

      All methods have the same signature: Dict report(Session session, List
      argv, Dict options), where:

      - session - Session object used by the report to obtain the data.
      - argv (optional) - Array of strings representing additional arguments.
      - options (optional) - Dictionary with values for various report-specific
        options.

      Each report returns a dictionary with the following keys:

      - report (required) - List of JSON objects containing the report. The
        number and types of items in this list depend on type of the report.

      For more information on a report use: shell.reports.help('report_name').

FUNCTIONS
      help([member])
            Provides help about this object and it's members

      query(session, argv)
            Executes the SQL statement given as arguments.

      sessions(session[, argv][, options])
            Shows which sessions exist.
This includes a list of the functions available – and notice that the two reports that exist, query and sessions, are among the functions. You can also use the help() function with the report name as a string argument to get the report specific help.
If you invoke one of the report functions, you execute the report. This is much similar to invoking the report using the \show command, but it will be the raw report result that is returned. Let’s try it both for the query and sessions reports:
mysql-py> shell.reports.query(shell.get_session(), ["SELECT NOW()"])
{
    "report": [
        [
            "NOW()"
        ],
        [
            "2019-04-27 15:53:21"
        ]
    ]
}

mysql-py> shell.reports.sessions(shell.get_session(), [], {'limit': 10, 'sort': 'latency'})
{
    "report": [
        [
            "thd_id",
            "conn_id",
            "user",
            "db",
            "statement",
            "latency",
            "memory"
        ],
        [
            66,
            29,
            "mysqlx/worker",
            null,
            "SELECT `thd_id`,`conn_id`,`use ... ment_latency` DESC LIMIT 0, 10",
            "39.76 ms",
            "886.99 KiB"
        ]
    ]
}
It is not often this is needed, but in case you want to manually manipulate the output, it can be useful.
That is all. Now over to you to create your own reports.
The MySQL Development team is proud to announce a new version of the MySQL Shell which includes the following features:
c:\Program Files\MariaDB 10.3\bin>mysql -uroot -proot -P3316 test
Welcome to the MariaDB monitor. Commands end with ; or \g.
Your MariaDB connection id is 9
Server version: 10.3.7-MariaDB-log mariadb.org binary distribution
Copyright (c) 2000, 2018, Oracle, MariaDB Corporation Ab and others.
Type 'help;' or '\h' for help. Type '\c' to clear the current input statement.
MariaDB [test]> create table t_from(id int primary key, `from` int, c1 int);
Query OK, 0 rows affected (0.582 sec)
MariaDB [test]> create user 'user01'@'%' identified by 'user01';
Query OK, 0 rows affected (0.003 sec)
MariaDB [test]> grant select (`id`,`from`) on `test`.`t_from` to 'user01'@'%';
Query OK, 0 rows affected (0.054 sec)
MariaDB [test]> show master status;
+------------------+----------+--------------+------------------+
| File | Position | Binlog_Do_DB | Binlog_Ignore_DB |
+------------------+----------+--------------+------------------+
| pc-PC-bin.000007 | 852 | | |
+------------------+----------+--------------+------------------+
1 row in set (0.030 sec)
MariaDB [test]> show binlog events in 'pc-PC-bin.000007';
+------------------+-----+-------------------+-----------+-------------+--------
-------------------------------------------------------------------+
| Log_name | Pos | Event_type | Server_id | End_log_pos | Info
|
+------------------+-----+-------------------+-----------+-------------+--------
-------------------------------------------------------------------+
| pc-PC-bin.000007 | 4 | Format_desc | 1 | 256 | Server
ver: 10.3.7-MariaDB-log, Binlog ver: 4 |
| pc-PC-bin.000007 | 256 | Gtid_list | 1 | 299 | [0-1-42
] |
| pc-PC-bin.000007 | 299 | Binlog_checkpoint | 1 | 342 | pc-PC-b
in.000007 |
...
| pc-PC-bin.000007 | 708 | Query | 1 | 852 | use `te
st`; grant select (`id`,`from`) on `test`.`t_from` to 'user01'@'%' |
+------------------+-----+-------------------+-----------+-------------+--------
-------------------------------------------------------------------+
9 rows in set (0.123 sec)
 |
| The future looks bright for MySQL 5.7 |
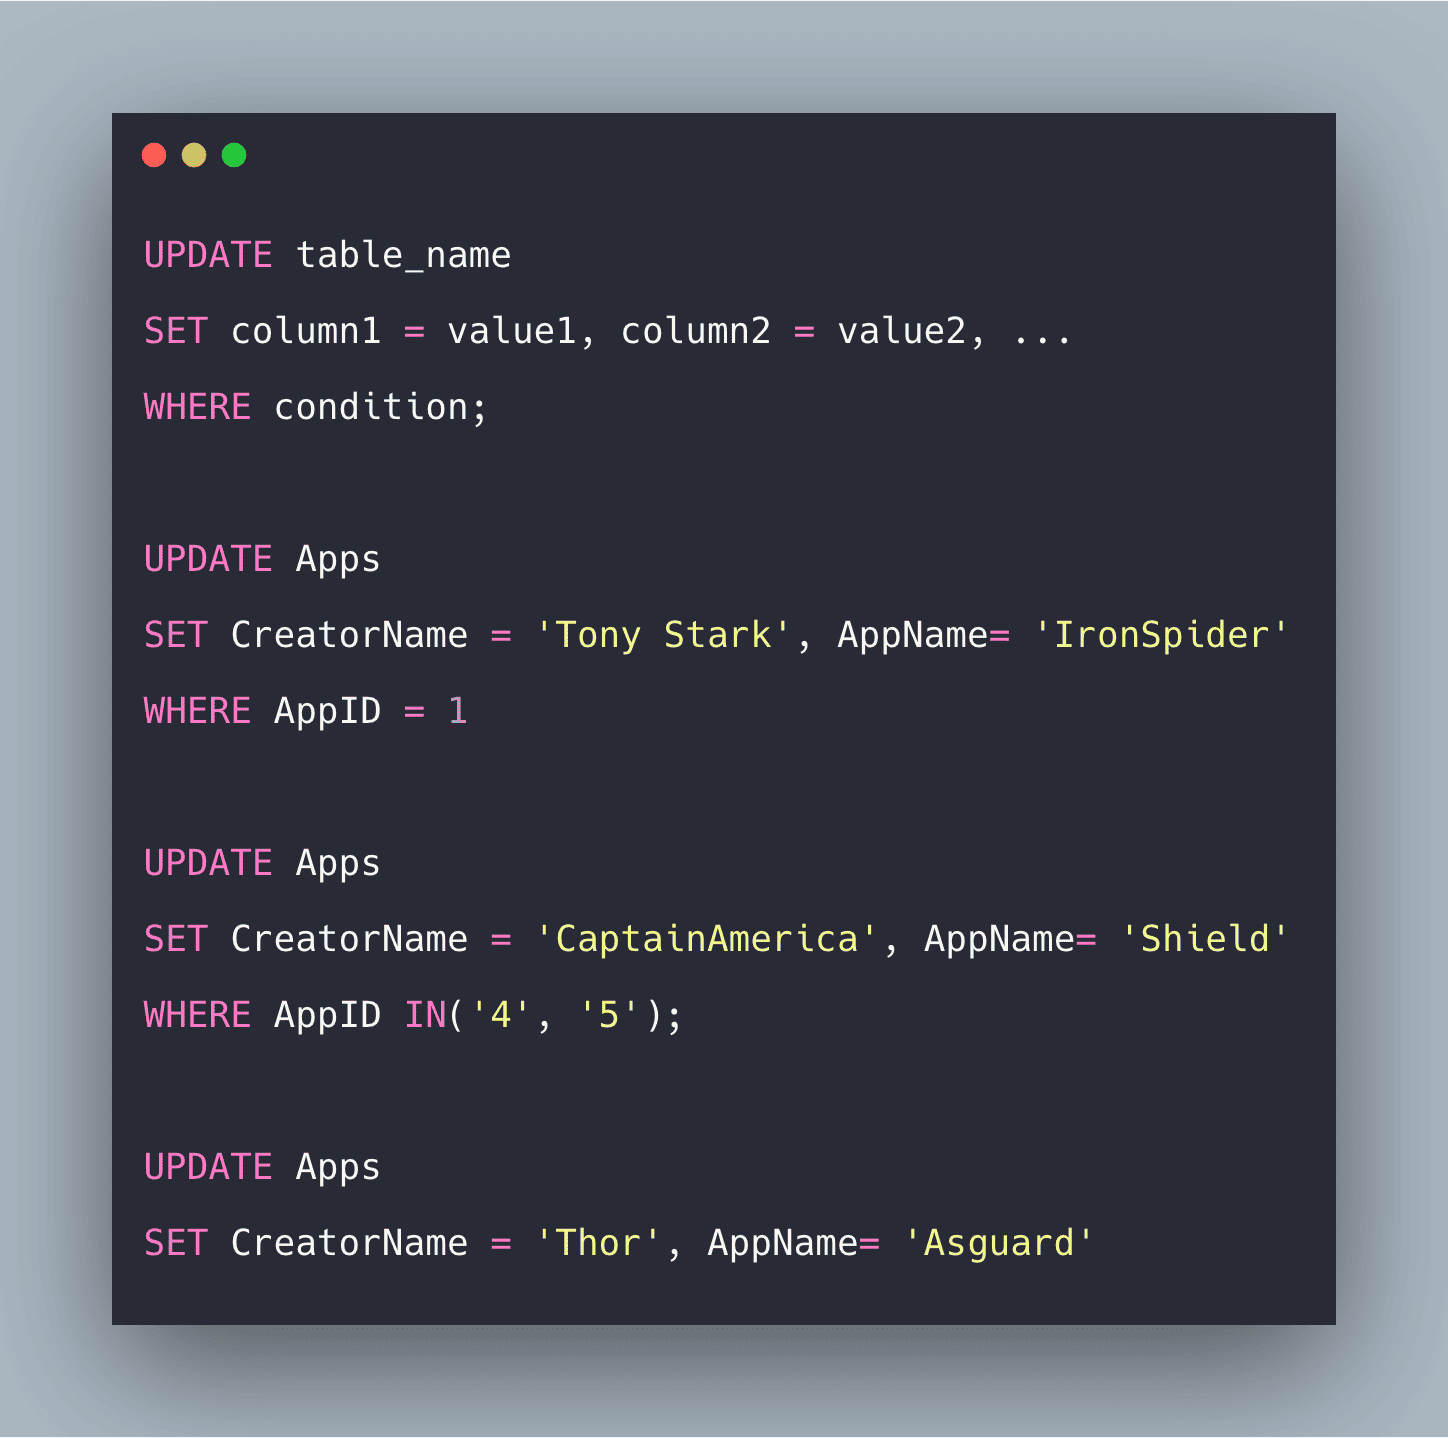
SQL Update Query Example | SQL Update Statement Tutorial is today’s topic. The SQL UPDATE statement is used to modify the existing records in a table. You need to be very careful when updating records in a table. SQL WHERE clause in the UPDATE statement specifies which record(s) that should be updated. If you omit the WHERE clause completely, then all records in the table will be updated!
You need to specify which record needs to be updated via WHERE clause, otherwise all the rows would be affected. We can update the single column as well as multiple columns using the UPDATE statement as per our requirement.
The syntax is following.
UPDATE table_name
SET column1 = value1, column2 = value2, ...
WHERE condition;
In the above query, the SET statement is used to set the new values to a particular column and the WHERE clause condition is used to select the rows for which the columns needed to be updated.
See the following example.
I have the following table called Apps.
select * from Apps
The output is following.

So, we have a table with six rows. Now, we will write an update query to modify one or multiple rows.
If you do not know how to create a table, then check out SQL Create Table and SQL Insert Query tutorials.
Now, let’s write an update query that can affect only one row.
UPDATE Apps
SET CreatorName = 'Tony Stark', AppName= 'IronSpider'
WHERE AppID = 1
Here, we are updating the row whose AppID = 1. We are updating the CreatorName and AppName.
It will not return anything. So, if we need to check the output, write the following query.
select * from Apps
See the below output.

See, we have updated the row whose AppID = 1.
Let’s write a query where we update multiple rows.
UPDATE Apps
SET CreatorName = 'CaptainAmerica', AppName= 'Shield'
WHERE AppID IN('4', '5');
The above query will update the rows whose AppIDs are 4 and 5.
Now, check the output using the below query.

You can see that AppID 4 and 5 have updated values.
We can write an SQL Update query in which we update all the rows if we do not specify the WHERE condition. See the below query.
UPDATE Apps
SET CreatorName = 'Thor', AppName= 'Asguard'
It will update the CreatorName and AppName for all the six rows. Verify the output by the following query.

Conclusively, SQL Update Query Example | SQL Update Statement Tutorial is over.
The post SQL Update Query Example | SQL Update Statement Tutorial appeared first on AppDividend.
MySQL 8.0.16 has been released last Thursday. In it, you can find some new replication features. Here is a quick summary. Follow-up blog posts will provide details about these features.
Starting on version 8.0.16, MySQL server introduces a new command that allows
for the binary log master key rotation, online!
When binary log encryption is enabled, the binary log master key can be rotated online by using the following new command:
ALTER INSTANCE ROTATE BINLOG MASTER KEY;
This new command can be used to rotate the binary log master key periodically or whenever you suspect that a key might have been compromised.…
Dear MySQL users,
MySQL Connector/ODBC 5.3.13, a new version of the ODBC driver for the
MySQL database management system, has been released.
The available downloads include both a Unicode driver and an ANSI
driver based on the same modern codebase. Please select the driver
type you need based on the type of your application – Unicode or ANSI.
Server-side prepared statements are enabled by default. It is suitable
for use with any MySQL version from 5.6.
This is the sixth release of the MySQL ODBC driver conforming to the
ODBC 3.8 specification. It contains implementations of key 3.8
features, including self-identification as a ODBC 3.8 driver,
streaming of output parameters (supported for binary types only), and
support of the SQL_ATTR_RESET_CONNECTION connection attribute (for the
Unicode driver only).
The release is now available in source and binary form for a number of
platforms from our download pages at
http://dev.mysql.com/downloads/connector/odbc/5.3.html
For information on installing, please see the documentation at
http://dev.mysql.com/doc/connector-odbc/en/connector-odbc-installation.html
Changes in MySQL Connector/ODBC 5.3.13 (2019-04-29, General Availability)
Bugs Fixed
* Connector/ODBC 5.3 is now built with MySQL client library
5.7.26, which includes OpenSSL 1.0.2R. Issues fixed in
the new OpenSSL version are described at
http://www.openssl.org/news/vulnerabilities.html. (Bug
#29489006)
* An exception was emitted when fetching contents of a
BLOB/TEXT records after executing a statement as a
server-side prepared statement with a bound parameter.
The workaround is not using parameters or specifying
NO_SSPS=1 in the connection string; this allows the
driver to fetch the data. (Bug #29282638, Bug #29512548,
Bug #28790708, Bug #93895, Bug #94545, Bug #92078)
On Behalf of Oracle/MySQL Release Engineering Team,
Hery Ramilison
As of 8.0.16, the mysql_upgrade binary is deprecated, but its functionality is moved into the server. Let’s call this functionality the “server upgrade”. This is added alongside the Data Dictionary upgrade (DD Upgrade), which is a process to update the data dictionary table definitions.…
This post is just a reminder on how to find which settings have been set on MySQL Server.
If you have modified some settings from a configuration file or during runtime (persisted or not), these two queries will show you what are the values and how they were set. Even if the value is the same as the default (COMPILED) in MySQL, if you have set it somewhere you will be able to see where you did it.
First, let’s list all the GLOBAL variables that we have configured in our server:
SELECT t1.VARIABLE_NAME, VARIABLE_VALUE, VARIABLE_SOURCE
FROM performance_schema.variables_info t1
JOIN performance_schema.global_variables t2
ON t2.VARIABLE_NAME=t1.VARIABLE_NAME
WHERE t1.VARIABLE_SOURCE != 'COMPILED';
This is an example of the output:
And now the same query for the session variables:
SELECT t1.VARIABLE_NAME, VARIABLE_VALUE, VARIABLE_SOURCE
FROM performance_schema.variables_info t1
JOIN performance_schema.session_variables t2
ON t2.VARIABLE_NAME=t1.VARIABLE_NAME
WHERE t1.VARIABLE_SOURCE = 'DYNAMIC';
And an example:
You can also find some more info in this previous post. If you are interested in default values of different MySQL version, I also invite you to visit Tomita Mashiro‘s online tool : https://tmtm.github.io/mysql-params/
In case you submit bugs to MySQL, I invite you to also add the output of these two queries.
FromDual has the pleasure to announce the release of the new version 0.9 of its popular FromDual Ops Center for MariaDB and MySQL focmm.
The FromDual Ops Center for MariaDB and MySQL (focmm) helps DBA's and System Administrators to manage MariaDB and MySQL database farms. Ops Center makes DBA and Admins life easier!
The main task of Ops Center is to support you in your daily MySQL and MariaDB operation tasks. More information about FromDual Ops Center you can find here.
The new FromDual Ops Center for MariaDB and MySQL (focmm) can be downloaded from here. How to install and use focmm is documented in the Ops Center User Guide.
In the inconceivable case that you find a bug in the FromDual Ops Center for MariaDB and MySQL please report it to the FromDual bug tracker or just send us an email.
Any feedback, statements and testimonials are welcome as well! Please send them to feedback@fromdual.com.
A complete guide on how to install FromDual Ops Center you can find in the Ops Center User Guide.
Upgrade from 0.3 to 0.9 should happen automatically. Please do a backup of you Ops Center Instance befor you upgrade! Please also check Upgrading.
Everything has changed!
In this blog, we will see how to do flashback recovery or rolling back the data in MariaDB, MySQL and Percona.
As we know the saying “All human make mistakes”, following that in Database environment the data can be deleted or updated in the database either by intentionally or by accidentally.
The above either way can help to recover the lost data, but what really matters is, What is the time taken to rollback or recover the data? and How much downtime was taken to get back to the initial state?
To overcome this disaster mysqlbinlog has a very useful option i.e –flashback that comes along with binary of MariaDB server though it comes with Mariaserver, it works well with Oracle Mysql servers and Percona flavour of MySQL.
Restoring back the data to the previous snapshot in a MySQL database or in a table is called Flashback.
Flashback options help us to undo the executed row changes(DML events).
For instance, it can change DELETE events to INSERTs and vice versa, and also it will swap WHERE and SET parts of the UPDATE events.
Let us simulate a few test cases where flashback comes as a boon for recovering data.
For simulating the test cases I am using employees table and mariadb version 10.2
MariaDB [employees]> select @@version;
+---------------------+
| @@version           |
+---------------------+
| 10.2.23-MariaDB-log |
+---------------------+
1 row in set (0.02 sec)
Table structure :
MariaDB [employees]> show create table employees\G
*************************** 1. row ***************************
       Table: employees
Create Table: CREATE TABLE `employees` (
  `emp_no` int(11) NOT NULL,
  `birth_date` date NOT NULL,
  `first_name` varchar(14) NOT NULL,
  `last_name` varchar(16) NOT NULL,
  `gender` enum('M','F') NOT NULL,
  `hire_date` date NOT NULL,
  PRIMARY KEY (`emp_no`)
) ENGINE=InnoDB DEFAULT CHARSET=latin1
1 row in set (0.00 sec)
Consider the data is deleted was from employees table where first_name =’Chirstian’ .
MariaDB [employees]> select COUNT(*) from employees where first_name ='Chirstian';
+----------+
| COUNT(*) |
+----------+
|      226 |
+----------+
1 row in set (0.07 sec)

MariaDB [employees]> delete from employees where first_name ='Chirstian';
Query OK, 226 rows affected (0.15 sec)
To revert the data to the intial state ,we need to decode the binlog and get the start and stop position of the delete event happened to the employees table.
It is necessary to take a proper start and stop positions. Start position should be taken exactly after BEGIN and Stop position is before the final COMMIT.
[root@vm3 vagrant]# mysqlbinlog -v --base64-output=DECODE-ROWS /var/lib/mysql/mysql-bin.000007 > mysql-bin.000007.txt
BEGIN
/*!*/;
# at 427
# at 501
#190417 17:49:49 server id 1  end_log_pos 501 CRC32 0xc7f1c84b  Annotate_rows:
#Q> delete from employees where first_name ='Chirstian'
#190417 17:49:49 server id 1  end_log_pos 569 CRC32 0x6b1b5c98  Table_map: `employees`.`employees` mapped to number 29
# at 569
#190417 17:49:49 server id 1  end_log_pos 7401 CRC32 0x6795a972         Delete_rows: table id 29 flags: STMT_END_F
### DELETE FROM `employees`.`employees`
### WHERE
###   @1=10004
###   @2='1954:05:01'
###   @3='Chirstian'
###   @4='Koblick'
###   @5=1
###   @6='1986:12:01'
# at 23733
#190417 17:49:49 server id 1  end_log_pos 23764 CRC32 0xf9ed5c3e        Xid = 455
### DELETE FROM `employees`.`employees`
### WHERE
### @1=498513
### @2='1964:10:01'
### @3='Chirstian'
### @4='Mahmud'
### @5=1
### @6='1992:06:03'
# at 7401
COMMIT/*!*/;
# at 23764
#190417 17:49:49 server id 1  end_log_pos 23811 CRC32 0x60dfac86        Rotate to mysql-bin.000008  pos: 4
DELIMITER ;
# End of log file
ROLLBACK /* added by mysqlbinlog */;
Once the count is verified the from the taken positions, we can prepare the data file or the .sql file using flashback as below
[root@vm3 vagrant]# mysqlbinlog -v --flashback --start-position=427 --stop-position=7401 /var/lib/mysql/mysql-bin.000007 > insert.sql
Below is the comparison of conversion from Delete to Insert for a single record:
### DELETE FROM `employees`.`employees`
### WHERE
### @1=498513
### @2='1964:10:01'
### @3='Chirstian'
### @4='Mahmud'
### @5=1
### @6='1992:06:03'

### INSERT INTO `employees`.`employees`
### SET
### @1=498513
### @2='1964:10:01'
### @3='Chirstian'
### @4='Mahmud'
### @5=1
### @6='1992:06:03'
MariaDB [employees]> source insert.sql
Query OK, 0 rows affected (0.01 sec)
Query OK, 0 rows affected (0.00 sec)
Query OK, 0 rows affected (0.01 sec)
Query OK, 0 rows affected (0.00 sec)
Query OK, 0 rows affected (0.00 sec)
Query OK, 0 rows affected (0.00 sec)
Query OK, 0 rows affected (0.00 sec)
Query OK, 0 rows affected (0.00 sec)
Query OK, 0 rows affected (0.00 sec)
And the count is verified after the data load.
MariaDB [employees]> select COUNT(*) from employees where first_name ='Chirstian';
+----------+
| COUNT(*) |
+----------+
|      226 |
+----------+
1 row in set (0.06 sec)
The data was updated based on below conditions
MariaDB [employees]> select COUNT(*) from employees where first_name ='Chirstian' and gender='M';
+----------+
| COUNT(*) |
+----------+
|      129 |
+----------+
1 row in set (0.14 sec)

MariaDB [employees]> update employees set gender='F' where first_name ='Chirstian' and gender='M';
Query OK, 129 rows affected (0.16 sec)
Rows matched: 129  Changed: 129  Warnings: 0

MariaDB [employees]> select COUNT(*) from employees where first_name ='Chirstian' and gender='M';
+----------+
| COUNT(*) |
+----------+
|        0 |
+----------+
1 row in set (0.07 sec)
To revert back the updated data, the same steps to be followed as in case 1.
[root@vm3 vagrant]# mysqlbinlog -v --flashback --start-position=427 --stop-position=8380 /var/lib/mysql/mysql-bin.000008 > update.sql
MariaDB [employees]> source update.sql
Query OK, 0 rows affected (0.00 sec)
Query OK, 0 rows affected (0.00 sec)
Query OK, 0 rows affected (0.00 sec)
Query OK, 0 rows affected (0.00 sec)
Query OK, 0 rows affected (0.00 sec)
Query OK, 0 rows affected (0.00 sec)
Query OK, 0 rows affected (0.00 sec)
Query OK, 0 rows affected (0.01 sec)
Query OK, 0 rows affected (0.00 sec)

MariaDB [employees]> select COUNT(*) from employees where first_name ='Chirstian' and gender='M';
+----------+
| COUNT(*) |
+----------+
|      129 |
+----------+
1 row in set (0.06 sec)
In the above two cases by using flashback option we were able to change Event Type statements from DELETE to INSERT and Update_Event statements by Swapping the SET part and WHERE part.
Key Takeaways:
Photo by Jiyeon Park on Unsplash
In this blog post, we continue on our series of exploring MyRocks mechanics by looking at configurable server variables and column family options. In our last post, I explained at a high level how data first entered memory space and in this post, we’re going to pick up where we left off and talk about how the flush from immutable memtable to disk occurs. We’re also going to talk about how newly created secondary indexes on existing tables get written to disk.
We already know from our previous post in the series that a flush can be prompted by one of several events, the most common of which would be when an active memtable is filled to its maximum capacity and is rotated into immutable status.
When your immutable memtable(s) is ready to flush, MyRocks will call a background thread to collect the data from memory and write it to disk. Depending on how often your records are updated, it’s possible that multiple versions of the same record may exist in the immutable memtable(s), so the flush thread will have to check and remove any record duplication so only the latest record state gets added to the data file.

Once deduplication is complete, the contents of the immutable memtable are written to disk in a series of data blocks (4k by default) that make up the data file that you can find in your MyRocks data directory with the extension ‘.sst’. The size of the data file is going to be the same size as the immutable memtable(s). Remember, the size of your memtable is designated by the column family option write_buffer_size.
There is also metadata added to the file including checksums to ensure that there have been no issues with storage between the time the data file was written and the next time it’s read. Top level index information is also written in order to speed up the time it takes to locate the record you’re seeking within the file itself. Other forms of metadata within the data file will be addressed later in the series when we cover bloom filters.
Now that we know a little bit about how data is flushed from memory to disk, let’s take a more detailed look at the mechanics associated with the flushing process as well as the variables and options that are associated with them.
In my last post, we mentioned when flushing would occur based on memtable capacity, the size of the write buffer, etc. Once the system determines that a flush is required it will use a background thread to take the data from an immutable memtable and write it to disk.
The variable rocksdb_max_background_jobs allows you to specify how many threads will sit in the background to support flushing. Keep in mind that this pool of background threads are used to support both flushing and compaction (we’ll discuss compaction in the next post in the series). In previous versions, the number of threads to support memtable to disk flushes was defined by the variable rocksdb_max_background_flushes; however, this is no longer the case as rocksdb_max_background_jobs replaced this variable and similar variables used to define the number of threads that would support compaction. Now all of these have been grouped together and the number of threads that will be used for memtable to disk flushes versus compaction will be automatically decided by MyRocks.
Default: 2
The value of 2 isn’t all that surprising considering that in previous versions the value of rocksdb_max_background_compactions and rocksdb_max_background_flushes were both 1, meaning there was one thread for flushing and one for compaction, two threads total. We still have two threads, but now MyRocks will decide which process those threads are allocated to.
When MyRocks flushes data from immutable memtable to disk with the extension ‘.sst’, it will add data files to the MyRocks data directory. You can specify the location of this directory using the system variable rocksdb_datadir.
Default: ./.rocksdb
The default indicates that a directory called ‘.rocksdb’ will be created in the MySQL data directory. The MySQL data directory is defined in system variable datadir, which has a default value of /var/lib/mysql. Assuming both datadir and rocksdb_datadir are their default values, the location of the MyRocks data directory would be /var/lib/mysql/.rocksdb.
I mentioned in my first post in this series that it’s not uncommon for users to want to separate sequential and random I/O, which is why you may want to put your write-ahead logs on one set of disks and your data directory on another. You can take this a step further by isolating your logs, data, and operating system. This is becoming less common as SSDs and similar technologies become the database storage of choice, but if you want to go the route of isolating your OS, data, and logs, you can leverage the rocksdb_datadir system variable for that purpose.
Data from immutable memtables are flushed into data files in their entirety after deduplication, but are further broken down into data blocks. These blocks serve as a way to partition the data within the data file in order to speed up lookups when you are looking for a specific record by its key. In each data file there is also what’s called a “top-level index” that provides a key name and offset for each block based on the last key that’s found in each block. If you’re looking for a specific key it will let you know what data block it’s, in leveraging the top level index and a blockhandle.
You can specify how large each data block will be using the system variable rocksdb_block_size.
Default: 4096 (4 Kb)
When the background thread is called upon to do a flush from memtable to disk, it will limit its disk activity based on the value of this variable. Keep in mind that this is the total amount of disk throughput allowed for all background threads, and as we stated earlier, background threads include memtable flushing and compaction.
Default: 0
The default of 0, in this case, means that there is no limit imposed for disk activity. It may be worth considering setting this to a non zero value if you want to make sure disk activity from flushing and compaction doesn’t consume all of your I/O capacity, or if you want to save capacity for other processes such as reads. Keep in mind that if you slow down the process of writing memtable data to disk, under significant load you could theoretically stop write activity if you hit the maximum number of immutable memtables.
For those of you that are familiar with InnoDB you may want to think of this as acting like innodb_io_capacity_max.
One other important thing to note is that according to the documentation, this variable should be able to be changed dynamically; however, my testing has shown that changing this variable to/from a zero value requires a restart. I have created a bug with Percona to bring it to their attention.
In the case that you would like to flush all the data in memtables to disk immediately, you can toggle this variable. A flush will occur, and then the variable will go back to its original value of ‘OFF’.
One important thing to note is that during this flush process, all writes will be blocked until the flush has completed.
Another important point to raise is that during my testing, I found that you could set this variable to any value including false and ‘OFF’ and it would still flush data to disk. You will need to exercise caution when working with this variable as setting it to its default value will still force a flush. In short, don’t set this variable to anything unless you want a flush to occur. I have opened a bug with Percona to raise bring this to their attention.
Default: OFF
When data is written to disk there is a checksum that’s written to the SST file of a percentage of its contents. Much like the InnoDB variable innodb_checksum_algorithm, for those of you who are familiar, the purpose of this is to ensure that a checksum can be read as a data file is retrieved from disk in order to assure disk storage issues such as bit rot didn’t corrupt the data between the time it was written to disk and the time when it was later retrieved for a read operation.
Default: 100
You may be able to increase overall performance by reducing the amount of data that is read to support the checksum, but I would recommend against it as you want to have that assurance that data being read is the same as when it was written.
In addition to checksumming, there is another fault tolerance measure you can take to ensure the accuracy of written data and this is called “‘paranoid checking”. With paranoid checking enabled, data files will be read immediately after they are written in order to ensure the accuracy of the data.
Default: ON
I would be inclined to leave this enabled as I prefer to do all possible checking in order to make sure data is written with the highest degree of accuracy.
When data files are written to disk, they are typically done using fdatasync() which utilizes caching in Linux, but doesn’t offer assurances that data is actually on disk at the end of the call. In order to get that assurance, you can use the variable rocksdb_use_fsync to specify that you would rather have MyRocks call fsync() which will assure a disk sync at the time that the request to write data is complete.
Default: OFF
The most likely reason that this is disabled is to allow for the performance gains achieved by the asynchronous data writing nature of fdatasync(). Potential data loss of data sitting in the OS cache but not on disk during a full system crash may or may not be acceptable for your workload, so you may want to consider adjusting this variable.
If you would rather avoid the disk caching elements of fdatasync() or fsync() for writes to data files via memtables flushes or compaction, you have the option to do so by enabling the variable rocksdb_use_direct_io_for_flush_and_compaction. When it comes to flushing and compaction this will override the value of rocksdb_use_fsync and instead will specify that MyRocks should call O_DIRECT() when writing data to disk.
Default: OFF
In the wiki for RocksDB, you will see that performance gains from using O_DIRECT() are dependent on your use case and are not assured. This is true of all storage engines and testing should always be performed before attempting to adjust a variable like this.
Keep in mind that I have recommended O_DIRECT in the past for InnoDB, but that doesn’t apply here as MyRocks is a very different engine and there really isn’t enough data out there to say what is the best write method for most use cases so far. Exercise caution when changing your write method.
Another thing that is important to understand about syncing to disk is knowing how often it occurs, and that’s where rocksdb_bytes_per_sync comes into play. This variable controls how often a call is made to sync data during the process while data is being written to disk, specifically after how many bytes have been written. Keep in mind that write-ahead logs have their own variable, rocksdb_wal_bytes_per_sync, so rocksdb_bytes_per_sync is just for data files. Also, be aware that depending on what syncing function is called (see above for rocksdb_use_fsync and rocksdb_use_direct_io_for_flush_and_compaction) this may be an asynchronous request for a disk sync.
Default: 0
With the default value of 0, MyRocks will disable the feature of requesting syncs after the designated number of bytes and instead will rely on the OS to determine when syncing should occur.
It is recommended that users of MyRocks not use this feature as a way of ensuring a persistency guarantee.
Typically, when new data gets flushed into persisted space, it ends up in the highest compaction layer, L0. This will be explained in more detail in the next blog post. There is one exception to this rule and that’s when a new secondary index is added to an existing table, which will skip this process and gets written to the bottom-most level of compaction available, which in MyRocks is L6 by default. Think of this as a way for secondary index data to get to its final destination faster. It does this by doing a merge sort of existing data to support the secondary index.
In order to better understand merge sort processes, I would recommend reading this blog post on hackernoon.
There is a memory cache that is used to support the merge sort process specifically for secondary index creation and it’s called the ‘merge buffer’. The rocksdb_merge_buf_size determines how large this buffer will be.
Default: 64Mb
If you checked out the blog post on hackernoon that I mentioned, you’ll know that sorting eventually requires combining the smaller broken down sub-arrays back into the full sorted list. In the case of MyRocks, this uses a completely separate buffer called the “merge combine buffer”. The variable rocksdb_merge_combine_read_size determines how large the merge combine buffer will be.
Default: 1 Gb
You’ll see in the next variable we cover (rocksdb_merge_tmp_file_removal_delay_ms) that MyRocks will create merge files on disk to help support the process of creating new secondary indexes so I/O can occur, but with larger memory buffers you will see less IO.
My take on this would be to not change the global value of this variable, but instead to change it only within the session that I’m using to create the secondary index. Keep in mind that the tradeoff here is that you’re using more memory to speed up index creation; however, if you set the global value of this variable to a large size and forget about it, that large amount of memory may be allocated when you didn’t expect it, which may consume more memory resources than you anticipated, which could lead to issues like OOM, etc.
In addition to the in-memory resources used to work with the merge sort process of creating new secondary indexes, you may also get merge files created on disk. These are temporary files that you will find in the MyRocks data directly with the .tmp extension. Once the secondary index completion process is created, it will immediately delete these files. For storage solutions like flash, removing large amounts of data can cause trim stalls. This variable will allow you to apply a rate limit delay to this process in order to help prevent this issue.
Default: 0 (no delay)
I wouldn’t change the value of this variable unless you have flash storage. If you do use flash storage, you can test by creating and removing indexes to determine what value would be best for this variable. Given that there are no other implications to setting this variable, I would recommend setting the variable globally, including an addition to the my.cnf.
Here are some of the metrics you should be paying attention to when it comes to initial data flushing.
You can find the following information using system status variables
In the information_schema.ROCKSDB_CFSTATS table, you can find the following information about each column family.
In the perfomance_schema, you may find the following setup instrument to be helpful.
In this post, we talked about the mechanics that are involved in flushing data from immutable memtables to disk. We also mentioned a few things about compaction layers, but just enough to help illustrate what’s going on with that initial flush from immutable memtable to disk. Stay tuned for my next post where we’ll do a deeper dive into the mechanics surrounding compaction.