Quantcast
Channel: Planet MySQL
Viewing all 18789 articles
Browse latest View live

How to Save on AWS RDS MySQL Costs by Instance Right-sizing

$
0
0

Right-sizing database instances is the process of adjusting your database instances’ size to match the workload generated by the application. In most cases, the incentive to right-size your database instances will be to lower the cloud infrastructure’s costs, ideally without compromising on performance.

In this post we’ll guide you through how to analyze the instance’s used resources, in an effort to identify opportunities to save on your RDS costs.

How to identify memory related down-sizing opportunities

MySQL has a lot of “moving parts” which may contribute to the amount of memory it needs to operate efficiently. Just to list a few of the most impactful factors: fixed-size buffers (query cache, innodb buffer pool size), the database’s workload (query connections, query buffers), replication internals (replication connections, binary log caches) and more.

When looking for down-sizing opportunities, we’re searching for instances with too much memory, which isn’t really used by the database for the current workload. So how can we tell whether the database really needs the amount of memory that was allocated to it?

Looking at the memory usage of MySQL’s process at the OS level isn’t a good indicator, as large portions of the memory (such as the innodb buffer pool) are pre-allocated by the process, but not necessarily used. A better indicator can be found by analyzing the usage patterns of what is usually the largest memory consumer - the innodb buffer pool.

The innodb buffer pool is a fixed-size memory area where the database’s engine caches the table’s data and the indexes data. Ideally, the innodb buffer pool should have enough space to hold the data and indexes which are commonly accessed by the database, so that all queries will be served using the memory, with limited amount of disk access required. So if your database needs to access 5GB of data and indexes on a regular basis, it doesn’t make a lot of sense to preallocate 100GB to the innodb buffer pool.

To analyze the usage patterns of the innodb buffer pool, you can use MySQL’s built in command `show engine innodb status`. In the command’s output, you should look at:

  • Free buffers - The total size (in pages) of the buffer pool free list. What this actually means is that if your system is fully warmed up and this number is rather high, it probably means you’re allocating too much memory for your innodb buffer pool, as some of it isn’t really utilized. Tracking this indicator over time, in both regular hours and during workload peaks will show you the full picture. High value of free buffers over time may be an indicator for a memory down-sizing opportunity.
  • Pages evicted without access - The per second average of the pages evicted without being accessed from the buffer pool. If this number is larger than 0, it means that there are times where data is loaded to the buffer pool and pulled out from it without it even being actually used. Having a number larger than zero for this indicator over time may mean that you didn’t allocate enough memory to the innodb buffer pool, which may in turn indicate that you shouldn’t down-size this instance, as it may even need more memory to perform optimally.

This is an example of the output shown by the innodb status command:

----------------------
BUFFER POOL AND MEMORY
----------------------
Total large memory allocated 6596591616
Dictionary memory allocated 415137
Buffer pool size 393216
Free buffers 378927
Database pages 14285
Old database pages 5428
….
0.00 reads/s, 0.00 creates/s, 0.00 writes/s
No buffer pool page gets since the last printout
Pages read ahead 0.00/s, evicted without access 0.00/s, Random read ahead 0.00/s
….

This sample demonstrates an output that may indicate that the database has too much memory allocated to it.

How to identify CPU related down-sizing opportunities

Matching the right amount of vCPUs to efficiently serve your applications workload can be a difficult task. To locate opportunities for instance down-sizing, we should look at the CPU usage over time, to see whether the amount of vCPUs matches the actual requirements from our workload.

Amazon RDS Performance Insights allows you to quickly assess the existing load on your database. By looking at the CPU usage over time, you can identify which instances are not actually using their allocated resources and can be considered for down-sizing.

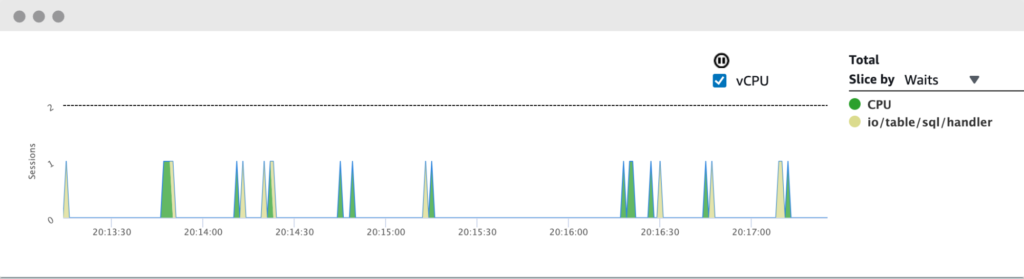
For example, looking at the database load chart for this instance, we can see that there is no more than one vCPU used simultaneously at any given time, while the instance has 2 vCPUs allocated to it (as indicated by the dotted flat line at the top of the chart). If you’re seeing a similar pattern for your instances over time (in both regular hours and workload peaks), that’s a strong indication that you may consider down-sizing the instance by reducing the amount of vCPUs.

Resizing instances based on users behavior patterns

By analyzing your workload, you can identify opportunities for down-sizing instances based on your user behavior patterns. For example, if your users are all from a specific time zone, maybe you can consider down-sizing the instance after a certain hour, when the workload reduces significantly.

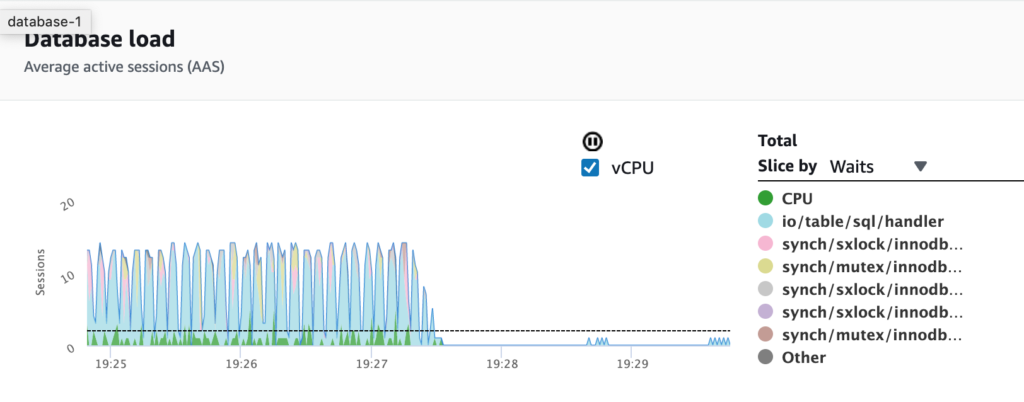
In the load charts above, Performance Insights can show us that around 19:30, the workload on the instance reduces significantly. Tracking this behavior over time can help us understand our users behavior patterns and apply automatic resizing actions.

Please keep in mind that re-sizing the instance may require downtime when working with a single instance for each database. To avoid any downtime, you can consider working with a multi-AZ RDS environment, which will allow you to apply the changes to a reader instance before actually switching it (failover) to act as your production writer instance.

Actively driving CPU and memory usage down

In some cases, after analyzing the CPU and memory usage on your instances, you may find that you can’t down-size the instance without actually reducing the workload on that instance.

Poorly optimized SQL queries tend to require a significant amount of resources, which in turn forces you to choose a ‘larger’ instance type than you would need if those queries were tuned for optimal performance.

AWS RDS Performance Insights can help you identify which SQL queries take up most of your resources, so you could focus on optimizing those queries.

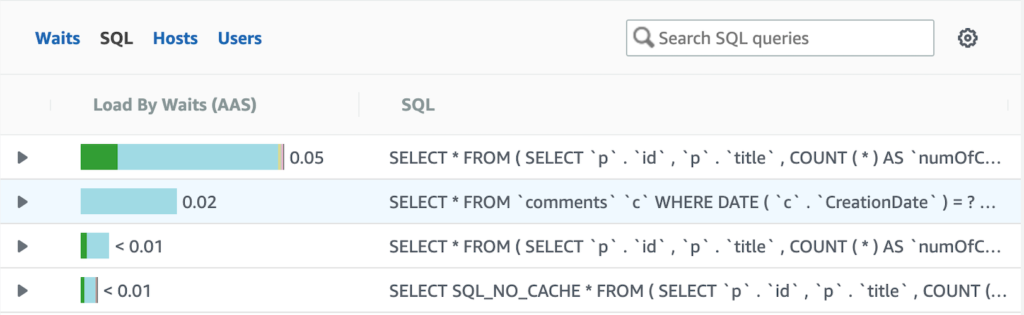
As the query optimization process can be complex and time consuming, you can integrate Performance Insights with EverSQL’s sql query optimization product, which will allow you to optimize slow queries automatically, directly from the Performance Insights interface.

Wrapping up

Right-sizing RDS instances is a great way to drive RDS costs down. It can be done by analyzing the actual resource usage on your instances to identify down-sizing opportunities which do not require compromising on performance or availability. Also, you can take actions to actively optimize your SQL queries and your database workload and drive the CPU and memory usage down, which in turn can allow you to safely down-size your RDS instances while keeping the same service level.


NDB Parallel Query, part 1

$
0
0
I will describe how NDB handles complex SQL queries in a number of
blogs. NDB has the ability to parallelise parts of join processing.
Ensuring that your queries makes best possible use of these
parallelisation features enables appplications to boost their
performance significantly. It will also be a good base to explain
any improvements we add to the query processing in NDB Cluster.

NDB was designed from the beginning for extremely efficient key lookups
and for extreme availability (less than 30 seconds of downtime per year
including time for software change, meta data changes and crashes).

Originally the model was single-threaded and optimised for 1-2 CPUs.
The execution model uses an architecture where messages are sent
between modules. This made it very straightforward to extend the
architecture to support multi-threaded execution when CPUs with
many cores became prevalent. The first multi-threaded version of NDB
was version 7.0. This supported up to 7 threads working parallel
plus a large number of threads handling interaction with the file
system.

With the introduction of 7.0 the scans of a table, either using an
range scan on an index or scanning the entire table was automatially
parallelised. So NDB have supported a limited form of parallel query
already since the release of 7.0 (around 2011 I think).

Now let's use an example query, Q6 from DBT3 that mimics TPC-H.

SELECT
    SUM(l_extendedprice * l_discount) AS revenue
FROM
    lineitem
WHERE
    l_shipdate >= '1994-01-01'
    AND l_shipdate < DATE_ADD( '1994-01-01' , INTERVAL '1' year)
    AND l_discount BETWEEN 0.06 - 0.01 AND 0.06 + 0.01
    AND l_quantity < 24;

The execution of this will use a range scan on the index on l_shipdate.
This range is a perfectly normal range scan in NDB. Since range scans
are parallelised, this query will execute using 1 CPU for each partition
of the table. Assuming that we set up a cluster with default setup
and with 8 LDM threads the table will be partitioned into 16 partitions.
Each of those partitions will have a different CPU for the primary
partition. This means that the range scans will execute on 16 CPUs in
parallel.

LDM (Local Data Manager) is the name of the threads in the NDB data
nodes that manages the actual data in NDB. It contains a distributed
hash index for the primary keys and unique keys, an ordered index
implemented as a T-tree, a query handler that controls execution of
lookups and scans and checkpointing and also handles the REDO log.
Finally the LDM thread contains the row storage that has 4 parts.
Fixed size parts of the row in memory, variable sized parts of the
row in memory, dynamic parts of the row (absence of a column here
means that it is NULL, so this provides the ability to ADD a column
as an online operation) and finally a fixed size part that is stored
on disk using a page cache. The row storage also contains an
interpreter that can evaluate conditions, perform simple operations
like add to support efficient auto increment.

Now the first implementation of the NDB storage engine was implemented
such that all condition evaluation was done in the MySQL Server. This
meant that although we could scan the table in parallel, we still had
a single thread to evaluate the conditions. This meant that to handle
this query efficiently a condition pushdown is required. Condition
pushdown was added to the MySQL storage engine API a fairly long time
ago as part of the NDB development and can also benefit any other
storage engine that can handle condition evaluation.

So the above contains 3 parts that can be parallelised individually.
Scanning the data, evaluating the condition and finally performing
the sum on the rows that match the condition.

NDB currently parallelises the scan part and the condition evaluation
part. The sum is handled by the MySQL Server. In this case this the
filtering factor is high, so this means that the sum part is not a
bottleneck in this query. The bottleneck in this query is scanning
the data and evaluating the condition.

In the terminology of relational algebra this means that NDB supports
a parallelised filter operator for some filters. NDB also supports a
parallel project operator. NDB doesn't yet support a parallel
aggregation operator.

The bottleneck in this query is how fast one can scan the data and
evaluate the condition. In version 7.6 we made a substantial
optimisation of this part where we managed to improve a simple
query by 240% through low-level optimisations of the code.
With this optimisation NDB can handle more than 2 million rows
per second per CPU with a very simple condition to evaluate. This
query greatly benefits from this greater efficiency. Executing this
query with scale factor 10 (60M rows in the lineitem table) takes
about 1.5 seconds with the configuration above where 16 CPUs
concurrently perform the scan and condition evaluation.

A single-threaded storage engine is around 20x slower. With more
CPUs available in the LDM threads the parallelisation will be even
higher.

Obviously there are other DBMSs that are focused on analytical
queries that can handle this query even faster, NDB is focused
on online applications with high write scalability and the highest
availability. But we are working to also make query execution of
complex SQL much faster that online applications can analyze
data in real-time.

Query Execution

In the figure below we describe the execution flow for this query. As usual
the query starts with parsing (unless it is a prepared statement) and after
that the query is optimised.

This query is executed as a single range scan against the lineitem table. Scans
are controlled by a TC thread that ensures that all the fragments of the table are
scanned. It is possible to control the parallelism of the query through the
NDB API. In most of the cases the parallelism will be full parallelism. Each thread
has a real-time scheduler and the scan in the LDM threads will be split up into
multiple executions that will be interleaved with execution by other queries
executing in parallel.

This means that in an idle system this query will be able to execute at full speed.
However even if there is lots of other queries going on in parallel the query will
execute almost as fast as long as the CPUs are not overloaded.

In the figure below we also show that control of the scan goes through the TC
thread, but the result row is sent directly from the LDM thread to the NDB API.

In the MySQL Server the NDB storage engine gets the row from the NDB API
and returns it to the MySQL Server for the sum function and result processing.

Query Analysis

The query reads the lineitem table that has about 6M rows in scale
factor 1. It reads them using an index on l_shipdate. The range
consists of 909.455 rows to analyse and of those 114.160 rows are
produced to calculate results of the sum.  In the above configuration
it takes about 0.15 seconds for NDB to execute the query. There are
some limitations to get full use of all CPUs involved even in this
query that is related to batch handling. I will describe this in a
later blog.

Scalability impact

This query is only positively impacted by any type of scaling. The
more fragments the lineitem table is partitioned into, the more
parallelism the query will use. So the only limitation to scaling
is when the sum part starts to become the bottleneck.

Next part

In the next part we will discuss how NDB can parallelise a very
simple 2-way join from the DBT3 benchmark. This is Q12 from
TPC-H that looks like this.

SELECT
        l_shipmode,
        SUM(CASE
                WHEN o_orderpriority = '1-URGENT'
                        OR o_orderpriority = '2-HIGH'
                        THEN 1
                ELSE 0
        END) AS high_line_count,
        SUM(CASE
                WHEN o_orderpriority <> '1-URGENT'
                        AND o_orderpriority <> '2-HIGH'
                        THEN 1
                ELSE 0
        END) AS low_line_count
FROM
        orders,
        lineitem
WHERE
        o_orderkey = l_orderkey
        AND l_shipmode IN ('MAIL', 'SHIP')
        AND l_commitdate < l_receiptdate
        AND l_shipdate < l_commitdate
        AND l_receiptdate >= '1994-01-01'
        AND l_receiptdate < DATE_ADD( '1994-01-01', INTERVAL '1' year)
GROUP BY
        l_shipmode
ORDER BY
        l_shipmode;

This query introduces 3 additional relational algebra operators,
a join operator, a group by operator and a sort operator.

NDB Parallel Query, part 2

$
0
0
In part 1 we showed how NDB can parallelise a simple query with only a single
table involved. In this blog we will build on this and show how NDB can only
parallelise some parts of two-way join query. As example we will use Q12 in
DBT3:

SELECT
        l_shipmode,
        SUM(CASE
                WHEN o_orderpriority = '1-URGENT'
                        OR o_orderpriority = '2-HIGH'
                        THEN 1
                ELSE 0
        END) AS high_line_count,
        SUM(CASE
                WHEN o_orderpriority <> '1-URGENT'
                        AND o_orderpriority <> '2-HIGH'
                        THEN 1
                ELSE 0
        END) AS low_line_count
FROM
        orders,
        lineitem
WHERE
        o_orderkey = l_orderkey
        AND l_shipmode IN ('MAIL', 'SHIP')
        AND l_commitdate < l_receiptdate
        AND l_shipdate < l_commitdate
        AND l_receiptdate >= '1994-01-01'
        AND l_receiptdate < DATE_ADD( '1994-01-01', INTERVAL '1' year)
GROUP BY
        l_shipmode
ORDER BY
        l_shipmode;

This query when seen through the relational operators will first pass through
a SELECT operator and a PROJECT operator in the data nodes. The JOIN operator
will be executed on the lineitem and orders tables and the result of the JOIN operator
will be sent to the MySQL Server. The MySQL Server will thereafter handle the
GROUP BY operator with its aggregation function and also the final SORT operator.
Thus we can parallelise the filtering, projection and join, but the GROUP BY
aggregation and sorting will be implemented in the normal MySQL execution of
GROUP BY, SUM and sorting.

This query will be execute by first performing a range scan on the lineitem
table and evaluating the condition that limits the amount of rows to send to
the join with the orders table. The join is performed on the primary key of
the orders table. So the access in the orders table is a primary key lookup
for each row that comes from the range scan on the lineitem table.

In the MySQL implementation of this join one will fetch one row from the
lineitem table and for each such row it will perform a primary key lookup
in the orders table. Given that this means that we can only handle one
primary key lookup at a time unless we do something in the NDB storage
engine. The execution of this query without pushdown join would make
it possible to run the scans towards the lineitem table in parallel. The
primary key lookup on the orders table would however execute serially
and only fetching one row at a time. This will increase the query time in
this case with a factor of around 5x. So by pushing the join down into
the NDB data nodes we can make sure that the primary key lookups on the
orders table are parallelised as well.

To handle this the MySQL Server has the ability to push an entire join
execution down to the storage engine. We will describe this interface in more
detail in a later blog part.

To handle this query in NDB we have implemented a special scan protocol that
enables performing complex join operations. The scan will be presented with
a parameter part for each table in the join operation that will describe the
dependencies between the table and the conditions to be pushed to each table.

This is implemented in the TC threads in the NDB data node. The TC threads in
this case acts as parallel JOIN operators. The join is parallelised on the
first table in the join, in this case the lineitem table. For each node in
the cluster a JOIN operator will be created that takes care of scanning all
partitions that have its primary partition in the node. This means that the
scan of the first table and the join operator is always located on the same node.

The primary key lookup is sent to the node where the data resides, in a cluster
with 2 replicas and 2 nodes and the table uses READ BACKUP, we will always find
the row locally. With larger clusters the likelihood that this lookup is sent
over the network increases.

Compared to a single threaded storage engine this query scales almost 30x times
using 2 nodes with 8 LDM threads each. NDBs implementation is as mentioned in
the previous blog very efficiently implemented, so the speedup gets a benefit
from this.

This query is more efficiently implemented in MySQL Cluster 8.0.18 since we
implemented support for comparing two columns, both from the same table and
from different tables provided they have the same data type. This improved
performance of this query by 2x. Previous to this the NDB interpreter could
handle comparisons of the type col_name COMPARATOR constant, e.g.
l_receiptdate >= '1994-01-01'.

Query Execution


In the figure below we show the execution flow for this query in NDB. As described
above we have a module called DBSPJ in the TC threads that handle the JOIN
processing. We have shown in the figure below the flow for the scan of the lineitem
table in blue arrows. The primary key lookups have been shown with red arrows.
In the figure below we have assumed that we're not using READ BACKUP. We will
describe in more detail the impact of READ BACKUP in a later part of this blog serie.


Query Analysis

The query will read the lineitem in parallel using a range scan. This scan will
evaluate 909.844 rows when using scale factor 1 in TPC-H. Of those rows there will
be 30.988 rows that will evaluate to true. Each of those 30.988 rows will be sent to the
NDB API but will also be reported to the DBSPJ module to issue parallel key lookups
towards the orders table.

As a matter of a fact this query will actually execute faster than Q6 although it does
more work compared to the previous query we analysed (Q6 in TPC-H). Most of the
work is done in the lineitem table, both Q6 and Q12 does almost the same amount of
work in the range scan on the lineitem. However since there are fewer records to report
back to the MySQL Server this means that parallelism is improved due to the batch
handling in NDB.

Scalability impact

This query will scale very well with more partitions of the lineitem table
and the orders table. As the cluster grows some scalability impact will
come from a higher cost of the primary key lookups that have to be sent on
the network to other nodes.

Next Part

In part 3 we will discuss how the MySQL Server and the NDB storage engine works
together to define the query parts pushed down to NDB.

How to Deal with Triggers in Your Mysql Database When Using Tungsten Replicator

$
0
0

Overview

Over the past few days we have been working with a number of customers on the best way to handle Triggers within their MySQL environment when combined with Tungsten Replicator. We looked at situations where Tungsten Replicator was either part of a Tungsten Clustering installation or a standalone replication pipeline.

This blog dives head first into the minefield of Triggers and Replication.

Summary and Recommendations

The conclusion was that there is no easy one-answer-fits-all solution – It really depends on the complexity of your environment and the amount of flexibility you have in being able to adjust. Our top level summary and recommendations are as follows:

If using Tungsten Clustering and you need to use Triggers:

  • Switch to ROW Based binary Logging, and either
    • Recode triggers to only fire when read_only=ON or based on user(), or
    • Use the replicate.ignore filter

If using Tungsten Replicator only, and you need to use Triggers:
If source instance is running in ROW based binary logging mode:

  • Drop triggers on target, or
  • Recode triggers to only fire when read_only=ON or based on user(), or
  • Use the replicate.ignore filter

If source instance is running in MIXED based binary logging mode:

Read on for more information on why we made these recommendations…

Deep Analysis

Running with ROW Based Binary Logging

Let’s create two simple tables, one for employees and one as an audit table. We’ll then create a trigger that will fire after an INSERT. Each trigger will write into the audit table, the id and employee name from the employee table, along with the action ‘INSERT’ and a timestamp.

CREATE TABLE employees
    ( employee_id    INT(6) PRIMARY KEY
    , first_name     VARCHAR(20)
    , last_name      VARCHAR(25) NOT NULL
    , hire_date      DATE NOT NULL
     ) ;

CREATE TABLE employee_audit
   (id              INT(6) AUTO_INCREMENT PRIMARY KEY,
    employee_id     INT(6),
    employeename    VARCHAR(50),
    recstate        CHAR(6),
    auditdate       DATE);

CREATE TRIGGER trgInsEmployees AFTER INSERT ON employees
FOR EACH ROW
BEGIN

    INSERT INTO employee_audit (employee_id, employeename,recstate,auditdate)
     VALUES (NEW.employee_id,NEW.first_name,'INSERT',NOW());

END;

Our source database is in ROW based logging, and the triggers exist and are active on the slave.

Let’s insert a record into the employees table

INSERT INTO employees VALUES 
        (100, 'Steven', 'King', '2019-06-01');

All good on our master, but nothing on our slave and our replicator is in an error state.

pendingError           : Event application failed: seqno=50 fragno=0 message=java.sql.SQLIntegrityConstraintViolationException: Duplicate entry '1' for key 'PRIMARY'
pendingErrorCode       : NONE
pendingErrorEventId    : mysql-bin.000004:0000000000017892;-1
pendingErrorSeqno      : 50
pendingExceptionMessage: java.sql.SQLIntegrityConstraintViolationException: Duplicate entry '1' for key 'PRIMARY' Failing statement : INSERT INTO `sample`.`employee_audit` ( `id` , `employee_id` , `employeename` , `recstate` , `auditdate` )  VALUES (  ?  ,  ?  ,  UNHEX( ? )  ,  UNHEX( ? )  ,  ?  )

If we look at the THL we see we have extracted the INSERT on the employee table, but we have also extracted the INSERT on the audit table and this has come through as a complete transaction. When the INSERT on the employee table happens by the replicator, the trigger is firing and doing the INSERT on the audit table for us, but then the replicator is also trying to INSERT the same row.

SEQ# = 78 / FRAG# = 0 (last frag)
- FILE = thl.data.0000000001
- TIME = 2019-12-05 11:51:48.0
- EPOCH# = 0
- EVENTID = mysql-bin.000004:0000000000027015;-1
- SOURCEID = mysql01
- METADATA = [mysql_server_id=101;dbms_type=mysql;tz_aware=true;service=alpha;shard=sample]
- TYPE = com.continuent.tungsten.replicator.event.ReplDBMSEvent
- OPTIONS = [foreign_key_checks = 1, unique_checks = 1, time_zone = '+00:00', ##charset = ISO-8859-1]
- SQL(0) =
 - ACTION = INSERT
 - SCHEMA = sample
 - TABLE = employees
 - ROW# = 0
  - COL(1: ) = 100
  - COL(2: ) = Steven
  - COL(3: ) = King
  - COL(4: ) = 2019-06-01
- OPTIONS = [foreign_key_checks = 1, unique_checks = 1, time_zone = '+00:00', ##charset = ISO-8859-1]
- SQL(1) =
 - ACTION = INSERT
 - SCHEMA = sample
 - TABLE = employee_audit
 - ROW# = 0
  - COL(1: ) = 1
  - COL(2: ) = 100
  - COL(3: ) = Steven King
  - COL(4: ) = INSERT
  - COL(5: ) = 2019-12-05

If we skip the error on the replicator then we rollback and loose the initial insert on the employee table too so now we have data discrepancy. If we DROP the trigger on the slave and bring the replicator online to retry, then everything goes through and tables match.

If for some reason we have no primary key on our audit table though, we wouldn’t have seen any error, and you would be fooled into thinking everything was ok, but in fact what you would end up with is doubling up of data, or depending upon the complexity of your trigger, data corruption of an even greater scale!

What if you need to have triggers on the slaves because your slave could become a MASTER at some point, or perhaps you have consistency checks and you need to ensure the entire structure matches? In this scenario the safest option is to add some simple checks in your Triggers. Typically, your slave databases should be in read only mode, therefore a simple test could check and only execute the statements within the trigger if the database is read/write.

However, this could be flawed if you are only replicating into your target, a subset of data for example, and in fact you need the target to be read/write for applications that perhaps work with other schemas. In this instance you could do a check in the trigger for the user that caused the trigger to fire. You could stop the trigger firing if the value of user() is the account you configured the replicator to use, ie tungsten, then you know the trigger will only fire when the initial call is a genuine insert, not as a result of the replicator applying the data, this could look something like the following:

CREATE TRIGGER trgInsEmployees AFTER INSERT ON employees
FOR EACH ROW
BEGIN

    IF user() != 'tungsten@db1' THEN
     INSERT INTO employee_audit (employee_id, employeename,recstate,auditdate)
     VALUES (NEW.employee_id,CONCAT(NEW.first_name,' ',NEW.last_name),'INSERT','2019-12-05');
    END IF;

END;

However, what happens if you have hundreds of tables or very complex triggers? – this would be a lot of coding.

Sadly, there is no simple answer, the three options above need to be assessed and the right course of action taken to suit your environment!

Running with MIXED Based Binary Logging

Let’s now look at what happens when we are in MIXED logging mode

Using the same structure and same trigger code, we see the same result because as we’re in MIXED mode, MySQL has decided to log the event as a ROW event, so the same situation arises as before.

It logged the entire transaction as ROW because the trigger code was non-deterministic due to the use of the now() function and also because the table has an auto_increment column.

MySQL’s decision making on whether to switch between ROW or STATEMENT when in MIXED mode has a number of conditions, more detail on those rules at the link below, but specifically I want to call out this line:

“When one or more tables with AUTO_INCREMENT columns are updated and a trigger or stored function is invoked..”

Taken from https://dev.mysql.com/doc/refman/8.0/en/binary-log-mixed.html

So let’s change our table to force MySQL to NOT switch to ROW based logging by removing the AUTO_INCREMENT and removing the now() from our code:

CREATE TABLE employee_audit
   (id              INT(6) PRIMARY KEY,
    employee_id     INT(6),
    employeename    VARCHAR(50),
    recstate        CHAR(6),
    auditdate       DATE);

CREATE TRIGGER trgInsEmployees AFTER INSERT ON employees
FOR EACH ROW
BEGIN

    INSERT INTO employee_audit (id,employee_id, employeename,recstate,auditdate)
     VALUES (NEW.employee_id, NEW.employee_id,NEW.first_name,'INSERT','2019-12-05');

END;

Now let’s run our insert and see what happens…

This time, the initial INSERT is logged as a statement, and in STATEMENT mode, MySQL does NOT log the data changes as a result of a trigger firing, therefore we don’t replicate them either.

The THL shows this:

SEQ# = 110 / FRAG# = 0 (last frag)
- FILE = thl.data.0000000001
- TIME = 2019-12-05 12:25:52.0
- EPOCH# = 79
- EVENTID = mysql-bin.000005:0000000000010296;17
- SOURCEID = mysql01
- METADATA = [mysql_server_id=101;dbms_type=mysql;tz_aware=true;service=alpha;shard=sample]
- TYPE = com.continuent.tungsten.replicator.event.ReplDBMSEvent
- OPTIONS = [##charset = UTF-8, autocommit = 1, sql_auto_is_null = 0, foreign_key_checks = 1, unique_checks = 1, sql_mode = 'NO_ENGINE_SUBSTITUTION,NO_AUTO_CREATE_USER,ONLY_FULL_GROUP_BY,STRICT_TRANS_TABLES,ERROR_FOR_DIVISION_BY_ZERO,NO_ZERO_DATE,NO_ZERO_IN_DATE', character_set_client = 33, collation_connection = 33, collation_server = 8]
- SCHEMA = sample
- SQL(0) = INSERT INTO employees VALUES
        ( 100
        , 'Steven'
        , 'King'
        , '2019-06-01'
        )

In this situation you need to have the trigger enabled on the target otherwise you will end up missing data!!

If you have a mix of triggers that will cause MySQL to behave differently each time, MIXED mode could cause a lot of confusion and data drift/corruption if not handled with care.

Using the check against user() or read_only in this case won’t help either because you may need the trigger to fire as a result of the replicators preceding insert, sadly there is no way to know if the trigger is fired as a result of a ROW or STATEMENT based action.

When in MIXED mode there really is no safe option unless you are 100% confident that all of your triggers would be non-deterministic and result in a ROW based binlog entry.

Can the replicator help?

Sadly not! Because MySQL doesn’t flag in the binlog whether the DML is the result of a trigger firing, and doesn’t log it at all in some situations, we have no way of making a judgement on what to do.

However, one final option that I haven’t covered, could be to use the replicator filters. This would only help if the tables affected by your triggers are solely maintained as a result of the triggers code. In these cases you could consider excluding them from replication by using the replicate.ignore filter

This would ensure no changes associated with these tables are applied and you would rely 100% on the triggers in the target database to maintain them, however, for non-deterministic statements you could still end up with data differences between these tables in your source and target!!

The Wrap-Up

In this blog post we discussed the correct way to Triggers with Tungsten Replication between MySQL databases.

Tungsten Clustering is the most flexible, performant global database layer available today – use it underlying your SaaS offering as a strong base upon which to grow your worldwide business!

For more information, please visit https://www.continuent.com/solutions

Want to learn more or run a POC? Contact us.

Angular 9/8 Tutorial By Example: REST CRUD APIs & HTTP GET Requests with HttpClient

$
0
0
In this Angular 9 tutorial, we'll learn to build an Angular 9 CRUD example application going through all the required steps from creating/simulating a REST API, scaffolding a new project, setting up the essential APIs, and finally building and deploying your final application to the cloud. We'll learn by example how to send GET requests with URL query strings and parameters and process HTTP responses from REST API servers in your Angular 9/8 application using Httplient for fetching and consuming JSON data, how to do error handling for HTTP errors using the RxJS throwError() and catchError() operators, how to retry failed HTTP requests in poor network connections and cancel pending requests using the RxJS retry() and takeUntil() operators, and finally how to deploy the application to Firebase hosting using the latest Angular 8.3+ features. We'll also see how to use Angular services and RxJS Observables, and learn how to set up Angular Material in our project and style the UI with Material Design components. We'll see how to use the new ng deploy feature in Angular 8.3+ to easily deploy your Angular 9 application from the command-line to Firebase hosting. Angular 9 is currently in RC version, and comes with various new features and improvements particularly the new Ivy renderer. This tutorial is now updated to the latest Angular 9 version. Note: Please note that we are using HttpClient which is an improved version of the HTTP Client API, available starting from Angular version 4.3.0-rc.0. The old HTTP client is not available in Angular 9. You can also check out how to use HttpClient with Angular 9 to build a news application that fetches JSON data from a third-party REST API in this tutorial. Throughout this step by step Angular 9 tutorial, we are going to see a practical CRUD example of how to use the HttpClient that's available from the @angular/common/http package, to make HTTP GET requests using the get() method. We'll cover: How to create a fake and complete working CRUD REST API, How to install Angular CLI v9, How to create an Angular 9 project using Angular CLI, How to set up Angular Material and style your application with Material Design, How to create Angular components, routing and navigation between them, How to create and inject Angular services, How to send HTTP GET requests to servers using HttpClient, How to use the HttpParams class to add URL query strings in your HttpRequest, How to subscribe and unsubscribe from RxJS Observables returned by HttpClient, How to handle HTTP errors using the throwError() and catchError() operators, How to retry failed HTTP requests using the RxJS retry() operator, How to unsubscribe from RxJS Observables returned from HttpClient methods using the takeUntil() operator when requests are concelled, How to build your application for production and deploy it to Firebase hosting using the new ng deploy command available from Angular 8.3+ The steps of this Angular 9 tutorial are as follows: Step 1 — Setting up Angular CLI v9 Step 2 — Initializing a New Angular 9 Example Project Step 3 — Setting up a (Fake) JSON REST API Step 4 — Setting up Angular HttpClient v9 in our Example Project Step 5 — Creating Angular 9 Components Step 6 — Adding Angular 9 Routing Step 7 — Styling the UI with Angular Material v9 Step 8 — Consuming the JSON REST API with Angular HttpClient v9 Step 9 — Adding HTTP Error Handling with RxJS catchError() & HttpClient Step 10 — Retrying Failed HTTP Requests with RxJS retry() & HttpClient Step 11 — Unsubscribing from HttpClient Observables with RxJS takeUntil() Step 12 — Adding URL Query Parameters to the HttpClient get() Method Step 13 — Getting the Full HTTP Response with Angular HttpClient v9 Step 14 — Requesting a Typed HTTP Response with Angular HttpClient v9 Step 15 — Building and Deploying your Angular 9 Application to Firebase Hosting Let's get started by introducing Angular HttpClient, its features and why using it. What is Angular HttpClient? Front end applications, built using frameworks like Angular communicate with backend servers through REST APIs (which are based on the HTTP protocol) using either the XMLHttpRequest interface or the fetch() API. Angular HttpClient makes use of the XMLHttpRequest interface that supports both modern and legacy browsers. The HttpClient is available from the @angular/common/http package and has a simplified API interface and powerful features such as easy testability, typed request and response objects, request and response interceptors, reactive APIs with RxJS Observables, and streamlined error handling. Why Angular HttpClient? The HttpClient builtin service provides many advantages to Angular developers: HttpClient makes it easy to send and process HTTP requests and responses, HttpClient has many builtin features for implementing test units, HttpClient makes use of RxJS Observables for handling asynchronous operations instead of Promises which simplify common web development tasks such as - The concelation of HTTP requests, - Listenning for the progression of download and upload operations, - Easy error handling, - Retrying failed HTTP requests, etc. Now after introducing HttpClient, let's proceed to building our example application starting with the prerequisites needed to successfully complete our Angular 9 tutorial. Prerequisites Before getting started you need a few prerequisites: Basic knowledge of TypeScript. Particularly the familiarity with Object Oriented concepts such as TypeScript classes and decorators. A local development machine with Node 10+, together with NPM 6+ installed. Node is required by the Angular CLI like the most frontend tools nowadays. You can simply go to the downloads page of the official website and download the binaries for your operating system. You can also refer to your specific system instructions for how to install Node using a package manager. The recommended way though is using NVM — Node Version Manager — a POSIX-compliant bash script to manage multiple active Node.js versions. Note: If you don't want to install a local environment for Angular development but still want to try the code in this tutorial, you can use Stackblitz, an online IDE for frontend development that you can use to create an Angular project compatible with Angular CLI. If you have the previous prerequisites, you are ready for the next steps of our Angular 9 tutorial that will teach you by example how to use Angular HttpClient to send HTTP GET requests for fetching JSON data and the various RxJS operators such as catchError(), tap(), retry(), and takeUntil() for implementing advanced features such as error handling, retrying failed HTTP requests and cancelling pending requests. In the first step(s) of our tutorial, we'll see how to install Angular CLI 9 and create an example project from scratch. Step 1 — Setting up Angular CLI v9 In this step, we'll install the latest Angular CLI 9 version (at the time of writing this tutorial). Note: These instructions are also valid for Angular 8. Angular CLI is the official tool for initializing and working with Angular projects. To install it, open a new command-line interface and run the following command: $ npm install -g @angular/cli@next At the time of writing this tutorial, angular/cli v9.0.0-rc.2 will be installed on your system. Please note that until Angular 9 is officialy released, you need to use the @next tag to install the latest pre-release version. If you run the ng version command, you should get a similar output: Angular CLI: 9.0.0-rc.2 Node: 10.16.3 OS: win32 ia32 Angular: ... Package Version ------------------------------------------------------ @angular-devkit/architect 0.900.0-rc.2 @angular-devkit/core 9.0.0-rc.2 @angular-devkit/schematics 9.0.0-rc.2 @schematics/angular 9.0.0-rc.2 @schematics/update 0.900.0-rc.2 rxjs 6.5.3 In the next step, we'll learn how to intialize a new example project from the command-line. Step 2 — Initializing a New Angular 9 Example Project In this step, we'll proceed to create our example project. Head back to your command-line interface and run the following commands: $ cd ~ $ ng new angular-httpclient-example The CLI will ask you a couple of questions — If Would you like to add Angular routing? Type y for Yes and Which stylesheet format would you like to use? Choose CSS. This will instruct the CLI to automatically set up routing in our project so we'll only need to add the routes for our components to implement navigation in our application. If you run the ng version command inside your project's folder, you should get a similar output: Angular CLI: 9.0.0-rc.2 Node: 10.16.3 OS: win32 ia32 Angular: <error> ... animations, cli, common, compiler, compiler-cli, core, forms ... language-service, platform-browser, platform-browser-dynamic ... router Package Version --------------------------------------------------------- @angular-devkit/architect 0.900.0-rc.2 (cli-only) @angular-devkit/build-angular <error> @angular-devkit/core 9.0.0-rc.2 (cli-only) @angular-devkit/schematics 9.0.0-rc.2 (cli-only) @schematics/angular 9.0.0-rc.2 (cli-only) @schematics/update 0.900.0-rc.2 (cli-only) rxjs 6.5.3 (cli-only) typescript 3.6 Next, navigate to you project’s folder and run the local development server using the following commands: $ cd angular-httpclient-example $ ng serve A local development server will start listening on the http://localhost:4200/ address. Open your web browser and navigate to the http://localhost:4200/ address to see your app up and running. This is a screenshot at this point: You should now leave the development server running and start a new command-line interface for running the CLI commands of the next steps. In the next step, we'll learn how to create a fake JSON REST API that we'll be consuming in our Angular example application. Step 3 — Setting up a (Fake) JSON REST API Before we proceed to develop our Angular application, we'll need to prepare a JSON REST API that we can consume using HttpClient. We can also consume or fetch JSON data from third-party REST API servers but in this example, we choose to create a fake REST API. Check out this tutorial for a real REST API example. As far as Angular concerned, there is no difference between consuming fake or real REST APIs. As said, you can either use an external API service, create a real REST API server or create a fake API using json-server. In this example we'll use the last approach. So head over to a new command-line interface and start by installing json-server from npm in your project: $ cd ~/angular-httpclient-example $ npm install --save json-server Next, create a server folder in the root folder of your Angular project: $ mkdir server $ cd server In the server folder, create a database.json file and add the following JSON object: { "products": [] } This JSON file will act as a database for your REST API server. You can simply add some data to be served by your REST API or use Faker.js for automatically generating massive amounts of realistic fake data. Go back to your command-line, navigate back from the server folder, and install Faker.js from npm using the following command: $ cd .. $ npm install faker --save At the time of creating this example, faker v4.1.0 will be installed. Now, create a generate.js file and add the following code: var faker = require('faker'); var database = { products: []}; for (var i = 1; i<= 300; i++) { database.products.push({ id: i, name: faker.commerce.productName(), description: faker.lorem.sentences(), price: faker.commerce.price(), imageUrl: "https://source.unsplash.com/1600x900/?product", quantity: faker.random.number() }); } console.log(JSON.stringify(database)); We first imported faker, next we defined an object with one empty array for products. Next, we entered a for loop to create 300 fake entries using faker methods like faker.commerce.productName() for generating product names. Check all the available methods. Finally we converted the database object to a string and log it to standard output. Next, add the generate and server scripts to the package.json file: "scripts": { "ng": "ng", "start": "ng serve", "build": "ng build", "test": "ng test", "lint": "ng lint", "e2e": "ng e2e", "generate": "node ./server/generate.js > ./server/database.json", "server": "json-server --watch ./server/database.json" }, Next, head back to your command-line interface and run the generate script using the following command: $ npm run generate Finally, run the REST API server by executing the following command: $ npm run server You can now send HTTP requests to the server just like any typical REST API server. Your server will be available from the http://localhost:3000/ address. These are the API endpoints we'll be able to use via our JSON REST API server: GET /products for getting the products, GET /products/<id> for getting a single product by id, POST /products for creating a new product, PUT /products/<id> for updating a product by id, PATCH /products/<id> for partially updating a product by id, DELETE /products/<id> for deleting a product by id. You can use _page and _limit parameters to get paginated data. In the Link header you'll get first, prev, next and last links. For example: GET /products?_page=1 for getting the first page of data, GET /products?_page=1&_limit=5 for getting the first five products of the first page of data. Note: You can use other features such as filters, sorting and ordering. For more information, check out the docs. Leave the JSON REST API server running and open a new command-line interface for typing the commands of the next steps. As a summary of what we have done — We installed Angular CLI and initialized a new project based on the latest Angular 9 version. Then, we created a REST API using json-server based on a JSON file. In the next step of our Angular 9 tutorial, we'll learn how to set up HttpClient in our Angular 9 project. Step 4 — Setting up Angular 9 HttpClient in our Example Project In this step, we'll proceed to set up the HttpClient module in our example. HttpClient lives in a separate Angular module, so we'll need to import it in our main application module before we can use it. Open your example project with a code editor or IDE. I'll be using Visual Studio Code. Next, open the src/app/app.module.ts file, import HttpClientModule and add it to the imports array of the module as follows: import { BrowserModule } from '@angular/platform-browser'; import { NgModule } from '@angular/core'; import { AppRoutingModule } from './app-routing.module'; import { AppComponent } from './app.component'; import { HttpClientModule } from '@angular/common/http'; @NgModule({ declarations: [ AppComponent, ], imports: [ BrowserModule, AppRoutingModule, HttpClientModule ], providers: [], bootstrap: [AppComponent] }) export class AppModule { } That's all, we are now ready to use the HttpClient service in our project but before that we need to create a couple of components — The home and about components. This is what we'll learn to do in the next step. Step 5 — Creating Angular 9 Components In this step, we'll proceed to create the Angular components that control our application UI. Head back to a new command-line interface and run the following command: $ cd ~/angular-httpclient-example $ ng generate component home This is the output of the command: CREATE src/app/home/home.component.html (19 bytes) CREATE src/app/home/home.component.spec.ts (614 bytes) CREATE src/app/home/home.component.ts (261 bytes) CREATE src/app/home/home.component.css (0 bytes) UPDATE src/app/app.module.ts (467 bytes) The CLI created four files for the component and added it to the declarations array in the src/app/app.module.ts file. Next, let's create the about component using the following command: $ ng generate component about Next, open the src/app/about/about.component.html and add the following code: <p style="padding: 13px;"> An Angular 9 example application that demonstrates how to use HttpClient to consume REST APIs </p> We'll update the home component in the following steps. In the next step of our Angular 9 tutorial, we'll add these components to the router. Step 6 — Adding Angular 9 Routing In this step, we'll proceed to add routing to our example. Head back to the src/app/app-routing.module.ts file, that was automatically created by Angular CLI for routing configuration, and import the components then add the routes as follows: import { NgModule } from '@angular/core'; import { Routes, RouterModule } from '@angular/router'; import { HomeComponent } from './home/home.component'; import { AboutComponent } from './about/about.component'; const routes: Routes = [ { path: '', redirectTo: 'home', pathMatch: 'full'}, { path: 'home', component: HomeComponent }, { path: 'about', component: AboutComponent }, ]; @NgModule({ imports: [RouterModule.forRoot(routes)], exports: [RouterModule] }) export class AppRoutingModule { } We first imported the home and about components, next we added three routes including a route for redirecting the empty path to the home component, so when the user visits the app, they will be redirected to the home page. In the next step of our example, we'll set up Angular Material in our project for styling our UI. Step 7 — Styling the UI with Angular Material v9 In this step of our Angular 9 tutorial, we'll proceed to add Angular Material to our project and style our application UI. Angular Material provides Material Design components that allow developers to create professional UIs. Setting up Angular Material in our project is much easier now with the new ng add command of the Angular CLI v7+. Head back to your command-line interface, and run the following command from the root of your project: $ ng add @angular/material You'll be asked for choosing a theme, choose Indigo/Pink. For the other options — Set up HammerJS for gesture recognition? and Set up browser animations for Angular Material? Simply press Enter in your keyboard to choose the default answers. Next, open the src/styles.css file and add a theme: @import "~@angular/material/prebuilt-themes/indigo-pink.css"; Each Angular Material component has a separate module that you need to import before you can use the component. Open the src/app/app.module.ts file and add the following imports: import { MatToolbarModule, MatIconModule, MatCardModule, MatButtonModule, MatProgressSpinnerModule } from '@angular/material'; We imported the following modules: MatToolbar that provides a container for headers, titles, or actions. MatCard that provides a content container for text, photos, and actions in the context of a single subject. MatButton that provides a native <button> or <a> element enhanced with Material Design styling and ink ripples. MatProgressSpinner that provides a circular indicator of progress and activity. Next, you need to include these modules in the imports array: @NgModule({ declarations: [ AppComponent, HomeComponent, AboutComponent ], imports: [ BrowserModule, AppRoutingModule, HttpClientModule, BrowserAnimationsModule, MatToolbarModule, MatIconModule, MatButtonModule, MatCardModule, MatProgressSpinnerModule ], providers: [], bootstrap: [AppComponent] }) export class AppModule { } Next, open the src/app/app.component.html file and update it as follows: <mat-toolbar color="primary"> <h1> ngStore </h1> <button mat-button routerLink="/">Home</button> <button mat-button routerLink="/about">About</button> </mat-toolbar> <router-outlet></router-outlet> We created the shell of our application containing a top bar with two navigation buttons to the home and about components. As a summary of what we did until this point of our tutorial — We have setup HttpClient and Angular Material v9 in our project, created the home and about components and configured routing, and finaly added the shell of our application containing a topbar with navigation. In the next step of our tutorial, we'll learn how to fetch the JSON data from our REST API server using HttpClient v9. Step 8 — Consuming the JSON REST API with Angular HttpClient 9 In this step, we'll proceed to consume JSON data from our REST API server in our example application. We'll need to create an Angular service for encapsulating the code that deals with consuming data from the REST API server. A service is a singleton that can be injected by other services and components using the Angular dependency injection. In software engineering, dependency injection is a technique whereby one object supplies the dependencies of another object. Source Now, let’s generate an Angular service that interfaces with the JSON REST API. Head back to your command-line interface and run the following command: $ ng generate service data Next, open the src/app/data.service.ts file, import and inject HttpClient as follows: import { Injectable } from '@angular/core'; import { HttpClient } from '@angular/common/http'; @Injectable({ providedIn: 'root' }) export class DataService { private REST_API_SERVER = "http://localhost:3000"; constructor(private httpClient: HttpClient) { } } We imported and injected the HttpClient service as a private httpClient instance. We also defined the REST_API_SERVER variable that holds the address of our REST API server. Next, add a sendGetRequest() method that sends a GET request to the REST API endpoint to retrieve JSON data: import { Injectable } from '@angular/core'; import { HttpClient } from '@angular/common/http'; @Injectable({ providedIn: 'root' }) export class DataService { private REST_API_SERVER = "http://localhost:3000"; constructor(private httpClient: HttpClient) { } public sendGetRequest(){ return this.httpClient.get(this.REST_API_SERVER); } } The method simply invokes the get() method of HttpClient to send GET requests to the REST API server. Next, we now need to use this service in our home component. Open the src/app/home/home.component.ts file, import and inject the data service as follows: import { Component, OnInit } from '@angular/core'; import { DataService } from '../data.service'; @Component({ selector: 'app-home', templateUrl: './home.component.html', styleUrls: ['./home.component.css'] }) export class HomeComponent implements OnInit { products = []; constructor(private dataService: DataService) { } ngOnInit() { this.dataService.sendGetRequest().subscribe((data: any[])=>{ console.log(data); this.products = data; }) } } We imported and injected DataService as a private dataService instance via the component constructor. Next, we defined a products variable and called the sendGetRequest() method of the service for fetching data from the JSON REST API server. Since the sendGetRequest() method returns the return value of the HttpClient.get() method which is an RxJS Observable, we subscribed to the returned Observable to actually send the HTTP GET request and process the HTTP response. When data is received, we added it in the products array. Next, open the src/app/home/home.component.html file and update it as follows: <div style="padding: 13px;"> <mat-spinner *ngIf="products.length === 0"></mat-spinner> <mat-card *ngFor="let product of products" style="margin-top:10px;"> <mat-card-header> <mat-card-title>{{product.name}}</mat-card-title> <mat-card-subtitle>{{product.price}} $/ {{product.quantity}} </mat-card-subtitle> </mat-card-header> <mat-card-content> <p> {{product.description}} </p> <img style="height:100%; width: 100%;" src="{{ product.imageUrl }}" /> </mat-card-content> <mat-card-actions> <button mat-button> Buy product</button> </mat-card-actions> </mat-card> </div> We used the <mat-spinner> component for showing a loading spinner when the length of the products array equals zero i.e before no data is received from the REST API server. Next, we iterated over the products array and used a Material card to display the name, price, quantity, description and image of each product. This is a screenshot of the home page after JSON data is fetched: Next, we'll see how to add error handling to our service. Step 9 — Adding HTTP Error Handling with RxJS catchError() & HttpClient In this step, we'll proceed to add error handling in our example application. The Angular's HttpClient methods can be easily used with the catchError() operator from RxJS, since they return Observables, via the pipe() method for catching and handling errors. We simply need to define a method to handle errors within your service. There are two types of errors in front-end applications: Client-side errors such as network issues and JavaScript syntax and type errors. These errors return ErrorEvent objects. Server-side errors such as code errors in the server and database access errors. These errors return HTTP Error Responses. As such, we simply need to check if an error is an instance of ErrorEvent to get the type of the error so we can handle it appropriately. Now, let's see this by example. Open the src/app/data.service.ts file and update it accordingly: import { Injectable } from '@angular/core'; import { HttpClient, HttpErrorResponse } from "@angular/common/http"; import { throwError } from 'rxjs'; import { retry, catchError } from 'rxjs/operators'; @Injectable({ providedIn: 'root' }) export class DataService { private REST_API_SERVER = "http://localhost:3000/products"; constructor(private httpClient: HttpClient) { } handleError(error: HttpErrorResponse) { let errorMessage = 'Unknown error!'; if (error.error instanceof ErrorEvent) { // Client-side errors errorMessage = `Error: ${error.error.message}`; } else { // Server-side errors errorMessage = `Error Code: ${error.status}\nMessage: ${error.message}`; } window.alert(errorMessage); return throwError(errorMessage); } public sendGetRequest(){ return this.httpClient.get(this.REST_API_SERVER).pipe(catchError(this.handleError)); } } As you can see, this needs to be done for each service in your application which is fine for our example since it only contains one service but once your application starts growing with many services which may all throw errors you need to use better solutions instead of using the handleError method per each service which is error-prone. One solution is to handle errors globally in your Angular application using HttpClient interceptors. This is a screenshot of an error on the console if the server is unreachable: In the next step, we'll see how to improve our data service by automatically retry sending the failed HTTP requests. Step 10 — Retrying Failed HTTP Requests with RxJS retry() & HttpClient In this step of our Angular 9 tutorial, we'll see how to use the retry() operator of RxJS with HttpClient to automatically resubscribing to the returned Observable which results in resending the failed HTTP requests. In many cases, errors are temporary and due to poor network conditions so simply trying again will make them go away automatically. For example, in mobile devices network interruptions are frequent so if the user tries again, they may get a successful response. Instead of letting users manually retry, let's see how to do that automatically in our example application. The RxJS library provides several retry operators. Among them is the retry() operator which allows you to automatically re-subscribe to an RxJS Observable a specified number of times. Re-subscribing to the Observable returned from an HttpClient method has the effect of resending the HTTP request to the server so users don't need to repeat the operation or reload the application. You can use the RxJS retry() operator by piping it (using the pipe() method) onto the Observable returned from the HttpClient method before the error handler. Go to the src/app/data.service.ts file and import the retry() operator: import { retry, catchError } from 'rxjs/operators'; Next update the sendGetRequest() method as follows: public sendGetRequest(){ return this.httpClient.get(this.REST_API_SERVER).pipe(retry(3), catchError(this.handleError)); } This will retry sending the failed HTTP request three times. In the next step, we'll see how to unsubscribe from RxJS Observables in our example home component. Step 11 — Unsubscribing from HttpClient Observables with RxJS takeUntil() In this step of our Angular 9 tutorial, we'll learn about why we need and how to unsubscribe from Observables in our code using the takeUntil() operator. First of all, do you need to unsubscribe from the Observables returned by the HttpClient methods? Generally, you need to manually unsubscribe from any subscribed RxJS Observables in your Angular components to avoid memory leaks but in the case of HttpClient, this is automatically handled by Angular by unsubscribing when the HTTP response is received. However, there are some cases when you need to manually unsubscribe for example to cancel pending requests when users are about to leave the component. We can simply call the unsubscribe() method from the Subscription object returned by the subscribe() method in the ngOnDestroy() life-cycle method of the component to unsubscribe from the Observable. There is also a better way to unsubscribe from or complete Observables by using the takeUntil() operator. The takeUntil() operator emits the values emitted by the source Observable until a notifier Observable emits a value. Let's see how to use this operator to complete Observables when the component is destroyed. Check out How to cancel/unsubscribe all pending HTTP requests angular 4+. Open the src/app/home/home.component.ts file and update it as follows: import { Component, OnInit, OnDestroy } from '@angular/core'; import { DataService } from '../data.service'; import { takeUntil } from 'rxjs/operators'; import { Subject } from 'rxjs'; @Component({ selector: 'app-home', templateUrl: './home.component.html', styleUrls: ['./home.component.css'] }) export class HomeComponent implements OnInit, OnDestroy { products = []; destroy$: Subject<boolean> = new Subject<boolean>(); constructor(private dataService: DataService) { } ngOnInit() { this.dataService.sendGetRequest().pipe(takeUntil(this.destroy$)).subscribe((data: any[])=>{ console.log(data); this.products = data; }) } ngOnDestroy() { this.destroy$.next(true); // Unsubscribe from the subject this.destroy$.unsubscribe(); } } We first imported the OnDestroy interface, Subject and the takeUntil() operator. Next, we implemented the OnDestroy interface and added the ngOnDestroy() lifecycle hook to the component. Next, we created an instance of Subject which can emit boolean values (the type of the value doesn't really matter in this example) that will be used as the notifier of the takeUntil() operator. Next, in the ngOnInit() lifecycle hook, we called the sendGetRequest() of our data service and called the pipe() method of the returned Observable to pipe the takeUnitl() operator and finaly subscribed to the combined Observable. In the body of the subscribe() method, we added the logic to put the fetched data of the HTTP response in the products array. The takeUntil() operator allows a notified Observable to emit values until a value is emitted from a notifier Observable. When Angular destroys a component it calls the ngOnDestroy() lifecycle method which, in our case, calls the next() method to emit a value so RxJS completes all subscribed Observables. That's it. In this step, we have added the logic to cancel any pending HTTP request by unsubscribing from the returned Observable in case the user descides to navigate away from the component before the HTTP response is received. In the next step of our Angular 9 tutorial, we'll see how to use URL query parameters with the get() method of HttpClient. Step 12 — Adding URL Query Parameters to the HttpClient get() Method In this step, we'll start adding the logic for implementing pagination in our example application. We'll see how to use URL query parameters via fromString and HttpParams to provide the appropriate values for the the _page and _limit parameters of the /products endpoint of our JSON REST API server for getting paginated data. Open the src/app/data.service.ts file and start by adding the following the import for HttpParams: import { HttpClient, HttpErrorResponse, HttpParams } from "@angular/common/http"; Next, update the sendGetRequest() method as follows: public sendGetRequest(){ // Add safe, URL encoded_page parameter const options = { params: new HttpParams({fromString: "_page=1&_limit=20"}) }; return this.httpClient.get(this.REST_API_SERVER, options).pipe(retry(3), catchError(this.handleError)); } We used HttpParams and fromString to create HTTP query parameters from the _page=1&_limit=20 string. This tells to returns the first page of 20 products. Now the sendGetRequest() will be used to retrieve the first page of data. The received HTTP response will contain a Link header with information about the first, previous, next and last links of data pages. In the Link header you’ll get first, prev, next and last links. In the next step, we'll see how to extract these pagination links by parsing full HTTP responses. Step 13 — Getting the Full HTTP Response with Angular HttpClient 9 In this ste, we'll proceed by implementing the logic for retrieving pagination information from the Link header contained in the HTTP response received from the JSON REST API server. By default, HttpClient does only provide the response body but in our case we need to parse the Link header for pagination links so we need to tell HttpClient that we want the full HttpResponse using the observe option. The Link header in HTTP allows the server to point an interested client to another resource containing metadata about the requested resource.Wikipedia Go to the src/app/data.service.ts file and import the RxJS tap() operator: import { retry, catchError, tap } from 'rxjs/operators'; Next, define the following string variables: public first: string = ""; public prev: string = ""; public next: string = ""; public last: string = ""; Next, define the parseLinkHeader() method which parses the Link header and populate the previous variables accordingly: parseLinkHeader(header) { if (header.length == 0) { return ; } let parts = header.split(','); var links = {}; parts.forEach( p => { let section = p.split(';'); var url = section[0].replace(/<(.*)>/, '$1').trim(); var name = section[1].replace(/rel="(.*)"/, '$1').trim(); links[name] = url; }); this.first = links["first"]; this.last = links["last"]; this.prev = links["prev"]; this.next = links["next"]; } Next, update the sendGetRequest() as follows: public sendGetRequest(){ // Add safe, URL encoded _page and _limit parameters return this.httpClient.get(this.REST_API_SERVER, { params: new HttpParams({fromString: "_page=1&_limit=20"}), observe: "response"}).pipe(retry(3), catchError(this.handleError), tap(res => { console.log(res.headers.get('Link')); this.parseLinkHeader(res.headers.get('Link')); })); } We added the observe option with the response value in the options parameter of the get() method so we can have the full HTTP response with headers. Next, we use the RxJS tap() operator for parsing the Link header before returning the final Observable. Since the sendGetRequest() is now returning an Observable with a full HTTP response, we need to update the home component so open the src/app/home/home.component.ts file and import HttpResponse as follows: import { HttpResponse } from '@angular/common/http'; Next, update the subscribe() method as follows: ngOnInit() { this.dataService.sendGetRequest().pipe(takeUntil(this.destroy$)).subscribe((res: HttpResponse<any>)=>{ console.log(res); this.products = res.body; }) } We can now access the data from the body object of the received HTTP response. Next, go back to the src/app/data.service.ts file and add the following method: public sendGetRequestToUrl(url: string){ return this.httpClient.get(url, { observe: "response"}).pipe(retry(3), catchError(this.handleError), tap(res => { console.log(res.headers.get('Link')); this.parseLinkHeader(res.headers.get('Link')); })); } This method is similar to sendGetRequest() except that it takes the URL to which we need to send an HTTP GET request. Go back to the src/app/home/home.component.ts file and add define the following methods: public firstPage() { this.products = []; this.dataService.sendGetRequestToUrl(this.dataService.first).pipe(takeUntil(this.destroy$)).subscribe((res: HttpResponse<any>) => { console.log(res); this.products = res.body; }) } public previousPage() { if (this.dataService.prev !== undefined && this.dataService.prev !== '') { this.products = []; this.dataService.sendGetRequestToUrl(this.dataService.prev).pipe(takeUntil(this.destroy$)).subscribe((res: HttpResponse<any>) => { console.log(res); this.products = res.body; }) } } public nextPage() { if (this.dataService.next !== undefined && this.dataService.next !== '') { this.products = []; this.dataService.sendGetRequestToUrl(this.dataService.next).pipe(takeUntil(this.destroy$)).subscribe((res: HttpResponse<any>) => { console.log(res); this.products = res.body; }) } } public lastPage() { this.products = []; this.dataService.sendGetRequestToUrl(this.dataService.last).pipe(takeUntil(this.destroy$)).subscribe((res: HttpResponse<any>) => { console.log(res); this.products = res.body; }) } Finally, add open the src/app/home/home.component.html file and update the template as follows: <div style="padding: 13px;"> <mat-spinner *ngIf="products.length === 0"></mat-spinner> <mat-card *ngFor="let product of products" style="margin-top:10px;"> <mat-card-header> <mat-card-title>#{{product.id}} {{product.name}}</mat-card-title> <mat-card-subtitle>{{product.price}} $/ {{product.quantity}} </mat-card-subtitle> </mat-card-header> <mat-card-content> <p> {{product.description}} </p> <img style="height:100%; width: 100%;" src="{{ product.imageUrl }}" /> </mat-card-content> <mat-card-actions> <button mat-button> Buy product</button> </mat-card-actions> </mat-card> </div> <div> <button (click) ="firstPage()" mat-button> First</button> <button (click) ="previousPage()" mat-button> Previous</button> <button (click) ="nextPage()" mat-button> Next</button> <button (click) ="lastPage()" mat-button> Last</button> </div> This is a screenshot of our application: Step 14 — Requesting a Typed HTTP Response with Angular HttpClient 9 In this step, we'll see how to use typed HTTP responses in our example application. Angular HttpClient allows you to specify the type of the response object in the request object, which make consuming the response easier and straightforward. This also enables type assertion during the compile time. Let's start by defining a custom type using a TypeScript interface with the required properties. Head back to your command-line interface and run the following command from the root of your project: $ ng generate interface product Next, open the src/app/product.ts file and update it as follows: export interface Product { id: number; name: string; description: string; price: number; quantity: number; imageUrl: string; } Next, specify the Product interface as the HttpClient.get() call's type parameter in the data service. Go back to the src/app/data.service.ts file and import the Product interface: import { Product } from './product'; Next: public sendGetRequest(){ return this.httpClient.get<Product[]>(this.REST_API_SERVER, { params: new HttpParams({fromString: "_page=1&_limit=20"}), observe: "response"}).pipe(retry(3), catchError(this.handleError), tap(res => { console.log(res.headers.get('Link')); this.parseLinkHeader(res.headers.get('Link')); })); } public sendGetRequestToUrl(url: string){ return this.httpClient.get<Product[]>(url, { observe: "response"}).pipe(retry(3), catchError(this.handleError), tap(res => { console.log(res.headers.get('Link')); this.parseLinkHeader(res.headers.get('Link')); })); } Next, open the src/app/home/home.component.ts file and import the Product interface: import { Product } from '../product'; Next change the type of the products array as follows: export class HomeComponent implements OnInit, OnDestroy { products: Product[] = []; Next chnage the type of the HTTP response in the sendGetRequest() call: ngOnInit() { this.dataService.sendGetRequest().pipe(takeUntil(this.destroy$)).subscribe((res: HttpResponse<Product[]>) => { console.log(res); this.products = res.body; }) } You also need to do the same for the other firstPage(), previousPage(), nextPage() and lastPage() methods. Step 15 — Building and Deploying your Angular 9 Application to Firebase Hosting In this step, we'll see how to build and deploy our example application to Firebase hosting using the ng deploy command available in Angular 8.3+. We'll only see how to deploy the frontend application without the fake JSON server. Angular CLI 8.3+ introduced a new ng deploy command that makes it more easier than before to deploy your Angular application using the deploy CLI builder assocaited with your project. There are many third-party builders that implement deployment capabilities for different platforms. You can add any of them to your project by running the ng add command. After adding a deployment package it will automatically update your workspace configuration (i.e the angular.json file) with a deploy section for the selected project. You can then use the ng deploy command to deploy that project. Let's now see that by example by deploying our project to Firebase hosting. Head back to your command-line interface, make sure you are inside the root folder of your Angular project and run the following command: $ ng add @angular/fire This will add the Firebase deployment capability to your project. The command will also update the package.json of our project by adding this section: "deploy": { "builder": "@angular/fire:deploy", "options": {} } The CLI will prompt you to Paste authorization code here: and will open your default web browser and ask you to give Firebase CLI permissions to administer your Firebase account: After you signin with the Google account associated with your Firebase account, you'll be given the authorization code: Next, you'll be prompted: Please select a project: (Use arrow keys or type to search). You should have created a Firebase project before. The CLI will create the firebase.json and .firebaserc files and update the angular.json file accordingly. Next, deploy your application to Firebase, using the following command: $ ng deploy The command will produce an optimized build of your application (equivalent to the ng deploy --prod command), it will upload the production assets to Firebase hosting. Conclusion Throughout this Angular 9 tutorial, we've built a complete working Angular application example using the latest version. As a recap, we've particularly seen by example how to set up HttpClient and send HTTP GET requests with parameters using the HttpClient.get() method, how to handle HTTP errors using the RxJS throwError() and catchError() operators, unsubscribe from RxJS Observables for the cancelled HTTP requests using the takeUntil() operator and retry failed requests with the retry() operator and finally how to deploy our application to Firebase hosting using the latest ng deploy feature available from Angular 8.3+.

Angular 9 CRUD Tutorial: Consume a Python/Django CRUD REST API

$
0
0
Angular 9 is in pre-release! Read about its new features in this article and how to update to the latest Angular version in this article. You can also get our Angular 8 book for free or pay what you can. This tutorial is designed for developers that want to use Angular 9 to build front-end apps for their back-end REST APIs. You can either use Python & Django as the backend or use JSON-Server to mock the API if you don't want to deal with Python. We'll be showing both ways in this tutorial. Check out the other parts of this tutorial: Adding Routing Building Navigation UI Using Angular Material 8 This tutorial deals with REST APIs and routing but you can also start with basic concepts by following this tutorial (part 1 and part 2) instead which you'll build a simple calculator. If you would like to consume a third-party REST API instead of building your own API, make to check out this tutorial. You will see by example how to build a CRUD REST API with Python. The new features of Angular 9 include better performance and smaller bundles thanks to Ivy. Throughout this tutorial, designed for beginners, you'll learn Angular by example by building a full-stack CRUD — Create, Read, Update and Delete — web application using the latest version of the most popular framework and platform for building mobile and desktop client side applications (also called SPAs or Single Page Applications), created and used internally by Google. In the back-end we'll use Python with Django, the most popular pythonic web framework designed for perfectionists with deadlines. In nutshell, you'll learn to generate apps, components and services and add routing. You'll also learn to use various features such as HttpClient for sending AJAX requests and HTTP calls and subscribing to RxJS 6 Observables etc. By the end of this tutorial, you'll learn by building a real world example application: How to install the latest version of the CLI, How to use the CLI to generate a new Angular 9 project, How to build a simple CRM application, What's a component and component-based architecture How to use RxJS 6 Observables and operators (map() and filter() etc.) How to create components, How to add component routing and navigation, How to use HttpClient to consume a REST API etc. Prerequisites You will need to have the following prerequisites in order to follow this tutorial: A Python development environment. We use a Ubuntu system with Python 3.7 and pip installed but you can follow these instructions in a different system as long as you have Python 3 and pip installed. Also the commands shown here are bash commands which are available in Linux-based systems and macOS but if you use Windows CMD or Powershell , make sure to use the equivalent commands or install bash for Windows. Node.js and npm installed on your system. They are required by Angular CLI. Familiarity with TypeScript. If you have these requirements, you are good to go! Getting & Running the Python REST API Server We'll be using a Python REST API that we have created in this tutorial. Go ahead and clone the project's code from GitHub using the following command: $ git clone https://github.com/techiediaries/python-django-crm-rest-api.git Next, create and activate a virtual environment: $ python3 -m venv .env $ source .env/bin/activate Next, navigate to your CRM project and install the requirements using pip: $ cd python-django-crm-rest-api $ pip install -r requirements.txt Finally, you can run the development server using the following command: $ python manage.py runserver Your REST API will be available from the http://localhost:8000/ address with CORS enabled. Mocking the Same REST API with json-server If you don't want to use a real Python & Django REST API server, you can also use json-server to quickly mock the REST API. First, let's install json-server in our system using the following command: $ npm install -g json-server Next, create a folder for your server and create a JSON file (data.json) with the following content: { "users":[ { "id": 1, "first_name": "Robert", "last_name": "Schwartz", "email": "admin@email.com" } ], "accounts": [ { "id": 1, "name": "", "email":"", "phone": "", "industry": "", "website": "", "description": "", "createdBy": 1, "createdAt": "", "isActive": true } ], "contacts": [ { "id": 1, "first_name": "", "last_name": "", "account": 1, "status":1, "source": 1, "email": "", "phone": "", "address": "", "description": "", "createdBy": 1, "createdAt": "", "isActive": true } ], "activities": [ { "id": 1, "description": "", "createdAt" : "", "contact": 1, "status": 1 } ], "contactsources": [ { "id":1, "source": "" } ], "contactstatuses": [ { "id":1, "status": "" } ], "activitystatuses":[ { "id":1, "status": "" } ] } We added empty entries for JSON data. Feel free to add your own data or use a tool like Faker.js to automatically generate fake data. Next, you need to start the JSON server using: $ json-server --watch data.json Your REST API server will be running at http://localhost:3000. We'll have the following resources exposed: http://localhost:3000/users http://localhost:3000/accounts http://localhost:3000/contacts http://localhost:3000/activities http://localhost:3000/contactsources http://localhost:3000/contactstatuses http://localhost:3000/activitystatuses This is nearly the same REST API exposed by our real Python REST API server. The example Angular application we'll be building is the front-end for the CRM RESTful API that will allow you to create accounts, contacts and activities. It's a perfect example for a CRUD (Create, Read, Update and Delete) application built as an SPA (Single Page Application). The example application is work on progress so we'll be building it through a series of tutorials and will be updated to contain advanced features such as RxJS and JWT authentication. Installing the Angular CLI 9 Make sure you have Node.js installed, next run the following command in your terminal to install Angular CLI 9: $ npm install @angular/cli@next --global At the time of this writing @angular/cli v9.0.0-rc will be installed. Before the final release of Angular 9, you will need to use the @next tag to install the pre-release version. You can check the installed version by running the following command: $ ng version Now, you're ready to create a project using Angular CLI 9. Simply run the following command in your terminal: ng new ngsimplecrm The CLI will automatically generate a bunch of files common to most Angular projects and install the required dependencies for your project. The CLI will prompt you if Would you like to add Angular routing? (y/N), type y. And Which stylesheet format would you like to use? Choose CSS and type Enter. Next, you can serve your application locally using the following commands: $ cd ./ngsimplecrm $ ng serve The command will compile our project and finally will display the ** Angular Live Development Server is listening on localhost:4200, open your browser on http://localhost:4200/ ** ℹ 「wdm」: Compiled successfully. message. This means, your application is running at http://localhost:4200. What's a Component? A component is a TypeScript class with an HTML template and an optional set of CSS styles that control a part of the screen. Components are the most important concept in Angular. An Angular application is basically a tree of components with a root component (the famous AppComponent). The root component is the one contained in the bootstrap array in the main NgModule module defined in the app.module.ts file. One important aspect of components is re-usability. A component can be re-used throughout the application and even in other applications. Common and repeatable code that performs a certain task can be encapsulated into a re-usable component that can be called whenever we need the functionality it provides. Each bootstrapped component is the base of its own tree of components. Inserting a bootstrapped component usually triggers a cascade of component creations that fill out that tree. source What's a Component-Based Architecture? An Angular application is made of several components forming a tree structure with parent and child components. A component is an independent block of a big system (web application) that communicates with the other building blocks (components) of the system using inputs and outputs. A component has an associated view, data and behavior and may have parent and child components. Components allow maximum re-usability, easy testing, maintenance and separation of concerns. Let's now see this practically. Head over to your Angular project folder and open the src/app folder. You will find the following files: app.component.css: the CSS file for the component app.component.html: the HTML view for the component app.component.spec.ts: the unit tests or spec file for the component app.component.ts: the component code (data and behavior) app.module.ts: the application main module Except for the last file which contains the declaration of the application main (root) Module, all these files are used to create a component. It's the AppComponent: The root component of our application. All other components we are going to create next will be direct or un-direct children of the root component. Demystifying the App Component Go ahead and open the src/app/app.component.ts file and let's understand the code behind the root component of the application. First, this is the code: import { Component } from '@angular/core'; @Component({ selector: 'app-root', templateUrl: './app.component.html', styleUrls: ['./app.component.css'] }) export class AppComponent { title = 'app'; } We first import the Component decorator from @angular/core then we use it to decorate the TypeScript class AppComponent. The Component decorator takes an object with many parameters such as: selector: specifies the tag that can be used to call this component in HTML templates just like the standard HTML tags templateUrl: indicates the path of the HTML template that will be used to display this component (you can also use the template parameter to include the template inline as a string) styleUrls: specifies an array of URLs for CSS style-sheets for the component The export keyword is used to export the component so that it can be imported from other components and modules in the application. The title variable is a member variable that holds the string 'app'. There is nothing special about this variable and it's not a part of the canonical definition of an Angular component. Now let's see the corresponding template for this component. If you open src/app/app.component.html this is what you'll find: <div style="text-align:center"> <h1> Welcome to ! </h1> <img width="300" alt="Angular Logo" src="data:image/svg+xml;...."> </div> <h2>Here are some links to help you start: </h2> <ul> <li> <h2><a target="_blank" rel="noopener" href="https://angular.io/tutorial">Tour of Heroes</a></h2> </li> <li> <h2><a target="_blank" rel="noopener" href="https://github.com/angular/angular-cli/wiki">CLI Documentation</a></h2> </li> <li> <h2><a target="_blank" rel="noopener" href="https://blog.angular.io/">Angular blog</a></h2> </li> </ul> The template is a normal HTML file (almost all HTML tags are valid to be used inside Angular templates except for some tags such as <script>, <html> and <body>) with the exception that it can contain template variables (in this case the title variable) or expressions (``) that can be used to insert values in the DOM dynamically. This is called interpolation or data binding. You can find more information about templates from the docs. You can also use other components directly inside Angular templates (via the selector property) just like normal HTML. Note: If you are familiar with the MVC (Model View Controller) pattern, the component class plays the role of the Controller and the HTML template plays the role of the View. Components by Example After getting the theory behind Angular components, let's now create the components for our simple CRM application. Our REST API, built either with Django or JSON-Server, exposes these endpoints: /accounts: create or read a paginated list of accounts /accounts/<id>: read, update or delete an account /contacts: create or read a paginated list of contacts /contacts/<id>: read, update or delete a contact /activities: create or read a paginated list of activities /activities/<id>: read, update or delete an activity /contactstatuses: create or read a paginated list of contact statuses /activitystatuses: create or read a paginated list of activity statuses /contactsources: create or read a paginated list of contact sources Before adding routing to our application, we first need to create the application components - so based on the exposed REST API architecture we can initially divide our application into these components: AccountListComponent: this component displays and controls a tabular list of accounts AccountCreateComponent: this component displays and controls a form for creating or updating accounts ContactListComponent: displays a table of contacts ContactCreateComponent: displays a form to create or update a contact ActivityListComponent: displays a table of activities ActivityCreateComponent: displays a form to create or update an activity Let's use the Angular CLI to create the components. Open a new terminal and run the following commands: $ ng generate component AccountList $ ng generate component AccountCreate $ ng generate component ContactList $ ng generate component ContactCreate $ ng generate component ActivityList $ ng generate component ActivityCreate This is the output of the first command: CREATE src/app/account-list/account-list.component.css (0 bytes) CREATE src/app/account-list/account-list.component.html (31 bytes) CREATE src/app/account-list/account-list.component.spec.ts (664 bytes) CREATE src/app/account-list/account-list.component.ts (292 bytes) UPDATE src/app/app.module.ts (418 bytes) You can see that the command generates all the files to define a component and also updates src/app/app.module.ts to include the component. If you open src/app/app.module.ts after running all commands, you can see that all components are automatically added to the AppModule declarations array: import { BrowserModule } from '@angular/platform-browser'; import { NgModule } from '@angular/core'; import { AppComponent } from './app.component'; import { AccountListComponent } from './account-list/account-list.component'; import { AccountCreateComponent } from './account-create/account-create.component'; import { ContactListComponent } from './contact-list/contact-list.component'; import { ContactCreateComponent } from './contact-create/contact-create.component'; @NgModule({ declarations: [ AppComponent, AccountListComponent, AccountCreateComponent, ContactListComponent, ContactCreateComponent, ActivityListComponent, ActivityCreateComponent ], imports: [ BrowserModule ], providers: [], bootstrap: [AppComponent] }) export class AppModule { } Note: If you are creating components manually, you need to make sure to include them manually so they can be recognized as part of the module. Setting up HttpClient Now that we've created the various components, let's set up HttpClient in our Angular 9 project to consume the RESTful API back-end. You simply need to add HttpClientModule to the imports array of the main application module: // [...] import { HttpClientModule } from '@angular/common/http'; @NgModule({ declarations: [ // [...] ], imports: [ // [...] HttpClientModule ], providers: [], bootstrap: [AppComponent] }) export class AppModule { } We can now use HttpClient in our application. Create Services A service is a global class that can be injected in any component. It's used to encapsulate code that can be common between multiple components in one place instead of repeating it throughout various components. Now, let's create the services that encapsulates all the code needed for interacting with the REST API. Using Angular CLI 8 run the following commands: $ ng generate service services/contact $ ng generate service services/activity $ ng generate service services/account Note: Since we have multiple services, we can put them in a services folder or whatever you want to call it. Injecting HttpClient in the Services Open the src/app/services/contact.service.ts file then import and inject HttpClient: import { Injectable } from '@angular/core'; import { HttpClient } from '@angular/common/http'; @Injectable({ providedIn: 'root' }) export class ContactService { constructor(private httpClient: HttpClient) {} } Note: You will need to do the same for the other services. Angular provides a way to register services/providers directly in the @Injectable() decorator by using the new providedIn attribute. This attribute accepts any module of your application or 'root' for the main app module. Now you don't have to include your service in the providers array of your module. Conclusion Throughout this tutorial for beginners, we've seen, by building a simple real world CRUD example, how to use different Angular 9 concepts to create simple full-stack CRUD application. In the next tutorial we'll be learning how to add routing to our example application.

FOSDEM MySQL, MariaDB and Friends 2020 Schedule

$
0
0

As always, the MySQL, MariaDB and Friends devroom received far more high-quality submissions than we could fit in. The committee, consisting of Marco Tusa (Percona), Kenny Gryp (MySQL), Vicențiu Ciorbaru (MariaDB Foundation), Matthias Crauwels (Pythian), Giuseppe Maxia (Community), Federico Razzoli (Community) and Øystein Grøvlen (Alibaba/Community) had the task of reducing 75 submissions into the final 17.

The following sessions were selected:

Session Speaker Start End
Welcome Frédéric Descamps and Ian Gilfillan 10h30 10h40
MySQL 8 vs MariaDB 10.4 Peter Zaitsev 10h40 11h00
MyRocks in the Wild Wild West! Alkin 11h10 11h30
How Safe is Asynchronous Master-Master Setup? Sveta Smirnova 11h40 12h00
The consequences of sync_binlog != 1. Jean-François Gagné 12h10 12h30
Overview of encryption features Hrvoje Matijakovic 12h40 13h00
Whats new in ProxySQL 2.0? – Exploring the latest
features in ProxySQL 2.0
Nick Vyzas 13h10 13h30
SELinux fun with MySQL and friends Matthias Crauwels & Ivan Groenewold 13h40 14h00
Running MySQL in Kubernetes in real life Sami Ahlroos 14h10 14h30
ALTER TABLE improvements in MariaDB Server –
Optimized or instantaneous schema changes,
including ADD/DROP COLUMN
Marko Mäkelä 14h40 15h00
Rewinding time with System Versioned Tables Sergei Golubchik 15h10 15h30
Knocking down the barriers of ORDER BY LIMIT
queries with MariaDB 10.5
VARUN GUPTA 15h40 16h00
CPU performance analysis for MySQL using
Hot/Cold Flame Graph
Vinicius Grippa 16h10 16h30
Hash Join in MySQL 8 Erik Frøseth 16h40 17h00
Comparing Hash Join solution, the good, the bad
and the worse.
Marco (the Grinch) Tusa 17h10 17h30
MySQL 8.0: Secure your MySQL Replication
Deployment
Pedro Figueiredo 17h40 18h00
Automating schema migration flow with GitHub
Actions, skeema & gh-ost – And end-to-end schema
migration automation, from design to production, at
GitHub
Shlomi Noach 18h10 18h30
20 mins to write a MySQL Shell Plugin – Extend the
MySQL Shell with a plugin created from scratch
Frédéric Descamps 18h40 19h00

All sessions will be taking place in H.2214 on Saturday 2 February. There will be five minutes for questions between each session.

Please check closer to the time for any schedule changes. Look forward to seeing you there!

NDB Parallel Query, part 3

$
0
0
In the previous part we showed how NDB will parallelise a simple
2-way join query from TPC-H. In this part we will describe how
the pushdown of joins to a storage engine works in the MySQL Server.

First a quick introduction to how a SQL engine handles a query.
The query normally goes through 5 different phases:
1) Receive query on the client connection
2) Query parsing
3) Query optimisation
4) Query execution
5) Send result of query on client connection

The result of 1) is a text string that contains the SQL query to
execute. In this simplistic view of the SQL engine we will ignore
any such things as prepared statements and other things making the
model more complex.

The text string is parsed by 2) into a data structure that represents
the query in objects that match concepts in the SQL engine.

Query optimisation takes this data structure as input and creates a
new data structure that contains an executable query plan.

Query execution uses the data structure from the query optimisation
phase to execute the query.

Query execution produces a set of result rows that is sent back to the
client.

In the MySQL Server those phases isn't completely sequential, there are
many different optimisations that occurs in all phases. However for this
description it is accurate enough.

When we started working on the plan to develop a way to allow the storage
engine to take over parts of the query, we concluded that the storage
engine should use an Abstract Query Plan of some sort.

We decided early on to only push joins down after the query optimisation
phase. There could be some additional benefits of this, but the project
was sufficiently complex to handle anyways.

We see how the pushdown of a join into the storage engine happens:


As can be seen the storage engine receives the Query Plan as input and
produces a modified query plan as output. In addition the storage engine
creates an internal plan for how to execute the query internally.

NDB is involved in the Query Optimisation phase in the normal manner handled
by the MySQL Server. This means that NDB has to keep index statistics up to
date. A new feature can also be used to improve the cost model in MySQL 8.0.
This is to generate histograms on individual columns, this feature works per
MySQL Server and is generated by an SQL command. We will show a few examples
later on how this can be used to improve performance of queries.

MySQL uses a cost model, and this cost model works fairly well for NDB as well
even though NDB is a distributed storage engine. There is some improvements
possible in the exactness of the NDB index statistics, but the model as such
works well enough.

Examples of ways to change the query plan is when we push a condition
to the storage engine, in this case the query condition can be removed
from the query plan used by the MySQL Server. The internal query plan
contains information of join order, pushed conditions, linked reads
from a table earlier in the join order to a later table in the join
order. Some parts of the internal query execution can be modified as
the query is executed. Examples of such things is the parallelism used
in the query. This can be optimised to make optimal use of the server
resources (CPU, memory, disks and networks).

The storage engine can select to handle the join partially or fully.
Taking care of a pushdown partially can be down both on condition level
as well as on a table level.

So as an example if we have a condition that cannot be pushed to NDB, this
condition will not be pushed, but the table can still be pushed to NDB.
If we have a 6-way join and the third table in the join for some reason
cannot be pushed to NDB, then we can still push the join of the first two
tables, the result of those two tables joined is then joined inside the
MySQL server and finally the results are fed into the last 3-way join that
is also pushed to NDB.

One common case where a query can be pushed in multiple steps into NDB is
when the query contains a subquery. We will look into such an example
in a later blog.

So in conclusion the join pushdown works by first allowing the MySQL Server
to create an optimal execution plan. Next we attempt to push as many parts
down to the NDB storage engine as possible.

The idea with the pushdown is to be able to get more batching happening.
For example if we have a key lookup in one of the tables in the join it is not
possible to handle more than one row at a time using the MySQL Server whereas
with pushdown we can handle hundreds of key lookups in parallel.

Another reason is that by moving the join operator into the data node we come
closer to the data. This avoids a number of messages back and forth between the
MySQL Server and the data nodes.

Finally by moving the join operator down into the data nodes we can even have
multiple join operators. This can be used  also for other things than the join operator
in the future such as aggregation, sorting and so forth.

An alternative approach would be to push the entire query down to NDB when it
works. The NDB model with join pushdown of full or partial parts of the
queries however works very well for the NDB team. We are thus able to develop
improvements of the join pushdown in a stepwise approach and even without being
able to push the full query we can still improve the query substantially.

As an example Q12 was not completely pushed before MySQL Cluster 8.0.18. Still
pushing only parts of it made a speedup of 20x possible, when the final step
of comparing two columns was added in 8.0.18 the full improvement of 40x
was made possible.

Next part
.........
In the next part we will describe how NDB handle batches, this has an important
impact on the possible parallelism in query execution.

Upgrading from MySQL 5.7 to 8.0 on Windows

$
0
0

As you may know, I’m using MySQL exclusively on GNU/Linux. To be honest for me it’s almos 20 years that the year of Linux on the desktop happened. And I’m very happy with that.

But this week-end, I got a comment on an previous post about upgrading to MySQL 8.0, asking how to proceed on Windows. And in fact, I had no idea !

So I spent some time to install a Windows VM and for the very first time, MySQL on Windows !

The goal was to describe how to upgrade from MySQL 5.7 to MySQL 8.0.

So once MySQL 5.7 was installed (using MySQL Installer), I created some data using MySQL Shell:

Of course I used latest MySQL Shell, 8.0.18 in this case. Don’t forget that if you are using MySQL Shell or MySQL Router, you must always use the latest 8.0 version even with MySQL 5.7.

Before upgrading, I ran MySQL Upgrade Checker to be sure everything is compatible with MySQL 8.0:

No problem, I’m good to go !

Don’t forget, now it’s the right time to perform a backup or a snapshot.

The first step is to stop the MySQL Service:

When done, you have to launch once again the MySQL Installer and use Modify your MySQL 5.7 Server product features to only leave the Sever data files checked:

When all is proceeded, you return to the MySQL Installer Product Overview and you Add a new product:

We select the latest MySQL 8.0 and there is no need to select Server data files, as we will upgrade our current data:

When is done, please stop the new MySQL80 service and modify the my.ini (of MySQL 8.0!) that is located in System\ProgramData\MySQL\MySQL Server 8.0 by default:

In that file, we modify the actual value of datadir and we point it to where was located the datadir of MySQL 5.7. In this example I only used the default values:

And now it’s the most tricky part of the upgrade process, when you save this file, you must specified the ANSI encoding:

If you don’t use the right encoding, when you will start the MySQL Service, in the error log you will have a message like this: [ERROR] Found option without preceding group in config file ... at line 1

When saved, you can start the service. It will take some times as MySQL will proceed to the upgrade of the system tables and other files as you can see in the error log:

When the service is running again, you can connect and you should have access to all the data that was in you previous MySQL 5.7:

As you can see the test schema is there and of course we can check the content too:

I hope this post answers the questions of those that were experiencing issues when trying to perform an in-place upgrade from MySQL 5.7 to MySQL 8.0 in Microsoft Windows.

Tungsten Clustering Makes The 2020 DBTA Top Trending Products List

$
0
0

We’re delighted to be able to share that Tungsten Clustering – our flagship product – is named in the DBTA 2020 List of Trend Setting Products!

Congratulations to all the products and their teams that were named in the 2020 list.

We have been at the forefront of the market need since 2004 with our solutions for platform agnostic, highly available, globally scaling, clustered MySQL databases that are driving businesses to the cloud (whether hybrid or not) today; and our software solutions are the expression of that.

Tungsten Clustering allows enterprises running business-critical MySQL database applications to cost-effectively achieve continuous operations with commercial-grade high availability (HA), geographically redundant disaster recovery (DR) and global scaling.

Tungsten Clustering makes it simple to:

  • Create MySQL database clusters in the cloud or in your private data center
  • Keep the data available even when systems fail
  • Free you up to focus on your business and applications

Its key benefits include:

  • Continuous MySQL Operations
  • Zero Downtime MySQL
  • Geo-Scale MySQL
  • Hybrid-Cloud and Multi-Cloud MySQL
  • Intelligent MySQL Proxy
  • Most Advanced MySQL Replication
  • Full MySQL Support, No Application Changes

Tungsten Clustering comes with industry-best, 24/7 MySQL support services to ensure continuous client operations.

Our customers are leading SaaS, e-commerce, financial services, gaming and telco companies who rely on MySQL and Continuent to cost-effectively safeguard billions of dollars in annual revenue. They include Adobe, Carfax, CoreLogic, F-Secure, Garmin, Marketo, Modernizing Medicine, Motorola, NewVoiceMedia, RingCentral, Riot Games, VMware and more.

To find out more, visit our Tungsten Clustering page or to contact us.

NDB Parallel Query, part 4

$
0
0
In this part we will discuss how NDB batch handling works. Query execution of
complex SQL queries means that more rows can be delivered than the receiver is
capable of receiving. This means that we need to create a data flow from the
producer where the data resides and the query executor in the MySQL Server.

The MySQL Server uses a record where the storage engine have to copy the result
row into the record. This means that the storage of batches of rows is taken
care of by the storage engine.

When NDB performs a range scan it will decide on the possible parallelism before
the scan is started. The NDB API have to allocate enough memory to ensure that
we have memory prepared to receive the rows as they arrive in a flow of result
rows from the data nodes. It is possible to set batch size of hundreds and even
thousands of rows for a query.

The executor of the scan is the DBTC module in the TC threads. This module only
passes message through and sends them to the proper place. There is no storage
of result rows in DBTC. There is only one TC thread involved in one scan (range
scan or full table scan). The TC thread will decide on which modules that should
handle each individual fragment scan. The message to scan contains a set of
references to the memory available in the NDB API. This set of references is in
turn distributed to the fragment scans. This means that these can send result
rows directly to the NDB API.

When a fragment scan has completed sending rows for all memory references it
cannot continue until the NDB API has processed these rows. The fragment
scan handled by the DBLQH module in the LDM threads will send information
to the DBTC module that it waits for a continue request. The DBTC module will
ensure that the NDB API knows that it should receive a set of rows as specified in
the response to the NDB API.

As soon as the NDB API have processed the set of rows it will inform the DBTC
module that it is now ready to receive more rows. Since there are multiple fragment
scans it is possible that rows have been continously received in the NDB API while
it was processing the rows received previously.

As can be seen in the above description the fragment scans will not be actively
performing the scans all the time. It would be possible to scan in the DBLQH
module and store the result row locally there until the continue request arrives.
This is not done currently, it would obviously increase the parallelism for a
specific scan, but at the same time it would also increase the overhead for the
scan.

When we execute the special scans that execute joins in NDB in the DBSPJ module
we also have batches to handle. The NDB API will allocate memory for a set of
rows on each table, thus the total batch size is can become quite high. It is
however limited to a maximum of 4096 rows per table.

When DBSPJ concludes a batch towards the NDB API it will wait for the NDB API to
process those rows. However other DBSPJ modules working on other parts of the
query can continue the join processing. Actually the NDB API has setup enough
memory to receive 2 batch sets, this means that DBSPJ can continue on the next set
of rows even before the NDB API has processed the rows. This is another reason why
Q12 can execute faster than Q6 although it has more work to perform.

At the moment result rows are sent immediately from the DBLQH module as part of
the fragment scans (or key lookups). This means that we will process rows in the
NDB API that are not really needed to be handled there. It is not an inefficiency
since if not done by the NDB API the work has to be done by DBSPJ instead. But
we can increase parallelism by handling this in DBSPJ.

This possible increased parallelism comes from two things. First not sending
unnecessary rows to the NDB API means that we have to wait less time for the
NDB API to process rows. Additionally by storing rows in the DBSPJ module we
can increase the parallelism by using more memory in the data nodes for
query processing.

The conclusion here is that we have a number of wait states in the DBLQH module
while processing the scan waiting for the NDB API. We have similar wait states
in the join processing in the DBSPJ module waiting for the NDB API to process
the result rows from the join processing.

We already have implemented batch handling that makes the query execution efficient.
It is possible by storing result rows temporarily in DBLQH and in DBSPJ to improve
parallelism in the query execution.

Next part
.........
In the next part we will go through a bit more complex query, Q7 in TPC-H which is
a 6-way join that uses a mix of scans and key lookups.

The query is:
SELECT
        supp_nation,
        cust_nation,
        l_year,
        SUM(volume) AS revenue
FROM
        (
                SELECT
                        n1.n_name AS supp_nation,
                        n2.n_name AS cust_nation,
                        extract(year FROM l_shipdate) as l_year,
                        l_extendedprice * (1 - l_discount) AS volume
                FROM
                        supplier,
                        lineitem,
                        orders,
                        customer,
                        nation n1,
                        nation n2
                WHERE
                        s_suppkey = l_suppkey
                        AND o_orderkey = l_orderkey
                        AND c_custkey = o_custkey
                        AND s_nationkey = n1.n_nationkey
                        AND c_nationkey = n2.n_nationkey
                        AND (
                                (n1.n_name = 'GERMANY' AND n2.n_name = 'FRANCE')
                                OR (n1.n_name = 'FRANCE' AND n2.n_name = 'GERMANY')
                        )
                        AND l_shipdate BETWEEN '1995-01-01' AND '1996-12-31'
        ) AS shipping
GROUP BY
        supp_nation,
        cust_nation,
        l_year
ORDER BY
        supp_nation,
        cust_nation,
        l_year;

MySQL Encryption: Talking About Keyrings

$
0
0
MySQL Keyrings

MySQL KeyringsIt has been possible to enable Transparent Data Encryption (TDE) in Percona Server for MySQL/MySQL for a while now, but have you ever wondered how it works under the hood and what kind of implications TDE can have on your server instance? In this blog posts series, we are going to have a look at how TDE works internally. First, we talk about keyrings, as they are required for any encryption to work. Then we explore in detail how encryption in Percona Server for MySQL/MySQL works and what the extra encryption features are that Percona Server for MySQL provides.

MySQL Keyrings

Keyrings are plugins that allow a server to fetch/create/delete keys in a local file (keyring_file) or on a remote server (for example, HashiCorp Vault). All keys are cached locally inside the keyring’s cache to speed up fetching keys. They can be separated into two categories of plugins that use the following:

  • Local resource as a backend for storing keys, like local file (we call this resource file-based keyring)
  • Remote resource as a backend for storing keys, like Vault server (we call this resource server-based keyring)

The separation is important because depending on the backend, keyrings behave a bit differently, not only when storing/fetching keys but also on startup.

In the case of a file-based keyring, the keyring on startup loads the entire content of the keyring (i.e., key id, key user, key type, together with keys themselves) into the cache.

In the case of server-based keyring (for instance, Vault server), the server loads only a list of the key ids and the key user on the startup so the startup is not slowed by retrieving all of the keys from the server. It is worth mentioning what information is stored in the keyring backend. The keys are lazy-loaded, which means when the first time a server requests a key, the keyring_vault asks the Vault server to send the key. The keyring caches the key in memory to ensure if, in the future, the server can use memory access instead of a TLS connection to the Vault server to retrieve the key.

The record in keyring consist of the following:

  • key id – An ID of the key, for instance: INNODBKey-764d382a-7324-11e9-ad8f-9cb6d0d5dc99-1
  • key type – The type of key, based on the encryption algorithm used, possible values are: “AES”, “RSA” or “DSA”
  • key length – Length is measured in bytes, AES: 16, 24 or 32, RSA 128, 256, 512, and DSA 128, 256 or 384.
  • user – Owner of the key. If this key is a system key, such as the Master Key, this field is empty. When the key is created with keyring_udf, this field is the owner of the key.
  • key itself

Each key is uniquely identified by pair: key_id, user.

There are also differences when it comes to storing and deleting keys.

The file-based keyring operation should be faster, and the operation is. You may assume the key storage is just a single write of a key to a file, but more tasks are involved. Before any file-based keyring modification, the keyring creates a backup file with the entire content of the keyring and places this backup file next to the keyring file. Let’s say your keyring file is called my_biggest_secrets; the backup is named my_biggest_secrets.backup. Next, the keyring modifies the cache to add or remove a key, and if this task is successful, it dumps (i.e., rewrites the entire content of a keyring file) from the cache into your keyring file. On rare occasions, such as a server crash, you can observe this backup file. The backup file is deleted by keyring next time the keyring is loaded (generally after the server restart).

When storing or deleting a key, the server-based keyring must connect to the server and communicate a “send the key”/”request key deletion” from the server.

Let’s get back to the speed of the server startup. Apart from the keyring itself impacting the startup time, there is also a matter of how many keys must be retrieved from the backend server on startup. Of course, this is especially important for server-based keyrings. On server startup, the server checks what key is needed to decrypt each encrypted table/tablespaces and fetches this key from the keyring. On a “clean” server with Master Key encryption, there should be one Master Key that must be fetched from the keyring. However, there can be more keys required, for instance, when a slave is re-created from master backup, etc. In those cases, it is good to consider the Master Key rotation. I will talk more about that in future blog posts, but I just wanted to outline here that a server that is using multiple Master Keys might startup a bit longer, primarily when server-based keyring is used.

Now let’s talk some more on the keyring_file. When I was developing the keyring_file, the concern was also how to be sure that the keyring_file was not changed under the running server. In 5.7, the check is done based on file stats, which is not a perfect solution and this solution was replaced in 8.0 with SHA256 checksum.

When keyring_file is first started, the file stats and checksum are calculated and remembered by the server, and the changes are only applied if those match. Of course, the checksum is updated as the file gets updated.

We have covered lots of ground on keyrings so far. There is one more important topic, though, that is often forgotten or misunderstood – the per-server separation of keyrings, and why this is essential. What do I mean by that? I mean that each server (let’s say Percona Server) in a cluster should have a separate place on the Vault server where Percona Server should store its keys. Master Keys stored in the keyring have each Percona Server’s GUID embedded into their ids. Why is this important? Imagine you have one Vault Server with keys, and all of the Percona Servers in your cluster are using this one Vault server. The problem seems obvious – if all of the Percona Servers were using Master Keys without unique ids – for instance, id = 1, id = 2, etc. – all the Percona servers in the cluster would be using the same Master Key. What the GUID provides is this per-server separation. Why talk about the per-server separation of keyrings, since there is already a separation with the unique GUID per Percona server? Well, there is one more plugin, keyring_udf. With this plugin, a user of your server can store their own keys inside the Vault server. The problem arises when your user creates a key on, let’s say server1, and then attempts to create a key with the same identifier (key_id) on server2, like this:

--server1:
select keyring_key_store('ROB_1','AES',"123456789012345");
1
--1 means success
--server2:
select keyring_key_store('ROB_1','AES',"543210987654321");
1

Wait. What!? Since both servers use the same Vault server, should not the keyring_key_store fail on the server2? Interesting enough, if you try to do the same on just one server, you will get a failure:

--server1:
select keyring_key_store('ROB_1','AES',"123456789012345");
1
select keyring_key_store('ROB_1','AES',"543210987654321");
0

Right, ROB_1 already exists.

Let’s discuss the second example first. As we discussed earlier – the keyring_vault or any other keyring plugin is caching all of the key ids in memory. So after the new key, ROB_1 is added on server 1 and apart from sending this key to Vault, the key is also added to the keyring’s cache. Now, when we try to add the same key for the second time, keyring_vault checks if this key already exists in the cache and will error out.

The story is different in the first example. Keyring on server1 has its own cache of the keys stored on the Vault server, and server2 has its own cache. After ROB_1 is added to the keyring’s cache on server1 and Vault server, the keyring’s cache on server2 is out of sync. The cache on server2 does not have the ROB_1 key; thus, writes to the keyring_key_store and writes ROB_1 to the Vault server which actually overrides (!) the previous value. Now the key ROB_1 on the Vault server is 543210987654321. Interesting enough, the Vault server does not block such actions and happily overrides the old value.

Now we see why this per-server separation on the Vault server can be significant – in case you allow the use of keyring_udf, and also if you want to store keys in order in your Vault. How can we ensure this separation on the Vault server?

There are two ways of separation on the Vault server. You can create mount points in the Vault server – a mount point per server, or you can use different paths inside the same mount point, with one path per server. It is best to explain those two approaches by examples. So let’s have a look at configuration files. First for mount point separation:

--server1:
vault_url = http://127.0.0.1:8200
secret_mount_point = server1_mount
token = (...)
vault_ca = (...)
--server2:
vault_url = http://127.0.0.1:8200
secret_mount_point = sever2_mount
token = (...)
vault_ca = (...)

We can see that we have server1 is using different mount point than server2. In a path separation the config files would look like the following:

--server1:
vault_url = http://127.0.0.1:8200
secret_mount_point = mount_point/server1
token = (...)
vault_ca = (...)
--server2:
vault_url = http://127.0.0.1:8200
secret_mount_point = mount_point/sever2
token = (...)
vault_ca = (...)

In this case, both servers are using the same secret mount point – the “mount_point,” but different paths. When you create the first secret on server1 in this path – the Vault server automatically creates a “server1” directory. The actions are the same for server2. When you remove the last secret in mount_point/server1 or mount_point/server2, then the Vault server removes these directories also. As we can see in case you use the path separation, you must create only one mount point and modify the configuration files to make servers use separate paths. The mount point can be created with an HTTP request. With CURL it’s:

curl -L -H "X-Vault-Token: TOKEN" –cacert VAULT_CA
--data '{"type":"generic"}' --request POST VAULT_URL/v1/sys/mounts/SECRET_MOUNT_POINT

All of the fields (TOKEN, VAULT_CA, VAULT_URL, SECRET_MOUNT_POINT) correspond to the options from the keyring configuration file. Of course, you can also use the vault binary to do the same. The point is that mount point creation can be automated. I hope you will find this information helpful, and we will see each other in the next blog post of this series.

Thanks,
Robert

Re-Slaving a Crashed MySQL Master Server in Semisynchronous Replication Setup

$
0
0

In a MySQL 5.7 master-slave setup that uses the default semisynchronous replication setting for rpl_semi_sync_master_wait_point, a crash of the master and failover to the slave is considered to be lossless. However, when the crashed master comes back, you may find that it has transactions that are not present in the current master (which was previously a slave). This behavior may be puzzling, given that semisynchronous replication is supposed to be lossless, but this is actually an expected behavior in MySQL. Why exactly this happens is explained in full detail in the blog post by Jean-François Gagné (JF).

Given such a scenario, MySQL documentation recommends that the crashed master must be discarded and should not be restarted. However, discarding a server like this is expensive and inefficient. In this blog post, we will explain an approach to detect and fix transactions on the crashed MySQL master server in a semisynchronous replication setup, and how to re-slave it back into your master-slave setup.

Why Is It Important to Detect Extra Transactions on the Recovered Master?

The extra transactions on the recovered master can manifest in two ways:

1. MySQL replication failures when the recovered master is re-slaved

Typically, this happens when you have an auto-increment primary key. When the new MySQL master inserts a row into such a table, the replication will fail because the key already exists on the slave.

Another scenario is when your app retries the transaction that had failed during master crash. On the recovered MySQL master (which is now a slave), this transaction would actually exist, and again, results in a replication error.

Typically, the MySQL replication error would look like this:

[ERROR] Slave SQL for channel '': Worker 5 failed executing transaction 'fd1ba8f0-cbee-11e8-b27f-000d3a0df42d:5938858' at master log mysql-bin.000030, end_log_pos 10262184; Error 'Duplicate entry '5018' for key 'PRIMARY'' on query. Default database: 'test'. Query: 'insert into test values(5018,2019,'item100')', Error_code: 1062

2. Silent inconsistency in data between the new MySQL master and slave (recovered master)

In cases where the application does not retry the failed transaction and there are no primary key collisions in future, a replication error may not occur. As a result, the data inconsistency may go undetected.

In both the cases above, either the high-availability or data integrity of your MySQL setup is impacted, which is why it’s so important to detect this condition as early as possible.

How to Detect Extra Transactions on the Recovered MySQL Master

We can detect if there are any extra transactions on the recovered master using the MySQL GTID (global transaction identifier) function:

GTID_SUBSET(set1,set2): Given two sets of global transaction IDs set1 and set2, returns true if all GTIDs in set1 are also in set2. Returns false otherwise.

Let’s use an example to understand this.

  • GTID set on the recovered master whose UUID is: ‘54a63bc3-d01d-11e7-bf52-000d3af93e52’ is:
    • '54a63bc3-d01d-11e7-bf52-000d3af93e52:1-9700,57956099-d01d-11e7-80bc-000d3af97c09:1-810’
  • The GTID set of the new master whose UUID is: ‘57956099-d01d-11e7-80bc-000d3af97c09’ is:
    • '54a63bc3-d01d-11e7-bf52-000d3af93e52:1-9690,57956099-d01d-11e7-80bc-000d3af97c09:1-870’

Now, if we call the GTID_SUBSET function as GTID_SUBSET(GTID set of recovered master, GTID set of new master), the return value will be true, only if the recovered master does not have any extra transactions. In our example above, since the recovered master has extra transactions 9691 to 9700, the result of the above query is false.

Re-Slaving a Crashed #MySQL Master Server in Semisynchronous Replication SetupClick To Tweet

How to Re-Slave the Recovered MySQL Master That Has Extra Transactions

Based on the above step, it is possible to know if the recovered master has extra transactions, and what these transactions are using the GTID function: GTID_SUBTRACT(GTID set of recovered master, GTID set of new master).

It is also possible to extract these extra transactions from the binary logs and save them. It may be useful for your business team to later review these transactions to make sure we are not inadvertently losing any important business information, even though it was uncommitted. Once this is done, we need a way to get rid of these extra transactions so that the recovered master can be re-slaved without issues.

One of the simplest ways to do this is to take a backup snapshot on the current master and restore the data onto your current slave. Remember that you need to retain the UUID of this server as before. After you’ve restored the data, the server can be re-slaved, and it will start replication from the point of the restored snapshot. You will soon have a healthy slave running again!

The steps above are very tedious if you have to perform them manually, but ScaleGrid’s fully managed MySQL hosting service can automate the entire process for you without any intervention required. Here’s how it works:

If your current master crashes, ScaleGrid automates the failover process and promotes a suitable slave as the new master. The old master is then recovered, and we automatically detect if there are extra transactions on it. If any are found, the MySQL deployment is put in a degraded state we use automated tools to pull out the extra transactions and save them for your review. Our support team can then restore the old master to a good state, and re-slave it back into your master-slave setup so that you will have a healthy deployment!

Want to give it a try? Start a free 30-day trial to explore all the MySQL database management capabilities at ScaleGrid.

Learn More About MySQL Hosting

Back Up MySQL View Definitions

$
0
0

If you want to back up your table and views, stored procedures, or stored function definitions, you can use mysqldump or mysqlpump to export the schema without the data. However, if you just want the views you need to look for another option. This blog shows how MySQL Shell comes to the rescue.

Backup the view definition using MySQL Shell

There are a couple of approaches to get the view definitions. One option is to consider the information_schema.VIEWS view which has the following columns:

mysql> SELECT COLUMN_NAME AS Field, COLUMN_TYPE AS Type
         FROM information_schema.COLUMNS
        WHERE TABLE_SCHEMA = 'information_schema'
              AND TABLE_NAME = 'VIEWS'
        ORDER BY ORDINAL_POSITION;
+----------------------+---------------------------------+
| Field                | Type                            |
+----------------------+---------------------------------+
| TABLE_CATALOG        | varchar(64)                     |
| TABLE_SCHEMA         | varchar(64)                     |
| TABLE_NAME           | varchar(64)                     |
| VIEW_DEFINITION      | longtext                        |
| CHECK_OPTION         | enum('NONE','LOCAL','CASCADED') |
| IS_UPDATABLE         | enum('NO','YES')                |
| DEFINER              | varchar(288)                    |
| SECURITY_TYPE        | varchar(7)                      |
| CHARACTER_SET_CLIENT | varchar(64)                     |
| COLLATION_CONNECTION | varchar(64)                     |
+----------------------+---------------------------------+
10 rows in set (0.0011 sec)

This looks good, but there are two flaws. First of all, the algorithm of the view is not included among the information. Granted, most view definitions do not explicitly define the algorithm, but from time to time it is important. The other limitation is not visible from the column list but becomes clear if you look at an example of a view:

mysql> SELECT *
         FROM information_schema.VIEWS
        ORDER BY LENGTH(VIEW_DEFINITION) LIMIT 1\G
*************************** 1. row ***************************
       TABLE_CATALOG: def
        TABLE_SCHEMA: sys
          TABLE_NAME: version
     VIEW_DEFINITION: select '2.1.1' AS `sys_version`,version() AS `mysql_version`
        CHECK_OPTION: NONE
        IS_UPDATABLE: NO
             DEFINER: mysql.sys@localhost
       SECURITY_TYPE: INVOKER
CHARACTER_SET_CLIENT: utf8mb4
COLLATION_CONNECTION: utf8mb4_0900_ai_ci
1 row in set (0.0017 sec)

This just selects the information for the view with the shortest view definition as the definition is not important, so there is no reason to include more data than necessary. You may have a different view returned.

The important point in the output is the value of DEFINER. You may have to quote the username or hostname, but that is not simple to do because the full account name is listed.

An alternative is to export the view definition using the SHOW CREATE VIEW statement. For example for the sakila.staff_list view:

mysql> SHOW CREATE VIEW sakila.staff_list\G
*************************** 1. row ***************************
                View: staff_list
         Create View: CREATE ALGORITHM=UNDEFINED DEFINER=`root`@`localhost` SQL SECURITY DEFINER VIEW `sakila`.`staff_list` AS select `s`.`staff_id` AS `ID`,concat(`s`.`first_name`,_utf8mb3' ',`s`.`last_name`) AS `name`,`a`.`address` AS `address`,`a`.`postal_code` AS `zip code`,`a`.`phone` AS `phone`,`sakila`.`city`.`city` AS `city`,`sakila`.`country`.`country` AS `country`,`s`.`store_id` AS `SID` from (((`sakila`.`staff` `s` join `sakila`.`address` `a` on((`s`.`address_id` = `a`.`address_id`))) join `sakila`.`city` on((`a`.`city_id` = `sakila`.`city`.`city_id`))) join `sakila`.`country` on((`sakila`.`city`.`country_id` = `sakila`.`country`.`country_id`)))
character_set_client: utf8mb4
collation_connection: utf8mb4_0900_ai_ci
1 row in set, 1 warning (0.0013 sec)

This has all the required information with the username and hostname properly quoted. It is fine to use SHOW CREATE VIEW like this for a few views, but it is not practical to back up all view definitions and automatically pick up new definitions. This is where the scripting modes of MySQL Shell are useful.

This example uses Python, but you can also choose to implement a solution in JavaScript. In MySQL 8 you can use the X DevApi to easily query the information_schema.VIEWS view and add filters as required. An example of exporting all views except those in the system databases (mysql, information_schema, sys, and performance_schema) is:

\py

i_s = session.get_schema('information_schema')
views = i_s.get_table('VIEWS')
stmt = views.select('TABLE_SCHEMA', 'TABLE_NAME')
stmt = stmt.where("TABLE_SCHEMA NOT IN " +
       "('mysql', 'information_schema', 'sys', 'performance_schema')")

result = stmt.execute()
for view in result.fetch_all():
    sql = 'SHOW CREATE VIEW `{0}`.`{1}`'.format(*view)
    v_result = session.sql(sql).execute()
    v_def = v_result.fetch_one()
    print('DROP TABLE IF EXISTS `{0}`.`{1}`;'.format(*view))
    print('DROP VIEW IF EXISTS `{0}`.`{1}`;'.format(*view))
    print(v_def[1] + ';')
    print('')

You need an empty line after the stmt = stmt.where(...) statement and at the end to tell MySQL Shell that you have completed multi-line statements. The example assume that you already have a connection to MySQL.

First the schema object for information_schema schema and table object for the VIEWS view are fetched. Then a select statement is created with a WHERE clause specifying which schemas that we want the view definitions for. Change this as required. You can chain the two stmt and the result assignments to a single line (in the above example it was split out to improve the readability in the blog):

result = views.select('TABLE_SCHEMA', 'TABLE_NAME').where("TABLE_SCHEMA NOT IN ('mysql', 'information_schema', 'sys', 'performance_schema')").execute()

The result object can be used to loop over the views and execute SHOW CREATE VIEW for each view. In this example, a DROP TABLE and DROP VIEW are added, but that can optionally be removed. Then the second column of the SHOW CREATE VIEW output is printed.

Note that in the example, when the SHOW CREATE VIEW statement is put together, the schema and table names are quoted using backticks:

    sql = 'SHOW CREATE VIEW `{0}`.`{1}`'.format(*view)

For this to be valid, it assumes you have no view names with backticks in the name (if you have – please don’t! – you need to escape the backticks by duplicating it). If you have the ANSI_QUOTES SQL mode enabled, you should change the backticks with double quotes.

You can also use the character and collation information from information_schema.VIEWS view to set the client character set and collation like mysqldump does. This is left as an exercise for the reader.

Fixing the InnoDB RW-lock

$
0
0
I hope that someone updates the InnoDB Wikipedia page to explain how it came to be. I know it started with Heikki Tuuri. At what point did he get help? Regardless, early InnoDB was an amazing accomplishment and fortunately MySQL saw the potential for it after other large DBMS vendors were not interested.

I enjoyed reading the source code -- it is well written with useful comments. Some of the comments are amusing at this point with references to HW assumptions that were valid in the early and mid 90s. InnoDB had, and might still have, a SQL parser that is used to maintain dictionary tables. Fortunately the code has aged well and been significantly improved by the InnoDB team.

InnoDB and SMP

InnoDB had a big problem in 2005. Commodity SMP hardware was changing from 4-core/1-socket to 8-core/2-socket and InnoDB wasn't ready for it. My memory is that MySQL in 2005 saturated at 10k QPS with sysbench and moving from 1 to 2 sockets hurt QPS.

InnoDB had many problems. A lot of work was done to fix them by the InnoDB team, Percona, Google, Facebook and others. I have forgotten a lot of the details but much is recorded in blog posts and slide decks. The InnoDB rw-lock was a big part of the problem. InnoDB implements a rw-lock and mutex. Both add value -- by adding monitoring for performance and debugging. The rw-lock is also required to support special use cases (I forgot the reasons, but they are valid). Unfortunately both the mutex and rw-lock were lousy on 2-socket servers under contention.

The problem was too much spinning. The rw-lock used the InnoDB mutex to protect its internal state. Both the rw-lock and mutex did some spinning before going to sleep when the lock could not be acquired. This is similar to PTHREAD_MUTEX_ADAPTIVE_NP but the spinning is configurable. The InnoDB rw-lock did spinning on its own and then could do even more spinning when using the InnoDB mutex that guarded its state. There was so much spinning.

The performance impact from this work is explained here.

A Solution

My memory is that Yasufumi Kinoshita implemented the solution first and I learned of that from his presentation at Percona Live. He might have been working at NTT at the time. Inspired by him, my team at Google implemented a similar solution, wrote a Spin model to validate the correctness and then contributed the fix to the InnoDB team who were part of Oracle. The Spin model helped convince the InnoDB team that the code might be correct. I am a huge fan of Spin.

I am proud of the work my team at Google did to fix the rw-lock and it was easy to work with the InnoDB team -- they have always been a great partner for external InnoDB contributors. But I also want to give credit for the person who first showed how to fix the InnoDB rw-lock as he has a long history of making InnoDB better.

Other fixes

Much more has been done to make InnoDB great for many-core servers. Back when the rw-lock was fixed the mutex was also changed to use atomic operations rather than pthread mutex (at least for x86, hopefully for ARM now). My early blog posts mention that and changes to the InnoDB memory heap mutex. I remember nothing about the InnoDB heap mutex. Some of my early docs were published on code.google.com (since shutdown by Google). I archived some of these before the shutdown and will try to republish them.

Historical - InnoDB SMP performance

$
0
0
This is a post about InnoDB SMP performance improvements in 200X written around 2008. It was shared at code.google.com which has since shutdown. It describes work done by my team at Google. The big-3 problems for me back then were: lack of monitoringreplication and InnoDB on many-core.

Introduction

This describes performance improvements from changes in the v2 Google patch. While the changes improve performance in many cases, a lot of work remains to be done. It improves performance on SMP servers by:
  • disabling the InnoDB memory heap and associated mutex
  • replacing the InnoDB rw-mutex and mutex on x86 platforms
  • linking with tcmalloc
While tcmalloc makes some of the workloads much faster, we don't recommend its use yet with MySQL as we are still investigating its behavior.

Database reload

This displays the time to reload a large database shard on a variety of servers (HW + SW). Unless otherwise stated, my.cnf was optimized for a fast (but unsafe) reload with the following values. Note that
  • innodb_flush_method=nosync is only in the Google patch and is NOT crash safe (kind of like MyISAM). This uses a real data set that produces a 100GB+ database.
  • innodb_log_file_size=1300M
  • innodb_flush_method=nosync
  • innodb_buffer_pool_size=8000M
  • innodb_read_io_threads=4
  • innodb_write_io_threads=2
  • innodb_thread_concurrency=20
The data to be reloaded was in one file per table on the db server. Each file was compressed and reloaded by a separate client. Each table was loaded by a separate connection except for the largest tables when there was no other work to be done. 8 concurrent connections were used.

The smpfix RPM is MySQL 5.0.37 plus the v1 Google patch and the SMP fixes that include:
  • InnoDB mutex uses atomic ops
  • InnoDB rw-mutex uses lock free methods to get and set internal lock state
  • tcmalloc is used in place of glibc malloc
  • the InnoDB malloc heap is disabled
The base RPM is MySQL 5.0.37 and the v1 Google patch. It does not have the SMP fixes.

The servers are:
  • 8core - the base RPM on an 8-core x86 server
  • 4core-128M - the base RPM on a 4-core x86 server with innodb_log_file_size=128M
  • 8core-tc4 - the base RPM on an 8-core x86 server with innodb_thread_concurrency=4
  • smpfix-128M - the smpfix RPM with innodb_log_file_size=128M
  • 4core - the base RPM on a 4-core x86 server
  • smpfix-4core - the smpfix RPM on a 4-core x86 server
  • smpfix-512M - the smpfix RPM on an 8-core x86 server with innodb_log_file_size=512M
  • smpfix - the smpfix RPM on an 8-core x86 server
  • onlymalloc - the base RPM on an 8-core x86 server with the InnoDB malloc heap disabled
  • smpfix-notcmalloc - the smpfix RPM on an 8-core x86 server without tcmalloc
The x-axis is time so larger is slower.


Sysbench readwrite

Sysbench includes a transaction processing benchmark. The readwrite version of the sysbench OLTP test is measured here using 1, 2, 4, 8, 16, 32 and 64 threads.

The sysbench command line options are:
# N is 1, 2, 4, 8, 16, 32 and 64
 --test=oltp --oltp-table-size=1000000 --max-time=600 --max-requests=0 --mysql-table-engine=innodb --db-ps-mode=disable --mysql-engine-trx=yes --num-threads=N
The my.cnf options are:
innodb_buffer_pool_size=8192M
innodb_log_file_size=1300M
innodb_read_io_threads = 4
innodb_write_io_threads = 4
innodb_file_per_table
innodb_flush_log_at_trx_commit=2
innodb_log_buffer_size = 200m
innodb_thread_concurrency=0
log_bin
key_buffer_size = 50m
max_heap_table_size=1000M
tmp_table_size=1000M
max_tmp_tables=100
The servers are:
  • base - MySQL 5.0.37 without the smp fix
  • tc4 - MySQL 5.0.37 without the smp fix, innodb_thread_concurrency=4
  • smpfix - MySQL 5.0.37 with the smp fix and tcmalloc
  • notcmalloc - MySQL 5.0.37 with the smp fix, not linked with tcmalloc
  • onlymalloc - MySQL 5.0.37 with the InnoDB malloc heap disabled
  • my4026 - unmodified MySQL 4.0.26
  • my4122 - unmodified MySQL 4.1.22
  • my5067 - unmodified MySQL 5.0.67
  • my5126 - unmodified MySQL 5.1.26
  • goog5037 - the same as base, MySQL 5.0.37 without the smp fix

Results for sysbench readonly

Sysbench includes a transaction processing benchmark. The readonly version of the sysbench OLTP test is measured here using 1, 2, 4, 8, 16, 32 and 64 threads.

The sysbench command line options are:
# N is 1, 2, 4, 8, 16, 32 and 64
 --test=oltp --oltp-read-only --oltp-table-size=1000000 --max-time=600 --max-requests=0 --mysql-table-engine=innodb --db-ps-mode=disable --mysql-engine-trx=yes --num-threads=N
The my.cnf options are:
innodb_buffer_pool_size=8192M
innodb_log_file_size=1300M
innodb_read_io_threads = 4
innodb_write_io_threads = 4
innodb_file_per_table
innodb_flush_log_at_trx_commit=2
innodb_log_buffer_size = 200m
innodb_thread_concurrency=0
log_bin
key_buffer_size = 50m
max_heap_table_size=1000M
tmp_table_size=1000M
max_tmp_tables=100
The servers are:
  • base - MySQL 5.0.37 without the smp fix
  • tc4 - MySQL 5.0.37 without the smp fix, innodb_thread_concurrency=4
  • smpfix - MySQL 5.0.37 with the smp fix and tcmalloc
  • notcmalloc - MySQL 5.0.37 with the smp fix, not linked with tcmalloc
  • onlymalloc - MySQL 5.0.37 with the InnoDB malloc heap disabled
  • my4026 - unmodified MySQL 4.0.26
  • my4122 - unmodified MySQL 4.1.22
  • my5067 - unmodified MySQL 5.0.67
  • my5126 - unmodified MySQL 5.1.26
  • goog5037 - the same as base, MySQL 5.0.37 without the smp fix


Concurrent joins

This test runs a query with a join. It is run using concurrent sessions. The data fits in the InnoDB buffer cache. The query is:
select count(*) from T1, T2 where T1.j > 0 and T1.i = T2.i
The data for T1 and T2 matches that used for the sbtest table by sysbench. This query does a full scan of T1 and joins to T2 by primary key.

The servers are:
  • base - MySQL 5.0.37 without the smp fix
  • tc4 - MySQL 5.0.37 without the smp fix, innodb_thread_concurrency=4
  • smpfix - MySQL 5.0.37 with the smp fix and tcmalloc
  • notcmalloc - MySQL 5.0.37 with the smp fix, not linked with tcmalloc
  • onlymalloc - MySQL 5.0.37 with the InnoDB malloc heap disabled
  • my4026 - unmodified MySQL 4.0.26
  • my4122 - unmodified MySQL 4.1.22
  • my5067 - unmodified MySQL 5.0.67
  • my5126 - unmodified MySQL 5.1.26
  • goog5037 - the same as base, MySQL 5.0.37 without the smp fix

I only have results for 8 and 16 core servers here. Lower times are better.

With data from the worst case:
Without data from the worst case:

With data from the worst case:

Without data from the worst case:

Concurrent inserts

This test reloads tables in parallel. Each connection inserts data for a different table. Tests were run using 1, 2, 4, 8 and 16 concurrent sessions. The regression for 5.0.37 is in the parser and was fixed by 5.0.54. A separate table is used for each connection. DDL for the tables is:
create table T$i (i int primary key, j int, index jx(j)) engine=innodb
Multi-row insert statements are used that insert 1000 rows per insert statement. Auto-commit is used. The insert statements look like:
INSERT INTO T1 VALUES (0, 0), (1, 1), (2, 2), ..., (999,999);
The servers are:
  • base - MySQL 5.0.37 without the smp fix
  • tc4 - MySQL 5.0.37 without the smp fix, innodb_thread_concurrency=4
  • smpfix - MySQL 5.0.37 with the smp fix and tcmalloc
  • notcmalloc - MySQL 5.0.37 with the smp fix, not linked with tcmalloc
  • onlymalloc - MySQL 5.0.37 with the InnoDB malloc heap disabled
  • my4026 - unmodified MySQL 4.0.26
  • my4122 - unmodified MySQL 4.1.22
  • my5067 - unmodified MySQL 5.0.67
  • my5126 - unmodified MySQL 5.1.26
  • goog5037 - the same as base, MySQL 5.0.37 without the smp fix

MySQL 5.0.37 has a performance regression in the parser. This was fixed in 5.0.54. See bug 29921.

Note, lower values for Time are better.
With data from the worst case:
Without data from the worst case:
With data from the worst case:
Without data from the worst case:

Historical - UserTable Monitoring

$
0
0
This is a post about user, table and index monitoring added by my team at Google. It was shared at code.google.com which has since shutdown. Eventually I wrote a better guide here. This was in production around 2007, several years before something similar was provided by upstream. This monitoring allowed us to keep MySQL from collapsing. I can't imagine how anyone did web-scale MySQL without it. The big-3 problems for me back then were: lack of monitoring, replication and InnoDB on many-core.

A common problem was a server collapsing from short-running queries. This was hard to see in SHOW PROCESSLIST but easy to spot with USER_STATISTICS.

We also had a framework to sample, archive and aggregate SHOW PROCESSLIST output from production servers.

Introduction

We have added code to measure database activity and aggregate the results per account, table and index. We have also added SQL statements to display these values.

One of these days we will integrate this with the information schema.

Details

Note that *rows changed* includes rows from insert, update, delete and replace statements.

The commands are:
  • SHOW USER_STATISTICS
  • SHOW TABLE_STATISTICS
  • SHOW INDEX_STATISTICS
  • SHOW CLIENT_STATISTICS
  • FLUSH TABLE_STATISTICS
  • FLUSH INDEX_STATISTICS
  • FLUSH CLIENT_STATISTICS

SHOW USER_STATISTICS

This displays resource consumption for all sessions per database account:
  • number of seconds executing SQL commands (wall time and CPU time)
  • number of concurrent connections (the current value)
  • number of connections created
  • number of rollbacks
  • number of commits
  • number of select statements
  • number of row change statements
  • number of other statements and internal commands
  • number of rows fetched
  • number of rows changed
  • number of bytes written to the binlog
  • number of network bytes sent and received
  • number of rows read from any table
  • number of failed attempts to create a connection
  • number of connections closed because of an error or timeout
  • number of access denied errors
  • number of queries that return no rows

SHOW CLIENT_STATISTICS

This has the same values as SHOW USER_STATISTICS but they are aggregated by client IP address rather than by database account name.

SHOW TABLE_STATISTICS

This displays the number of rows fetched and changed per table. It also displays the number of rows changed multiplied by the number of indexes on the table.

SHOW INDEX_STATISTICS

This displays the number of rows fetched per index. It can be used to find unused indexes.

Flush commands

Each of the flush commands clears the counters used for the given SHOW command.

Historical - Transactional Replication

$
0
0
This is a post about work done by Wei Li at Google to make MySQL replication state crash safe. Before this patch it was easy for a MySQL storage engine and replication state to disagree after a crash. Maybe it didn't matter as much for people running MyISAM because that too wasn't crash safe. But so many people had to wake up late at night to recover from this problem which would manifest as either a duplicate key error or silent corruption. The safe thing to do was to not restart a replica after a crash and instead restore a new replica from a backup.

Wei Li spent about 12 months fixing MySQL replication adding crash safety and several other features. That was an amazing year from him. I did the code reviews. My reviews were weak. MySQL replication code was difficult back then.

I got to know Domas Mituzas after he extracted this feature from the Google patch to use for Wikipedia. I was amazed he did this and he continued to make my life with MySQL so much better at Google and then Facebook. When I moved to Google I took too long to port this patch for them. My excuse is that Domas wasn't yelling enough -- there were many problems and my priority list was frequently changing.

This post was first shared at code.google.com which has since shutdown. This feature was in production around 2007, many years before something similar was provided by upstream. I can't imagine doing-web-scale MySQL without it. The big-3 problems for me back then were: lack of monitoring, replication and InnoDB on many-core.

Introduction

Replication state on the slave is stored in two files: relay-log.info and master.info. The slave SQL thread commits transactions to a storage engine and then updates these files to indicate the next event from the relay log to be executed. When the slave mysqld process is stopped between the commit and the file update, replication state is inconsistent and the slave SQL thread will duplicate the last transaction when the slave mysqld process is restarted.

Details

This feature prevents that failure for the InnoDB storage engine by storing replication state in the InnoDB transaction log. On restart, this state is used to make the replication state files consistent with InnoDB.

The feature is enabled by the configuration parameter rpl_transaction_enabled=1. Normally, this is added to the mysqld section in /etc/my.cnf. The state stored in the InnoDB transaction log can be cleared setting a parameter and then committing a transaction in InnoDB. For example:
set session innodb_clear_replication_status=1;
create table foo(i int) type=InnoDB;
insert into foo values (1);
commit;
drop table foo;
Replication state is updated in the InnoDB transaction log for every transaction that includes InnoDB. It is updated for some transactions that don't include InnoDB. When the replication SQL thread stops, it stores its offset in InnoDB.

The Dream

We would love to be able to kill the slave (kill -9) and have it always recover correctly. We are not there yet for a few reasons:
  • We don't update the state in InnoDB for some transactions that do not use InnoDB
  • DDL is not atomic in MySQL. For *drop table* and *create table* there are two steps: create or drop the table in the storage engine and create or drop the frm file that describes the table. A crash between these steps leaves the storage engine out of sync with the MySQL dictionary.
  • Other replication state is not updated atomically. When relay logs are purged, the files are removed and then the index file is updated. A crash before the index file update leaves references to files that don't exist. Replication cannot not be started in that case. Also, the index file is not updated in place rather than atomically (write temp file, sync, rename). 


Historical - SQL changes for MySQL

$
0
0
This is a post from circa 2008 that describes many of the changes we made at Google to the parser. It was first shared at code.google.com which has since shutdown. It describes work done by my team at Google.

Introduction

This describes changes to SQL parsed by MySQL.

New tokens:
  • CLIENT_STATISTICS
  • TABLE_STATISTICS
  • USER_STATISTICS
  • INDEX_STATISTICS
  • IF_IDLE
  • MAKE
  • MAPPED
  • MAX_QUERIES_PER_MINUTE
  • NEW_PASSWORD
  • ROLE
  • SLOW
  • TCMALLOC
  • IEEE754_TO_STRING
  • LAST_VALUE
  • ORDERED_CHECKSUM
  • UNORDERED_CHECKSUM

New SQL functions

New SQL functions include:
  • ORDERED_CHECKSUM - This is a SQL aggregate function that accepts one or more arguments. It returns the hash of its input arguments per group. The function is order dependent. The output of this from the first row in a group is used as the seed for the hash on the next row.
  • UNORDERED_CHECKSUM - This is a SQL aggregate function that accepts one or more arguments. It returns the hash of its input arguments per group. The function is order independent. The result from each row in a group is combined by XOR.
  • LAST_VALUE - This is a SQL aggregate function. It returns the last value read per group. Thus this depends on the input order to aggregation. See OnlineDataDrift for a use case (TODO - repost that)
  • HASH - This is a SQL function. It returns the hash of its input argument. It is not an aggregate function and produces one value per row.
  • IEEE754_TO_STRING - Converts a float or double decimal value with type string. This generates 17 digits of precision so that conversion of the string back to a double does not lose precision (the original double should be equal to the final double for all but a few special cases.
  • NEW_PASSWORD - Computes the new-style password hash regardless of the value for the my.cnf parameter old_passwords.

An example for UNORDERED_CHECKSUM is:
select unordered_checksum(c1) from foo group by c2;
select unordered_checksum(c1, c2) from foo group by c3;
An example for ORDERED_CHECKSUM is:
select ordered_checksum(c1) from foo group by c2;
select ordered_checksum(c1, c2) from foo group by c3;
An example for HASH is:
select hash(column) from foo
New options for existing statements

KILL <id> IF_IDLE can be used to kill a connection but only if it is idle.

MAX_QUERIES_PER_MINUTE can be used in place of MAX_QUERIES_PER_HOUR. This version of MySQL enforces query limits per minute rather than per hour and the value stored in the MySQL privilege table is the rate per minute.

CREATE MAPPED USER '' ROLE 'bar' and DROP MAPPED USER 'foo' support mapped users. See MysqlRoles for more details (TODO - repost Roles)

SHOW PROCESSLIST WITH ROLES and SHOW USER_STATISTICS WITH ROLES use the role name rather than the user name in results.

New statements

See the monitoring post for more details:
  • SHOW USER_STATISTICS
  • SHOW TABLE_STATISTICS
  • SHOW INDEX_STATISTICS
  • SHOW CLIENT_STATISTICS
  • FLUSH TABLE_STATISTICS
  • FLUSH INDEX_STATISTICS
  • FLUSH CLIENT_STATISTICS*

See the post on delayed users for more details:
  • MAKE USER 'foo' DELAYED 1000
  • MAKE CLIENT '10.0.0.1' DELAYED 2000
  • SHOW DELAYED USER
  • SHOW DELAYED CLIENT
  • SHOW TCMALLOC STATUS displays the status of tcmalloc when MySQL hash been linked with it and compiled with -DUSE_TCMALLOC. This displays the output from MallocExtension::GetStats.
  • CAST supports cast to DOUBLE
  • SHOW INNODB LOCKS provides more details on InnoDB lock holders and waiters
  • FLUSH SLOW QUERY LOGS rotates the slow query log.
  • MAKE MASTER REVOKE SESSION disconnects all sessions but the current one and prevents future connections from all users unless they have SUPER, REPL_CLIENT or REPL_SLAVE privileges. MAKE MASTER GRANT SESSION undoes this.

Historical - SemiSync replication

$
0
0
This post was shared on code.google.com many years ago but code.google has been shutdown. It describes work done by my team at Google. I am interested in the history of technology and with some spare time have been enable to republish it.

Semisync was useful to but misunderstood. Lossless semisync was awesome but perhaps arrived too late as Group Replication has a brighter future. I like Lossless semisync because it provides similar durability guarantees to GR without the overhead of running extra instances locally. Not running extra instances locally for GR means that commit will be slow courtesy of the speed of light. I hope that GR adds support for log-only voters (witnesses).

Regular semisync was misunderstood because people thought it provided extra durability. It didn't do that. It rate limited busy writers to reduce replication lag. It also limited a connection to at most one transaction that wasn't on at least one slave to reduce the amount of data that can be lost when a primary disappears.

Wei Li implemented semisync during his amazing year of work on replication. Then it was improved to lossless semisync by Zhou Zhenzing (see the first and second post and feature request) and work done upstream. Lossless semisync was widely deployed at FB courtesy of Yoshinori Matsunobu.

Introduction

Heikki Tuuri had the idea and perhaps a PoC but there wasn't much demand for it beyond me. Solid will offer their version of this later in 2007. We couldn't wait and implemented it.

The MySQL replication protocol is asynchronous. The master does not know when or whether a slave gets replication events. It is also efficient. A slave requests all replication events from an offset in a file. The master pushes events to the slave when they are ready.

Usage

We have extended the replication protocol to be semi-synchronous on demand. It is on demand because each slave registers as async or semi-sync. When semi-sync is enabled on the master, it blocks return from commit until either at least one semi-sync slave acknowledges receipt of all replication events for the transaction or until a configurable timeout expires.

Semi-synchronous replication is disabled when the timeout expires. It is automatically reenabled when slaves catch up on replication.

Configuration

The following parameters control this:
  • rpl_semi_sync_enabled configures a master to use semi-sync replication
  • rpl_semi_sync_slave_enabled configures a slave to use semi-sync replication. The IO thread must be restarted for this to take effect
  • rpl_semi_sync_timeout is the timeout in milliseconds for the master

Monitoring

The following variables are exported from SHOW STATUS:
  • Rpl_semi_sync_clients - number of semi-sync replication slaves
  • Rpl_semi_sync_status - whether semi-sync is currently ON/OFF
  • Rpl_semi_sync_slave_status - TBD
  • Rpl_semi_sync_yes_tx - how many transaction got semi-sync reply
  • Rpl_semi_sync_no_tx - how many transaction do not get semi-sync reply
  • Rpl_semi_sync_no_times - TBD
  • Rpl_semi_sync_timefunc_failures - how many gettimeofday() function fails
  • Rpl_semi_sync_wait_sessions - how many sessions are waiting for replies
  • Rpl_semi_sync_wait_pos_backtraverse - how many time we move waiting position back
  • Rpl_semi_sync_net_avg_wait_time(us) - the average network waiting time per tx
  • Rpl_semI_sync_net_wait_time - total time in us waiting for ACKs
  • Rpl_semi_sync_net_waits - how many times the replication thread waits on the network
  • Rpl_semi_sync_tx_avg_wait_time(us) - the average transaction waiting time
  • Rpl_semi_sync_tx_wait_time - TBD
  • Rpl_semi_sync_tx_waits - how many times transactions wait
  • Rpl_semi_sync_timefunc_failures - #times gettimeofday calls fail

Design Overview

Semi-sync replication blocks any COMMIT until at least one replica has acknowledged receipt of the replication events for the transaction. This ensures that at least one replica has all transactions from the master. The protocol blocks return from commit. That is, it blocks after commit is complete in InnoDB and before commit returns to the user.

This option must be enabled on a master and slaves that are close to the master. Only slaves that have this feature enabled participate in the protocol. Otherwise, slaves use the standard replication protocol.

Deployment

Semi-sync replication can be enabled/disabled on a master or slave without shutting down the database.

Semi-sync replication is enabled on demand. If there are no semi-sync replicas or they are all behind in replication, semi-sync replication will be disabled after the first transaction wait timeout. When the semi-sync replicas catch up, transaction commits will wait again if the feature is not disabled.

Implementation

The design doc is here.

Each replication event sent to a semi-sync slave has two extra bytes at the start that indicate whether the event requires acknowledgement. The bytes are stripped by the slave IO thread and the rest of the event is processed as normal. When acknowledgement is requested, the slave IO thread responds using the existing connection to the master. Acknowledgement is requested for events that indicate the end of a transaction, such as commit or an insert with autocommit enabled.


Viewing all 18789 articles
Browse latest View live