Quantcast
Channel: Planet MySQL
Viewing all 18838 articles
Browse latest View live

Using Perl to Send Tweets Stored in a MySQL Database to Twitter

$
0
0

Using twitter can sometimes feel like driving downtown, screaming what you want to say out the window, and hoping someone hears you. There might be tens of thousands of people downtown, but your message will only be heard by a few. Because of this, your best bet is to repeat your message as often as possible.

Twitter is free and if you want to reach as many people as possible, it’s another great tool for getting your message out there. But sending tweets on a scheduled basis can be a pain. There are client programs available which allow you to schedule your tweets (Hootsuite is one I have used in the past). You can load your tweets in the morning, and have the application tweet for you all day long. But you still have to load the application with your tweets—one by one.

A friend of mine asked me if there was a way to send the same 200 tweets over and over again, spaced out every 20 minutes or so. He has a consulting business, and just wants to build up a list of twitter followers by tweeting inspirational quotes. If he tweets for twenty hours a day, and sends three quotes an hour, it will take him a little more than three days to burn through his 200 quotes. And he can always add more quotes or space out the tweets as necessary. I decided to write a Perl script to do this for him.

To start, we will need a MySQL database to store the tweets. I use the MySQL Workbench product as my client application for connecting to MySQL. From within Workbench, I can create my tweet database:

CREATE DATABASE 'tweets' /*!40100 DEFAULT CHARACTER SET latin1 */

I will then need a table inside my database to store my tweets.

CREATE TABLE 'tweets' (
  'id' int(11) NOT NULL AUTO_INCREMENT,
  'tweet' char(140) DEFAULT NULL,
  'last_tweet_date' datetime NOT NULL DEFAULT '2015-01-01 00:00:00',
  'tweet_count' int(5) DEFAULT NULL,
  'tweet_length' int(3) DEFAULT NULL,
  PRIMARY KEY ('id')
) ENGINE=InnoDB AUTO_INCREMENT=100001 DEFAULT CHARSET=latin1

The tweet messages will be stored in the tweet column, and the last date the tweet was sent will have a time stamp in the last_tweet_date column. When we perform a search to find the next tweet, we will simply sort our search by the last_tweet_date and then id, and limit our output to one tweet. After we send the tweet, we will update the last_tweet_date column and send that tweet to the end of the line. The script will also incrementally change the tweet_count value (number of times the tweet has been sent), and record the length of the tweet in tweet_length. I do not do any error checking in the script to make sure the tweet was sent, but errors are printed.

We now need to insert some tweets into our table. Since my friend is going to be sending inspirational quotes, I found a few I can import. In order to make it easier for importing, all single quote marks (‘) will be replaced by the carat symbol (^). I can then swap these symbols inside the Perl script. You could use the backslash (\) before the single quote, but I prefer a single character substitution so I know how long the tweet will be.

I will also use the tilde (~) as a way to designate a carriage return in my tweet. The Perl script will replace the tilde with a carriage return (\n). Two tildes give me two carriage returns and a blank line.

insert into tweets (tweet) VALUES('I^m not afraid. -Luke~~You will be. -Yoda~~http://SomeWebSiteHere.com');
insert into tweets (tweet) VALUES('Do or do not.  There is no try.~~-Yoda~~http://SomeWebSiteHere.com');
insert into tweets (tweet) VALUES('No, I am your father.~~-Darth~~http://SomeWebSiteHere.com');

I also created a history table to store the tweet identification numbers. Each tweet is assigned a unique number by twitter, and this is how you can access this tweet. I save this information so I can delete the tweets later using this number. I have included a short script for deleting tweets near the end of this post.

CREATE TABLE 'history' (
  'id' int(11) NOT NULL AUTO_INCREMENT,
  'tweet' char(140) DEFAULT NULL,
  'tweet_id' varchar(30) DEFAULT NULL,
  'tweet_update' datetime DEFAULT NULL,
  PRIMARY KEY ('id')
) ENGINE=InnoDB AUTO_INCREMENT=1000032 DEFAULT CHARSET=latin1

You will need to register your application with twitter via apps.twitter.com, and obtain the following:

consumer_key
consumer_secret
access_token
access_token_secret

You will also need to register your mobile phone in order to link your twitter account to your application. I have not figured out how to use this script with someone else’s account, as the instructions for scripting Perl for use with twitter are not very thorough. I will try to add this at a later date.

Now that you have your application information and all of your tables created with data inserted, here is the Perl script for sending tweets. (You will need to install the necessary Perl modules that are used.)

#!/usr/bin/perl
 
use Net::Twitter::Lite::WithAPIv1_1;
use DBI;
use DBD::mysql;

my $Database = "tweets";

# ----------------------------------------------------------------------------------
# this has to be near the top - as other parts of the script rely on these figures
# ----------------------------------------------------------------------------------

my ($sec,$min,$hour,$mday,$mon,$year,$wday,$yday,$isdst) = localtime time;

$year = $year + 1900;
$mon = $mon + 1;

# add a zero if the value is less than 10

if ($sec < 10) { $sec = "0$sec"; }
if ($min < 10) { $min = "0$min"; }
if ($hour < 10) { $hour = "0$hour"; }
if ($mday < 10) { $mday = "0$mday"; }
if ($mon < 10) { $mon = "0$mon"; }
if ($year < 10) { $year = "0$year"; }
if ($wday < 10) { $wday = "0$wday"; }
if ($yday < 10) { $yday = "0$yday"; }
if ($isdst < 10) { $isdst = "0$isdst"; }

$DateTime = "$year-$mon-$mday $hour:$min:$sec";

# ----------------------------------------------------------------------------------
# retrieve tweet from database
# ----------------------------------------------------------------------------------

     $dbh = ConnectToMySql($Database);
     $query = "select id, tweet, last_tweet_date, tweet_count FROM tweets order by last_tweet_date, id limit 1";	
     $sth = $dbh->prepare($query);
     $sth->execute();
    
          while (@data = $sth->fetchrow_array()) {
            
		 $id = $data[0];
		 $tweet = $data[1];
		 $last_tweet_date = $data[2];
		 $tweet_count = $data[3];
	}

$tweet_original = $tweet;

# ----------------------------------------------------------------------------
# find tildes ~ and substitute for carriage return
# find carats and substitue for single quote
# ----------------------------------------------------------------------------

$tweet =~ s/~/\n/g;
$tweet =~ s/\^/\'/g;

# ----------------------------------------------------------------------------------
# check length of tweet
# ----------------------------------------------------------------------------------

$tweet_length = length($tweet);

if (length($tweet) > 140)

{
	print "Error - tweet is longer than 140 characters\n";
	exit;
}

# add to the tweet count
$tweet_count++;

# ----------------------------------------------------------------------------
# send tweet
# ----------------------------------------------------------------------------

my $nt = Net::Twitter::Lite::WithAPIv1_1->new(
      traits              => [qw/API::RESTv1_1/],
      consumer_key        => "$consumer_key",
      consumer_secret     => "$consumer_secret",
      access_token        => "$access_token",
      access_token_secret => "$access_token_secret",
      ssl                 => 1
);

my $results = eval { $nt->update("$tweet") };
 
  if ( my $err = $@ ) {
      die $@ unless blessed $err && $err->isa('Net::Twitter::Lite::Error');

      warn "HTTP Response Code: ", $err->code, "\n",
           "HTTP Message......: ", $err->message, "\n",
           "Twitter error.....: ", $err->error, "\n";
  } 

# ----------------------------------------------------------------------------
# update mysql with new date for last_tweet date/time
# ----------------------------------------------------------------------------

$dbh = ConnectToMySql($Database);
$query = "UPDATE tweets SET last_tweet_date = '$DateTime' , tweet_count = '$tweet_count' , tweet_length = '$tweet_length' where id = '$id'";
$sth = $dbh->prepare($query);
$sth->execute();

# ----------------------------------------------------------------------------
# get the status id of the last tweet
# ----------------------------------------------------------------------------

my $statuses = $nt->user_timeline({ user => "2044_The_Book", count=> 1 });

for my $status ( @$statuses ) {
	$tweet_id = "$status->{id}";
}

if ( my $err = $@ ) {
      die $@ unless blessed $err && $err->isa('Net::Twitter::Lite::Error');

      warn "HTTP Response Code: ", $err->code, "\n",
           "HTTP Message......: ", $err->message, "\n",
           "Twitter error.....: ", $err->error, "\n";
} 

# ----------------------------------------------------------------------------
# replace special characters
# ----------------------------------------------------------------------------

$tweet =~ s/\\\n/~/g;
$tweet =~ s/\'/^/g;

# update mysql with new date for last_tweet date/time

$dbh = ConnectToMySql($Database);	
$query = "insert into history (tweet,tweet_id,tweet_update) values ('$tweet_original','$tweet_id','$DateTime')";
$sth = $dbh->prepare($query);
$sth->execute();

#----------------------------------------------------------------------
sub ConnectToMySql {
#----------------------------------------------------------------------

   my ($db) = @_;

   open(PW, "<..\/accessTweets") || die "Can't access login credentials";
   my $db= <PW>;
   my $host= <PW>;
   my $userid= <PW>;
   my $passwd= <PW>;

   chomp($db);
   chomp($host);
   chomp($userid);
   chomp($passwd);
   
   my $connectionInfo="dbi:mysql:$db;$host:3306";
   close(PW);

   # make connection to database
   my $l_dbh = DBI->connect($connectionInfo,$userid,$passwd);
   return $l_dbh;

}

In the subroutine ConnectToMySql, I store the MySQL login credentials in a text file one directory below where my Perl script is located. This file contains the following information:

database_name
hostname or IP
MySQL user name
password

You can instead include your information inside the file if you prefer.

If you want to delete your tweets, you can create a script to access the tweets in your history table, and then delete them one at a time. Here is an example without the database connections:

#!/usr/bin/perl
 
use Net::Twitter::Lite::WithAPIv1_1;
use DBI;
use DBD::mysql;

# ----------------------------------------------------------------------------
# delete tweet
# ----------------------------------------------------------------------------

# replace the values for $consumer_key $consumer_secret $access_token $access_token_secret
# with your values for your application

my $nt = Net::Twitter::Lite::WithAPIv1_1->new(
      consumer_key        => "$consumer_key",
      consumer_secret     => "$consumer_secret",
      access_token        => "$access_token",
      access_token_secret => "$access_token_secret",
      ssl                 => 1,
	 );

my $statuses = $nt->destroy_status({ id => "$tweet_id" });

exit;

Be sure to replace the value of $tweet_id with the value from the tweet you want to delete.

That’s it for now. Hopefully this was fun, interesting, and even useful! Thank you for using MySQL!


Tony Darnell is a Principal Sales Consultant for MySQL, a division of Oracle, Inc. MySQL is the world’s most popular open-source database program. Tony may be reached at info [at] ScriptingMySQL.com and on LinkedIn.

PlanetMySQL Voting: Vote UP / Vote DOWN

MySQL Incremental Backup - Point In Time Backup and Recovery of InnoDB and MyIsam Databases

$
0
0
Mysql Incremental Backup is a complete incremental backup script for MyISAM and InnodB databases using the MySQL binary log so that the backup process does not affect running databases. This tutorial describes the installation of the MysqlIncrementalBackup script and helps to troubleshoot issues that may arise during setup.
PlanetMySQL Voting: Vote UP / Vote DOWN

5 Ways To Reduce Database Infrastructure Costs

$
0
0

Are your databases more costly than they need to be? If you’re not sure, this webinar will show you how to find out, quickly and easily, with KPIs that indicate overprovisioning or opportunity for driving more efficiency from your databases. If there is an opportunity to run your databases at lower cost, you’ll find out how to identify which of 5 key areas offer the biggest chances for improvement, and a specific action plan to get results fast.

The key topics you’ll learn are:

  • Evaluating your current efficiency.
  • Determining if there’s an opportunity to lower your database costs.
  • Five simple steps to achieve maximum cost efficiency from your databases: query efficiency, consolidation, reduction of diversity, right-sizing, and cloud computing. For each step you’ll learn how to find out whether it applies to your situation, and how to take action on it.

After this webinar, you’ll understand how to measure, assess, and sometimes lower the cost of your database infrastructure by up to 50%.

About the Presenter

Baron Schwartz is VividCortex’s founder and CEO. He is one of the world’s leading experts on MySQL, and has helped build and scale some of the largest web, social, gaming, and mobile properties. He is the author of High Performance MySQL and a variety of open-source software, and is highly regarded in the MySQL open-source community. Baron is a software engineer by training and a database expert out of love for the technology. He speaks widely on databases, open source, and engineering excellence.


PlanetMySQL Voting: Vote UP / Vote DOWN

Press Release: Severalnines creates programmable DevOps platform to manage leading open source databases

$
0
0

New ClusterControl release includes customisation language for management and automation

 
Stockholm, Sweden and anywhere else in the world - 27 MAY 2015 - Severalnines, the provider of database infrastructure management software, today launched the latest version of its ClusterControl platform. This database automation product cuts down time for businesses to deploy, monitor, manage and scale multiple open source databases. With this latest release, Severalnines is helping database and system administrators take full control of their database resources.  

Management of databases is increasing in complexity as companies need to meet higher uptime requirements for their data, plus provide security when it is distributed across public/private clouds in a diverse, virtualised infrastructure. Customisation of management tools with simple parameters will not work as database environments become more complex.

ClusterControl now offers users the ability to create their own custom programs, also called advisors, to automate more tasks and increase productivity via an Integrated Developer Studio. Advisors are mini-programs that provide advice on how to address issues in areas such as database performance, security, scalability, configuration and capacity planning. This new programmable platform also builds the foundation for the ClusterControl advisors architecture. 
 
The new ClusterControl and its Developer Studio allow IT professionals to: 

  • Test and secure databases with security audits
  • Dynamically tune any database configuration with custom built advisors
  • Use predictive analytics to calculate compute, storage and network capacity at any time
  • Automatically install and setup programs remotely on a host server

For additional details about the release:

 
Here are the new product specification details:
 
ClusterControl DSL (Domain Specific Language): ClusterControl DSL, allows IT administrators to extend the functionality of the ClusterControl platform by creating advisors. With its syntax based on JavaScript (JS), ClusterControl DSL can execute SQL statements, run shell commands across all cluster hosts and retrieve results for advisors to process.
 
Integrated Developer Studio: The ClusterControl Developer Studio provides a simple and appealing development environment to quickly create, edit, compile, run, test, debug and schedule your JavaScript programs.
 
Advisors: Advisors in ClusterControl provide specific advice on how to address database issues such as performance, security, log management and configuration. This advice can range from setting up a simple alert system to a complex prediction engine for cluster-wide automation. For community ClusterControl users, a set of open source advisors are available under an MIT licence on GitHub.
 
Vinay Joosery, Co-Founder and CEO of Severalnines said: “ClusterControl’s programming environment is like an open system that gives real-time access to the entire database infrastructure, from workload metrics to configuration files, logs and even direct access to the complete Linux BASH environment of the hosts. With the latest release of ClusterControl, we’re allowing IT to control their database environment in ways that was previously difficult to accomplish, or even outright impossible.”
 
Alexander Yu, Vice President of Products, added: “Our language is effective for flexible automation and programming. IT teams can use mathematical and statistical functions to act on time series data sets, execute remote commands on their cluster hosts and run SQL statements across their servers. Sticking to our community ethos, the advisors we make available are under an open source MIT licence, so users can either improve our work or create their own.”

The new ClusterControl will be presented by Johan Andersson, CTO at Severalnines, during a live demo session on June 9th; users can register here.


About Severalnines

Severalnines provides automation and management software for database clusters. We help companies deploy their databases in any environment, and manage all operational aspects to achieve high-scale availability.

Severalnines' products are used by developers and administrators of all skills levels to provide the full 'deploy, manage, monitor, scale' database cycle, thus freeing them from the complexity and learning curves that are typically associated with highly available database clusters. The company has enabled over 7,000 deployments to date via its popular online database configurator. Currently counting BT, Orange, Cisco, CNRS, Technicolor, AVG, Ping Identity and Paytrail as customers.  Severalnines is a private company headquartered in Stockholm, Sweden with offices in Singapore and Tokyo, Japan. To see who is using Severalnines today visit, http://www.severalnines.com/company.


Blog category:


PlanetMySQL Voting: Vote UP / Vote DOWN

Percona XtraBackup 2.2.11 is now available

$
0
0

Percona XtraBackup for MySQL Percona is glad to announce the release of Percona XtraBackup 2.2.11 on May 28, 2015. Downloads are available from our download site or Percona Software Repositories.

Percona XtraBackup enables MySQL backups without blocking user queries, making it ideal for companies with large data sets and mission-critical applications that cannot tolerate long periods of downtime. Offered free as an open source solution, Percona XtraBackup drives down backup costs while providing unique features for MySQL backups.

New Features:

  • Percona XtraBackup has been rebased on MySQL 5.6.24.

Bugs Fixed:

  • Version check would crash innobackupex and abort the backup on CentOS 5. Bug fixed #1255451.
  • Percona XtraBackup could crash when preparing the backup taken on MySQL/Percona Server 5.5 if there were open temporary tables during the backup. Bug fixed #1399471 (Fungo Wang).
  • Percona XtraBackup would fail to prepare the backup if the xtrabackup_logfile was lager than 512GB. Bug fixed #1425269.
  • Fix for bug #1403237 was incomplete, due to setting wrong offset last copied batch of log records was copied from wrong location. Bug fixed #1448447.
  • Percona XtraBackup now executes an extra FLUSH TABLES before executing FLUSH TABLES WITH READ LOCK to potentially lower the impact from FLUSH TABLES WITH READ LOCK. Bug fixed #1277403.
  • Regression introduced by fixing #1436793 in Percona XtraBackup 2.2.10 caused an error when taking an incremental backup from MariaDB 10. Bug fixed #1444541.
  • Percona XtraBackup now prints and stores the file based binlog coordinates in xtrabackup_binlog_info even though GTID is enabled. Bug fixed #1449834.
  • Percona XtraBackup doesn’t print warnings anymore during the prepare phase about missing tables when a filtering option (--databases, --tables, etc.) is provided. Bug fixed #1454815 (Davi Arnaut).

Other bugs fixed: #1415191.

Release notes with all the bugfixes for Percona XtraBackup 2.2.11 are available in our online documentation. Bugs can be reported on the launchpad bug tracker. Percona XtraBackup is an open source, free MySQL hot backup software that performs non-blocking backups for InnoDB and XtraDB databases.

The post Percona XtraBackup 2.2.11 is now available appeared first on MySQL Performance Blog.


PlanetMySQL Voting: Vote UP / Vote DOWN

Workload Analysis with MySQL's Performance Schema

$
0
0

Earlier this spring, we upgraded our database cluster to MySQL 5.6. Along with many other improvements, 5.6 added some exciting new features to the performance schema.

MySQL's performance schema is a set of tables that MySQL maintains to track internal performance metrics. These tables give us a window into what's going on in the database—for example, what queries are running, IO wait statistics, and historical performance data.

One of the tables added to the performance schema in 5.6 is table_io_waits_summary_by_index. It collects statistics per index, on how many rows are accessed via the storage engine handler layer. This table already gives us useful insights into query performance and index use. We also import this data into our metrics system, and displaying it over time has helped us track down sources of replication delay. For example, our top 10 most deviant tables:

top 10 most deviant update queries

MySQL 5.6.5 features another summary table: events_statements_summary_by_digest. This table tracks unique queries, how often they're executed, and how much time is spent executing each one. Instead of SELECT id FROM users WHERE login = 'zerowidth', the queries are stored in a normalized form: SELECT `id` FROM `users` WHERE `login` = ?, so it's easy to group queries by how they look than by the raw queries themselves. These query summaries and counts can answer questions like "what are the most frequent UPDATES?" and "What SELECTs take the most time per query?".

When we started looking at data from this table, several queries stood out. As an example, a single UPDATE was responsible for more than 25% of all updates on one of our larger and most active tables, repositories: UPDATE `repositories` SET `health_status` = ? WHERE `repositories` . `id` = ?. This column was being updated every time a health status check ran on a repository, and the code responsible looked something like this:

class Repository
  def update_health_status(new_status)
    update_column :health_status, new_status
  end
end

Just to be sure, we used scientist to measure how often the column needed to be updated (had the status changed?) versus how often it was currently being touched:

health status update % required

The measurements showed what we had expected: the column needed to be updated less than 5% of the time. With a simple code change:

class Repository
  def update_health_status(new_status)
    if new_status != health_status
      update_column :health_status, new_status
    end
  end
end

The updates from this query now represent less than 2% of all updates to the repositories table. Not bad for a two-line fix. Here's a graph from VividCortex, which shows query count data graphically:

vividcortex screenshot showing drop in update query volume

GitHub is a 7-year-old rails app, and unanticipated hot spots and bottlenecks have appeared as the workload's changed over time. The performance schema has been a valuable tool for us, and we can't encourage you enough to check it out for your app too. You might be surprised at the simple things you can change to reduce the load on your database!

Here's an example query, to show the 10 most frequent UPDATE queries:

SELECT
  digest_text,
  count_star / update_total * 100 as percentage_of_all
FROM events_statements_summary_by_digest,
( SELECT sum(count_star) update_total
  FROM events_statements_summary_by_digest
  WHERE digest_text LIKE 'UPDATE%'
) update_totals
WHERE digest_text LIKE 'UPDATE%'
ORDER BY percentage_of_all DESC
LIMIT 10

PlanetMySQL Voting: Vote UP / Vote DOWN

#DBHangOps 05/28/15 -- Deep Engine and more!

$
0
0

#DBHangOps 05/28/15 -- Deep Engine and more!

Hello everybody!

Join in #DBHangOps this Thursday, May, 28, 2015 at 11:00am pacific (19:00 GMT), to participate in the discussion about:

  • Deep Engine presentation by Mike Skubisz! (Come with questions!)
  • What does being a DBA mean to you?
    • What are your expectations of a DBA?
  • What's the last thing you automated and why?

You can check out the event page at https://plus.google.com/events/cgomeasl8m4fr47tl25e74rvh9g on Thursday to participate.

As always, you can still watch the #DBHangOps twitter search, the @DBHangOps twitter feed, or this blog post to get a link for the google hangout on Thursday!

See all of you on Thursday!

You can catch a livestream at:

Show Notes

Deep Engine

  • Company was started about 4 years ago. Wanted to tackle the problem of scaling up modern database infrastructures as hardware has improved
  • Also wanted to tackle the science about the storage technology to improve things. Kudos to TokuDB with their Fractal Index work

Legacy Sciences

  • log files -- optimized for write optimized work loads
  • B+ Tree -- optimized for reads
  • LSM Tree -- write optimized
  • Typically engines are optimized to support specific workloads
    • read/write optimization
    • tree width/depth
  • Ultimately, a lot of these are very rigid in their implementations which is why there's so many options to use

Rethinking Sciences of Databases

  • can we redefine data structures during runtime to improve performance
    • Optimize key size and space usage on the fly
    • have storage algorithms be tolerant of these changes
    • dynamically changing page sizes
  • Continue to be ACID compliant while solving these storage challenges

CASSI: Adaptive Structure/Algorithm

  • Continuous Adaptive Sequential Summarization of Information
  • storage to disk doesn't use pages like other traditional storage engines. Data is written as append-only log files
    • DeepIS has some patented methods to avoid painful locking behavior while maintaining a denormalized copy of statistics for tables in their engine
    • You can effectively get a SELECT COUNT(*)... in constant time without added locking pain or full scans
  • DeepIS effectively treats their engine as a "Segmented column store"
    • There's multiple segments of individual parts of the total keyspace to support storing this data
    • How's this handle the issue where data wouldn't be uniformly distributed across keyspace?
      • The adaptive algorithm work in Deep Engine is what helps with this. In the background, data is re-organized/defragmented to help improve this.
      • Live data can still be manipulated while these background tasks are happening to improve data access
      • As a result of this, you don't need to worry about doing "OPTIMIZE TABLE" operations and such since the engine is always restructuring the underlying data.
      • In the directory on the filesystem, there's multiple files for each index and table data to support adaptive changes to the underlying storage objects.

CASSI Benefits

  • Secondary indexes have a pointer back to the primary index and to the actual data on disk
    • This sounds like a lot of I/O, both during writes and during normal (idle) operation
      • Disk flushing dynamically changes for grouping writes based on the velocity of writes coming into MySQL
      • Since there's a single data structure here (append-only file), grouping allows for coalescing of operations too
      • Write amplification of 1 since this isn't page-based storage
      • A lot of seeks (I/O operations!) are removed due to being append only
    • How's garbage collection handled since this is append only?
      • A statistic about a segment's level of fragmentation is kept. This allows for decisions to defragment a segment if it's getting to heavy.
      • Initial data is written uncompressed as well and then a segment re-write will compress it.
      • After defragment operations complete, older segments can be either archived, or purged and cleared out.
      • As a result of the append-only structure too, rollbacks are pretty cheap and can go to any point in time.
  • This sounds kinda like PBXT (https://mariadb.com/kb/en/mariadb/about-pbxt/)

Deep Engine

  • lightweight plug-and-play storage engine (~10MB) for MySQL.
  • designed as an alternative to InnoDB/XtraDB storage engines as an application/schema compatible storage engine
  • A lot of data about statistics are exposed via INFORMATION_SCHEMA
    • there's plans in the future to push data into PERFORMANCE_SCHEMA, but that's not present yet.
  • Were you able to break the single-core per query
    • DeepDB is still behind the MySQL optimizer, so that's pegged to a single core. Data retrieval can be parallelized in the storage engine, but isn't just yet.
  • How's this play along with MySQL replication
    • At present, there's no changes to how replication works beyond the engine being able to persist data pretty quickly
    • Replication lag may be lower since the engine is faster at writing data in due to the append-only structure)
  • Backups
    • Since everything is an append-only structure, you can use normal filesystem tools to backup (e.g. rsync)
    • Even with multiple files for indexes and data, the engine should be able to rebuild them up to the newest checkpoint. Recovery mode should be pretty quick based on the velocity of data that came in.
  • Feel free to grab a development version and mess around with the engine at http://deepis.com/downloads!

PlanetMySQL Voting: Vote UP / Vote DOWN

Rearchitecting GitHub Pages

$
0
0

GitHub Pages, our static site hosting service, has always had a very simple architecture. From launch up until around the beginning of 2015, the entire service ran on a single pair of machines (in active/standby configuration) with all user data stored across 8 DRBD backed partitions. Every 30 minutes, a cron job would run generating an nginx map file mapping hostnames to on-disk paths.

There were a few problems with this approach: new Pages sites did not appear until the map was regenerated (potentially up to a 30-minute wait!); cold nginx restarts would take a long time while nginx loaded the map off disk; and our storage capacity was limited by the number of SSDs we could fit in a single machine.

Despite these problems, this simple architecture worked remarkably well for us — even as Pages grew to serve thousands of requests per second to over half a million sites.

When we started approaching the storage capacity limits of a single pair of machines and began to think about what a rearchitected GitHub Pages would look like, we made sure to stick with the same ideas that made our previous architecture work so well: using simple components that we understand and avoiding prematurely solving problems that aren't yet problems.

The new infrastructure

The new Pages infrastructure has been in production serving Pages requests since January 2015 and we thought we'd share a little bit about how it works.

architecture diagram

Frontend tier

After making it through our load balancers, incoming requests to Pages hit our frontend routing tier. This tier comprises a handful of Dell C5220s running nginx. An ngx_lua script looks at the incoming request and makes a decision about which fileserver to route it to. This involves querying one of our MySQL read replicas to look up which backend storage server pair a Pages site has been allocated to.

Once our Lua router has made a routing decision, we just use nginx's stock proxy_pass feature to proxy back to the fileserver. This is where ngx_lua's integration with nginx really shines, as our production nginx config is not much more complicated than:

location / {
  set $gh_pages_host "";
  set $gh_pages_path "";

  access_by_lua_file /data/pages-lua/router.lua;

  proxy_set_header X-GitHub-Pages-Root $gh_pages_path;
  proxy_pass http://$gh_pages_host$request_uri;
}

One of the major concerns we had with querying MySQL for routing is that this introduces an availability dependency on MySQL. This means that if our MySQL cluster is down, so is GitHub Pages. The reliance on external network calls also adds extra failure modes — MySQL queries performed over the network can fail in ways that a simple in-memory hashtable lookup cannot.

This is a tradeoff we accepted, but we have mitigations in place to reduce user impact if we do have issues. If the router experiences any error during a query, it'll retry the query a number of times, reconnecting to a different read replica each time. We also use ngx_lua's shared memory zones to cache routing lookups on the pages-fe node for 30 seconds to reduce load on our MySQL infrastructure and also allow us to tolerate blips a little better.

Since we're querying read replicas, we can tolerate downtime or failovers of the MySQL master. This means that existing Pages will remain online even during database maintenance windows where we have to take the rest of the site down.

We also have Fastly sitting in front of GitHub Pages caching all 200 responses. This helps minimise the availability impact of a total Pages router outage. Even in this worst case scenario, cached Pages sites are still online and unaffected.

Fileserver tier

The fileserver tier consists of pairs of Dell R720s running in active/standby configuration. Each pair is largely similar to the single pair of machines that the old Pages infrastructure ran on. In fact, we were even able to reuse large parts of our configuration and tooling for the old Pages infrastructure on these new fileserver pairs due to this similarity.

We use DRBD to sync Pages site data between the two machines in each pair. DRBD lets us synchronously replicate all filesystem changes from the active machine to the standby machine, ensuring that the standby machine is always up to date and ready to take over from the active at a moment's notice — say for example if the active machine crashes or we need to take it down for maintenance.

We run a pretty simple nginx config on the fileservers too - all we do is set the document root to $http_x_github_pages_root (after a little bit of validation to thwart any path traversal attempts, of course) and the rest just works.

Wrapping up

Not only are we now able to scale out our storage tier horizontally, but since the MySQL routing table is kept up to date continuously, new Pages sites are published instantly rather than 30 minutes later. This is a huge win for our customers. The fact that we're no longer loading a massive pre-generated routing map when nginx starts also means the old infrastructure's cold-restart problem is no longer an issue.

response times

We've also been really pleased with how ngx_lua has worked out. Its performance has been excellent — we spend less than 3ms of each request in Lua (including time spent in external network calls) at the 98th percentile across millions of HTTP requests per hour. The ability to embed our own code into nginx's request lifecycle has also meant that we're able to reuse nginx's rock-solid proxy functionality rather than reinventing that particular wheel on our own.


PlanetMySQL Voting: Vote UP / Vote DOWN

VividCortex Sponsoring MongoDB Open House Hosted by Percona

$
0
0

Fellow lovers of tech,

We are pumped to sponsor the MongoDB Open House hosted by Percona. The event will be across the street from MongoDB World at the New York Hilton Midtown on June 1st so make plans quickly.

It is free and all are welcome.

Below are featured talks:

  • “MATH is Hard: TTL Index Configuration and Considerations,” by Kim Wilkins of Rackspace
  • “Implementing MongoDB 3.0 Storage Engine,” with Facebook’s Igor Canadi and Christian Rober of Percona
  • “Is it Fast: Measuring MongoDB Performance,” by Tim Callaghan of Acme Benchmarking
  • “MongoDB for MySQL Users,” by Percona’s Alexander Rubin
  • “Rolling out RocksDB in Production,” by Charity Majors of Facebook
  • “Percona TokuMX and Percona TokuMXSE Performance Benefits,” by Percona’s Jon Tobin

If that wealth of expertise and knowledge is not enough to convince you, there will also be free t-shirts, food, drinks and prizes.

Register here, and see you there!

Also, stay tuned for exciting news from us around the time of the event.


PlanetMySQL Voting: Vote UP / Vote DOWN
Introducing ClusterControl Developer Studio and Creating your own Advisors in JavaScript

$
0
0

Developer Studio.. JavaScript.. ClusterControl DSL.. database clusters.. huh? what the heck is going on here? This might seem like a mix up of random tech terms, but it’s really a pretty cool feature that we’ve just released.  

With ClusterControl 1.2.10, we introduced our new, powerful ClusterControl DSL (Domain Specific Language), which allows you to extend the functionality of your ClusterControl platform by creating Advisors, Auto Tuners, or “mini Programs”. The DSL syntax is based on JavaScript, with extensions to provide access to ClusterControl’s internal data structures and functions. The DSL allows you to execute SQL statements, run shell commands/programs across all your cluster hosts, and retrieve results to be processed for advisors/alerts or any other actions.

Join us for the 1.2.10 release webinar held by Johan Andersson, our CTO, on Tuesday June 9th to see it in action. There’ll be a live demo of the new ClusterControl and a Questions & Answers session. 

In the meantime, this blog shows you what our new Developer Studio is all about!

So, you can create these advisors right within your web browser using our Developer Studio. The ClusterControl Developer Studio is a simple and elegant development environment to quickly create, edit, compile, run, test, debug and schedule your JavaScript programs.

What are Advisors?

Advisors in ClusterControl are powerful constructs; they provide specific advice on how to address issues in areas such as performance, security, log management, configuration, storage space, etc. They can be anything from simple configuration advice, warning on thresholds or more complex rules for predictions, or even cluster-wide automation tasks based on the state of your servers or databases. 

ClusterControl comes with a set of basic advisors that include rules and alerts on security settings, system checks (NUMA, Disk, CPU), queries, innodb, connections, performance schema, Galera configuration, NDB memory usage, and so on. The advisors are open source under an MIT license, and available on GitHub. Through the Developer Studio, it is easy to import new advisors as a JS bundle, or export your own for others to try out.


Installation

You can install ClusterControl on a dedicated VM using the following:

$ wget http://www.severalnines.com/downloads/cmon/install-cc
$ chmod +x install-cc
# as root or sudo user
$ ./install-cc

For more information on system requirements, etc., please see http://www.severalnines.com/getting-started.


Developer Studio interface

Developer Studio is available under Manage -> Developer Studio. 

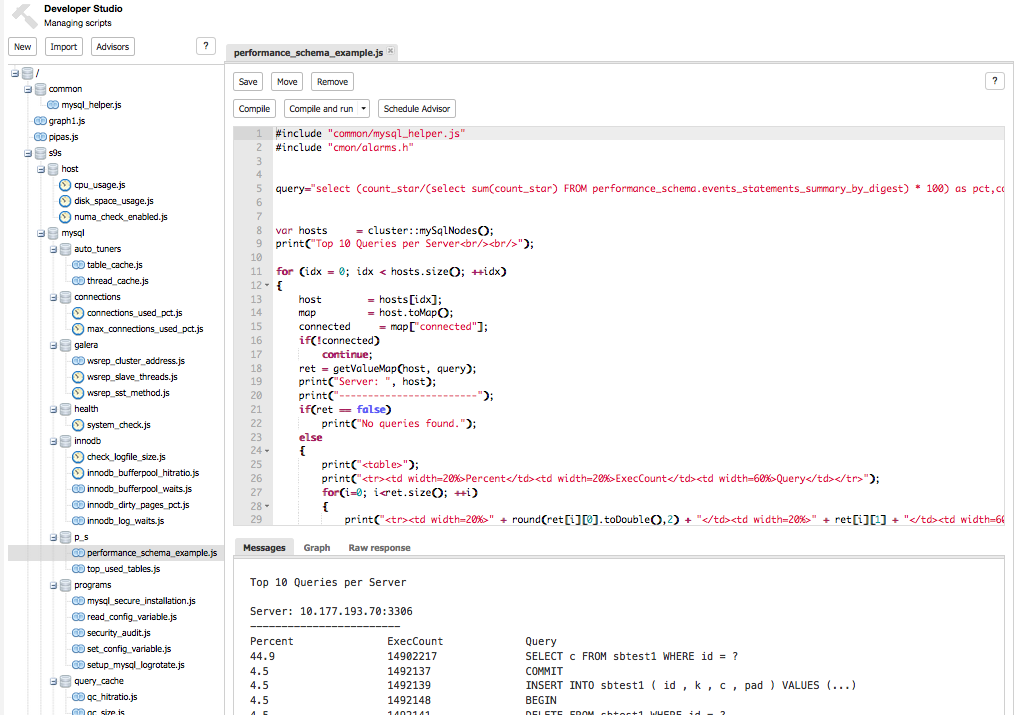
On the left panel, you will see a list of scripts (or Advisors) that are available. These are written in a JavaScript-like language. ClusterControl comes with a default set of Advisors, but you can also create your own Advisors, or import new ones. 
Let’s try to open one of the scripts that are bundled with ClusterControl.

In the right hand panel, you will see a couple of buttons that allow you to:

  • save the file
  • move it around between different subdirectories
  • remove it completely 
  • compile the script 
  • compile and run 
  • schedule it as an advisor.

The arrow next to the “Compile and Run” button allows us to change settings for a script and, for example, pass some arguments to the main() function.

What does a script look like?

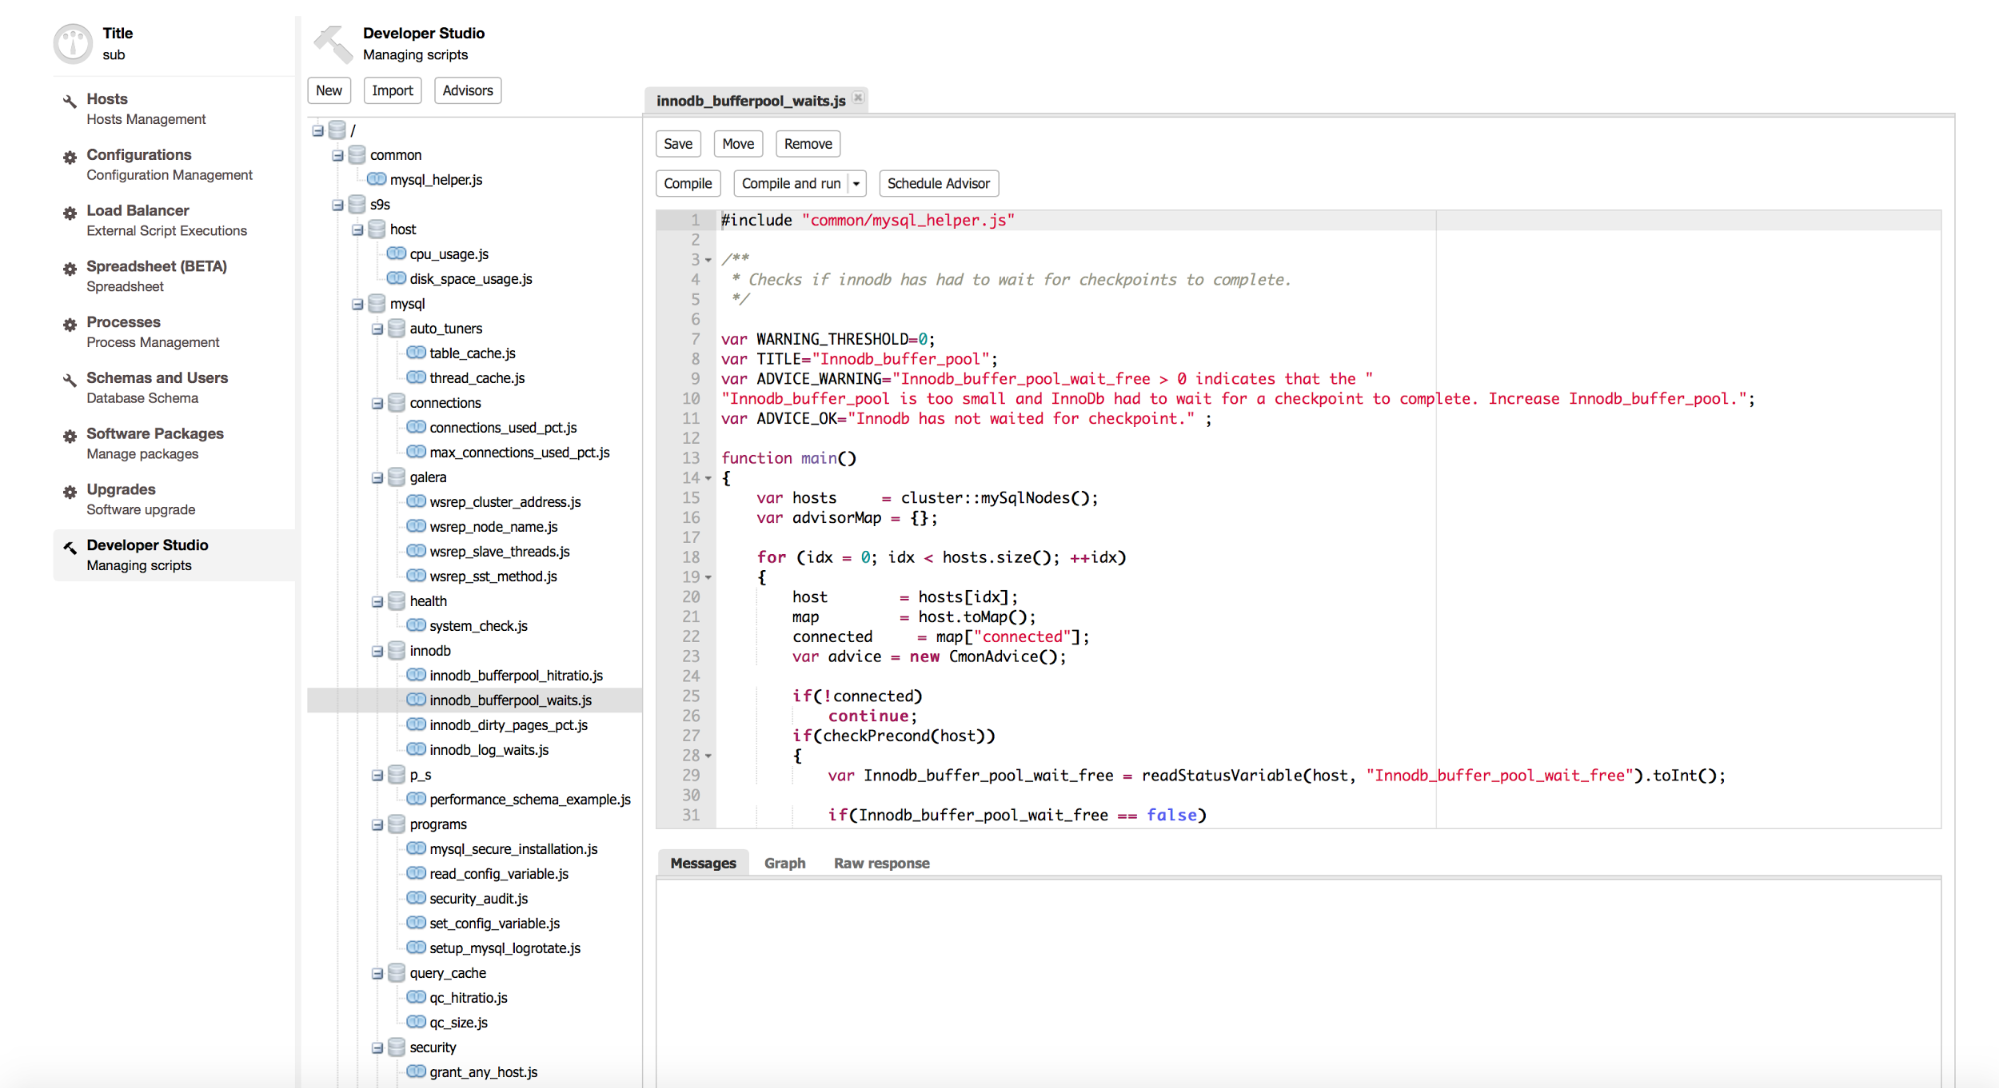
Now, let’s see what a script looks like. Our example script checks if innodb has had to wait for checkpoints to complete. Once we are happy with the script, we can schedule it as an advisor.

We define a threshold for this check and some messages that will be used by an advisor, depending on whether the check passes or raises a warning.

#include "common/mysql_helper.js"
#include "cmon/alarms.h"

/**
 * Checks if innodb has had to wait for checkpoints to complete.
 */
 
var WARNING_THRESHOLD=0;
var TITLE="Innodb_buffer_pool";
var ADVICE_WARNING="Innodb_buffer_pool_wait_free > 0 indicates that the"
                   " Innodb_buffer_pool is too small and InnoDb had"
                   " to wait for a checkpoint to complete."
                   " Increase Innodb_buffer_pool.";
var ADVICE_OK="Innodb has not waited for checkpoint." ;

Then we have a main() function, where the main part of the script is located. We get the list of the MySQL nodes from ClusterControl. We also define advisorMap, which will be returned by main() function and used if we schedule this script to run as an advisor.

function main()
{
    var hosts     = cluster::mySqlNodes();
    var advisorMap = {};

Next, iterate through host array and prepare data structures for the main part.

    for (idx = 0; idx < hosts.size(); ++idx)
    {
        host        = hosts[idx];
        map         = host.toMap();
        connected     = map["connected"];
        var advice = new CmonAdvice();

Now, we are reading ‘Innodb_buffer_pool_wait_free’ status from the host and we store it into the variable.

        if(!connected)
            continue;
        if(checkPrecond(host))
        {
            var Innodb_buffer_pool_wait_free = readStatusVariable(host,  
                                          "Innodb_buffer_pool_wait_free").toInt();

We need to do a sanity check that we actually managed to get the data correctly, we also prepare another message that will be passed to the advisor.

            if(Innodb_buffer_pool_wait_free == false)
            {
                msg = "Not enough data to calculate";
            }
            justification = "Innodb_buffer_pool_wait_free = " +  
                                  Innodb_buffer_pool_wait_free;

Finally, the main check comes in - we test if the value collected passed the defined threshold or not, and set the result of the check accordingly.

            if(Innodb_buffer_pool_wait_free > WARNING_THRESHOLD)
            {
                advice.setSeverity(Warning);
                msg = ADVICE_WARNING;

            }
            else
            {
                advice.setSeverity(Ok);
                msg = ADVICE_OK;

            }
            advice.setJustification(justification);
        }
        else
        {
            msg = "Not enough data to calculate";
            advice.setSeverity(Ok);
        }

At the end, we need to prepare the data for the advisor and return it.

        advice.setHost(host);
        advice.setTitle(TITLE);
        advice.setAdvice(msg);
        advisorMap[idx]= advice;
    }
    return advisorMap;
}

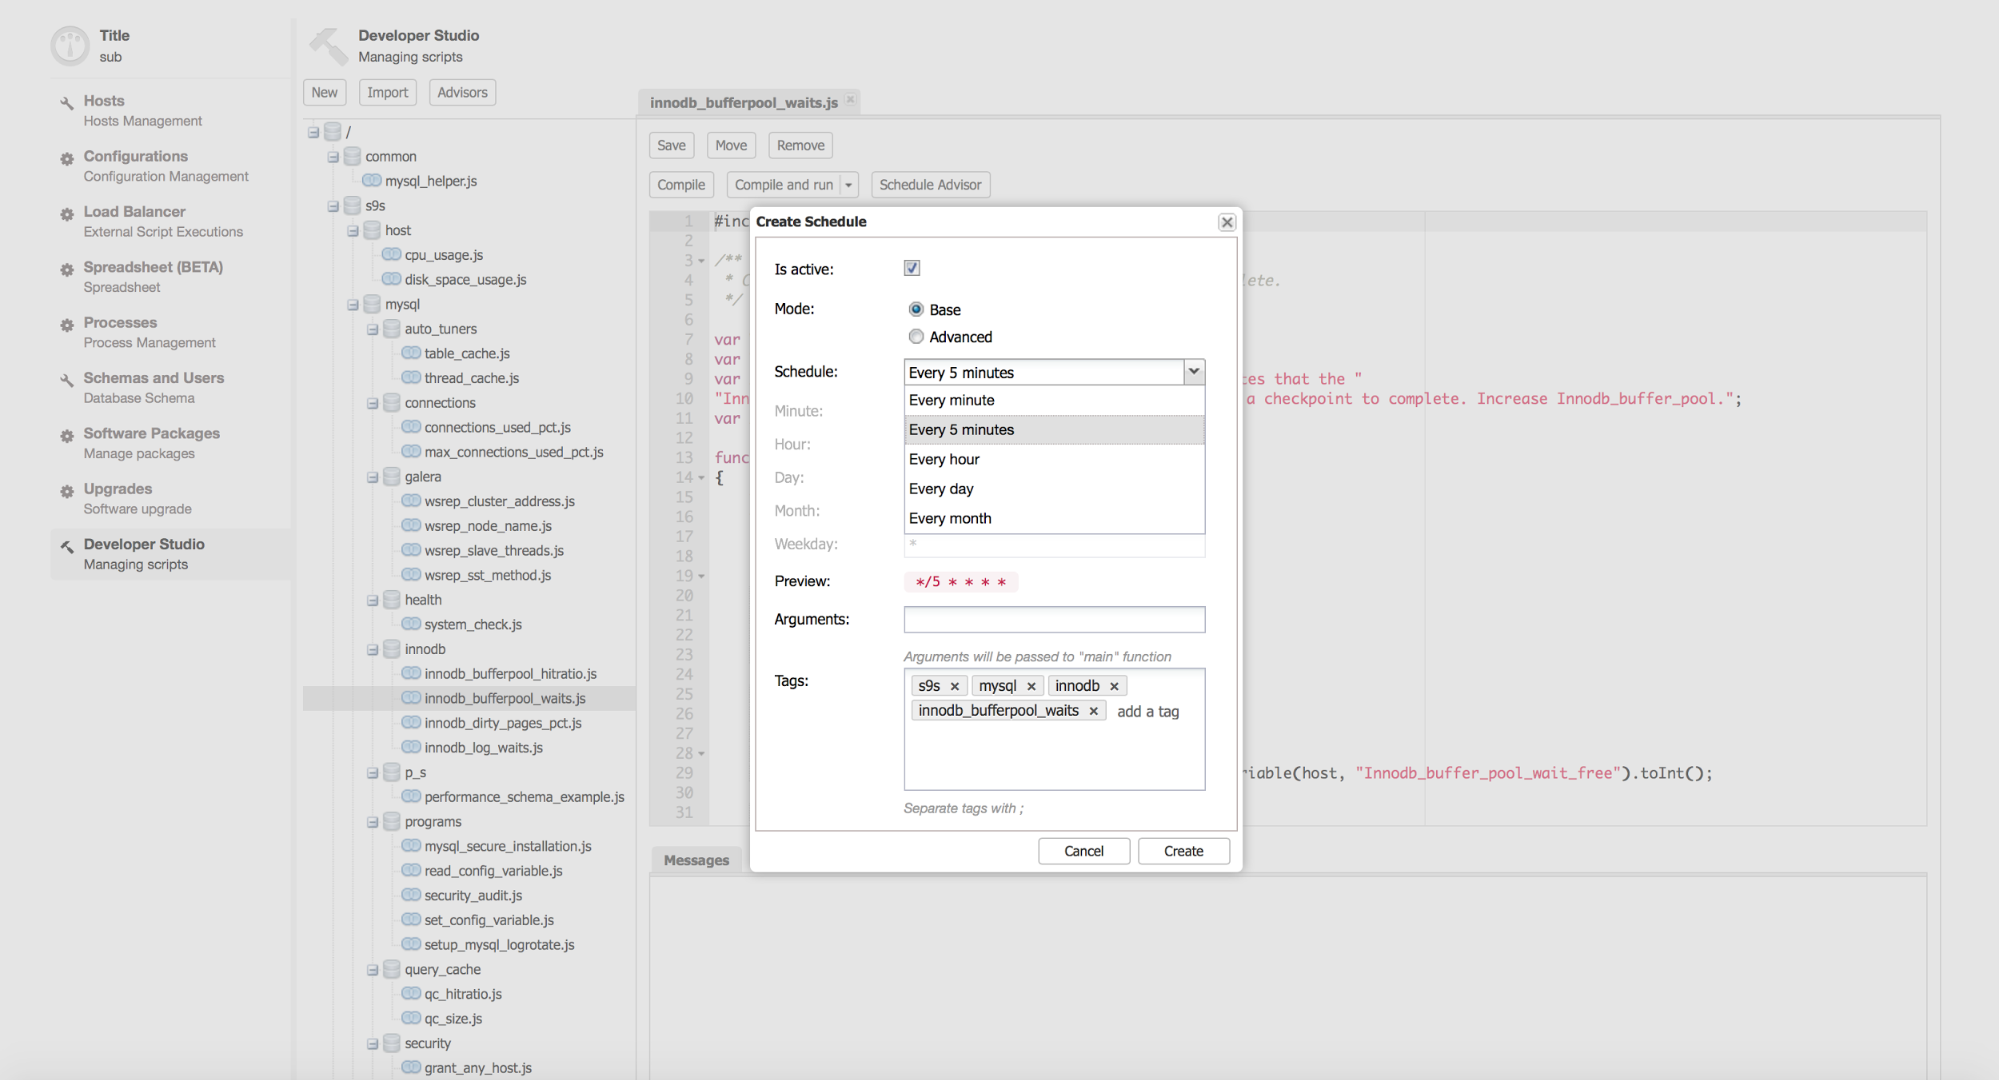
Should you want to use this script as an advisor, as mentioned earlier, you can do so by clicking on the ‘Schedule Advisor’ button. You can setup how often the given script will be executed using a cron job syntax:

The results of the executed advisors can be found by clicking the Advisors button, and also under Performance -> Advisors.

In this example we used the readStatusVariable() method but we can also use SQL to get interesting data directly from the MySQL instances. 
The following snippet checks if there are MySQL users allowed to access from any host. This time we use getValueMap() method to run an SQL statement on the given host. Then we can iterate over the result set and do some logic or just print the info as in this example.

        ret = getValueMap(host, "SELECT User,Host FROM mysql.user WHERE host='%'");
        if(ret == false)
            print(host, ": No problem detected.");
        else
        {
            for(i=0; i<ret.size(); ++i)
            {
                print(host, ": '" + ret[i][0] + 
                      "' is allowed to access from " + 
                      ret[i][1]) + ".";
            }
        }


Creating a new script

Let’s try to create a new file. First, we click on the “New” button.

In this example, we’ll get access to the ClusterControl statistics to watch the number of selects per second and raise an alert if needed. This script is based on the “Galera template” so once you create a new script, some of the skeleton code will be automatically included.

#include "common/mysql_helper.js"

/**
 * Checks the qps for selects 
 * 
 */ 
var WARNING_THRESHOLD=100;
var TITLE="Select QPS check";
function main()
{
    var hosts     = cluster::galeraNodes();
    var advisorMap = {};

    for (idx = 0; idx < hosts.size(); ++idx)
    {
        host        = hosts[idx];
        map         = host.toMap();
        connected     = map["connected"];
        var advice = new CmonAdvice();
        print(host);
        if(!connected)
            continue;
        if(checkPrecond(host))
        {
         // Get the current time
            var endTime   = CmonDateTime::currentDateTime();
            // set the start time to 10s ago 
            var startTime = endTime - 10; 
          // Get the sql stats
            var stats = host.sqlStats(startTime, endTime);
            // we are interested in COM_SELECT
            var select_arr     = stats.toArray("COM_SELECT");
     // and interval, to calculate per second average 
            var interval_arr    = stats.toArray("interval"); 
        
            //calculate sum of selects over the samples
            var com_select = sum(select_arr);      
            //calculate time period for a sample, ms -> s conversion       
            var interval = sum(interval_arr)/1000; 
         // calculate selects/s based on the time period length
            var com_select_qps = com_select / interval; 


            // uncomment this line to get the output in the Messages section below
            //print(host, ": ", com_select_qps); w
          

           if( com_select_qps > WARNING_THRESHOLD)
           {
               advice.setJustification("Number of selects per second is larger than " 
                                         + WARNING_THRESHOLD + ": " + com_select_qps);
               advice.setSeverity(1);
           }

           else
           {
               advice.setJustification("Number of selects per second is within”
                                       " limits (" + WARNING_THRESHOLD +" qps): " + 
                                       com_select_qps);
               advice.setSeverity(0);
           }

        }
        else
        {
            msg = "Not enough data to calculate";
            advice.setJustification("there is not enough load on"
                                    " the server or the uptime is too little.");
            advice.setSeverity(0);
        }
        advice.setHost(host);
        advice.setTitle(TITLE);
        //advice.setAdvice(msg);
        advisorMap[idx]= advice;
    }
    return advisorMap;
}

The new thing here, compared to the scripts we looked at earlier, is the way ClusterControl handles the statistics sampling - we can get them using:

stats = host.sqlStats(startTime, endTime); 

You can always check the whole data set by using:

print(stats);

Then we need to generate an array containing interesting data from the whole statistics, e.g., an array containing data for a particular interval.

            // we are interested in COM_SELECT
            var select_arr     = stats.toArray("COM_SELECT");
            // and interval, to calculate per second average
            var interval_arr    = stats.toArray("interval"); 

In general, the sampling in ClusterControl is based on intervals. The latest data is by default close to 4000ms, but it may change. As the data ages, it is aggregated and rolled up into intervals of tens of minutes or several hours. There may be multiple samples needed to cover the timeframe we want. Also, those samples may not cover it completely or may cover additional timeframe. That’s why we have to sum all of the data from all of the samples and then sum the interval (timeframe for a given sample). Then, finally, we can divide the sum of selects by the sum of intervals, convert the value from milliseconds to seconds to get the result of average selects per second.

            //calculate sum of selects over the samples
            var com_select = sum(select_arr); 
            //calculate time period for a sample, ms -> s conversion
            var interval = sum(interval_arr)/1000; 
            // calculate selects/s based on the time period length
            var com_select_qps = com_select / interval; 

The rest is what we saw in our earlier example - we compare the result with a defined threshold and build the advisor data accordingly.


How to execute commands on remote hosts?

ClusterControl DSL gives you the ability to execute commands on remote hosts using SSH connection. It shares ClusterControl’s access so it has the same privileges. The example below is not exactly designed to do anything useful, but it gives you an idea of how it works. 

#include "common/mysql_helper.js"

function main()
{
    var hosts     = cluster::galeraNodes();

    for (idx = 0; idx < hosts.size(); ++idx)
    {
        host        = hosts[idx];
        map         = host.toMap();
        connected     = map["connected"];
        var advice = new CmonAdvice();

        print("############## Host: " + host.toString() + " ##############");
        // Execute remote command and retrieve results
        retval = host.system("ifconfig  | grep eth0 -A 1 | awk 'match($0, /[0-9]{1,3}\.[0-9]{1,3}\.[0-9]{1,3}\.[0-9]{1,3}/) {print substr($0, RSTART, RLENGTH)}'");
        ip = retval['result'];
        print("IP collected from ifconfig: " + ip);
        print("Echoing ip to /tmp/ssh_js_ipaddr");
        // Create file on the remote host
        retval = host.system("echo '" + ip + "' > /tmp/ssh_js_ipaddr");
        // Check the status of the command
        print("Status of echo: " + retval);
        if (retval['success'] == true)
        {
            retval = host.system("cat /tmp/ssh_js_ipaddr");
            print("Output of cat /tmp/ssh_js_ipaddr: " + retval['result']);
            // Remove the file on remote server
            host.system("rm /tmp/ssh_js_ipaddr");
        }
        
        retval = host.system("ls -alh /tmp/ssh_js_ipaddr");
        print("We expect error here, /tmp/ssh_js_ipaddr"
              " should not exist by now" + retval);
        print(" ");
        
    }    
}

As you can see, we executed remote ifconfig, stored the result in a variable in our script, used that variable to modify data on the remote servers and finally removed the file on remote hosts.

Such options can be used to build all types of the scripts, starting from creating advisors based on some status counters accessible from the console, to scripts which would perform some kind of maintenance (custom-tailored backups for example). It may also be useful for periodical monitoring of some non-MySQL activity running in the background (let’s say for example, to check if pt-stalk created new files in its log directory or if it’s running at all).

As you can see, ClusterControl DSL and the Developer Studio gives you a significant number of additional options for customizing your monitoring patterns and build new ones, so you can extend ClusterControl to solve some specific challenges in your environment. We’d love to hear your opinion on this. 

Blog category:


PlanetMySQL Voting: Vote UP / Vote DOWN

Wrestling with bears or how I tamed Tungsten replicator

$
0
0
I just dove into Tungsten replicator very recently as I need to replicate from Amazon RDS to Redshift. I’d heard a lot of great things about Tungsten, but had yet to really dig my heels in. Join 28,000 others and follow Sean Hull on twitter @hullsean. I fetched the binary and began to dig through […]
PlanetMySQL Voting: Vote UP / Vote DOWN
Log Buffer #425: A Carnival of the Vanities for DBAs

$
0
0

This Log Buffer edition sheds light on the ongoing innovations and updates in the SQL Server, MySQL and Oracle realms.


Oracle:

  • Warning: standby redo logs not configured for thread – BUG
  • SLOB 2.3 is soon to be released. This version has a lot of new, important features but also a significant amount of tuning in the data loading kit.
  • Even in the highly volatile world of JavaScript frameworks, AngularJS is still very clearly leading the pack.
  • Are you Ready for the Leap Second?
  • Responsive UI is a big deal nowadays, when enterprise applications should run on different platforms and devices.

SQL Server:

  • Three SQL Server MVPs (Jonathan Kehayias, Ted Krueger and Gail Shaw) provide fascinating insight into the most common SQL Server problems, why they occur, and how they can be diagnosed using tools such as Performance Monitor, Dynamic Management Views and server-side tracing.
  • Retrieving a Binary File from Your Database.
  • This tip describes some T-SQL techniques for converting a mmddyyyy string to a SQL Server date, handling rows with missing date strings, and comparing converted date strings.
  • The PIVOT operator was added to the Transact-SQL language in SQL Server 2005. It allows you to turn your row data on its side, so it can be presented as column data.
  • Using the T-SQL PERCENTILE Analytic Functions in SQL Server 2000, 2005 and 2008.

MySQL:

  • Developer Studio.. JavaScript.. ClusterControl DSL.. database clusters.. huh? what the heck is going on here?
  • Percona XtraBackup 2.2.11 is now available
  • Are your databases more costly than they need to be? If you’re not sure, this webinar will show you how to find out, quickly and easily, with KPIs that indicate overprovisioning or opportunity for driving more efficiency from your databases.
  • MySQL Incremental Backup – Point In Time Backup and Recovery of InnoDB and MyIsam Databases
  • MySQL 5.7 key features.

Learn more about Pythian’s expertise in Oracle , SQL Server and MySQL.


PlanetMySQL Voting: Vote UP / Vote DOWN

VividCortex Adds Full-Screen Kiosk Mode

$
0
0

We’ve added a fullscreen (kiosk) mode to VividCortex, perfect for livestreaming a dashboard to a big monitor on your wall. Fullscreen mode uses native browser functionality to request fullscreen access, so there’s no need to try to hide your tab bar. Simply click the little icon in the top right corner of any screen:

fullscreen

The app will not only go into fullscreen mode but will hide all the “chrome” used for navigation. You will see a minimalistic header that just shows the time interval you’ve selected.

fullscreen

Naturally, you’ll want to start livestreaming before you fullscreen, so your monitor will refresh with updated data continually.

Enjoy!

And remember, VividCortex makes you look smart and shows off your good taste in database monitoring solutions.


PlanetMySQL Voting: Vote UP / Vote DOWN
Performance Schema … How to (Part1)

$
0
0

Performance Schema (PS) has been the subject of many, many recent discussions, presentations, and articles.  After its release in MySQL 5.7, PS has become the main actor for people who want to take the further steps in MySQL monitoring. At the same time, it has become clear that Oracle intends to make PS powerful with so many features and new instrumentation that old-style monitoring will begin to look like obsolete tools from the Stone Age.

This article will explain PS and provide guidance on what needs to be done in order to use it effectively.

What I am not going to do is to dig into specific performance issues or address polemics about what PS is and what, in a Utopian vision, it should be. I have seen too many presentations, articles and comments like this and they are not productive, nor are they in line with my target which is: keep people informed on how to do things EASILY.

For the scope of this article I will base my code mainly on version MySQL 5.7, with some digression to MySQL 5.6, if and when it makes sense.


Basic Concepts

Before starting the real how-to, it is my opinion that we must cover a few basic concepts and principles about PS. The primary goal of the Performance Schema is to measure (instrument) the execution of the server. A good measure should not cause any change in behavior. To achieve this, the overall design of the Performance Schema complies with the following, very severe design constraints:

  • The parser is unchanged. Also, there are no new keywords or statements. This guarantees that existing applications will run the same way with or without the Performance Schema.
  • All the instrumentation points return "void", there are no error codes. Even if the performance schema fails internally, execution of the server code will proceed.
  • None of the instrumentation points allocate memory. All the memory used by the Performance Schema is pre-allocated at startup, and is considered "static" during the server life time.
  • None of the instrumentation points use any pthread_mutex, pthread_rwlock, or pthread_cond (or platform equivalents). Executing the instrumentation point should not cause thread scheduling to change in the server.

In other words, the implementation of the instrumentation points, including all the code called by the instrumentation points is:

  • Malloc free
  • Mutex free
  • Rwlock free


Currently, there is still an issue with the usage of the LF_HASH, which introduces memory allocation, though a plan exists to be replace it with lock-free/malloc-free hash code table.

The observer should not influence the one observe. As such, the PS must be as fast as possible, while being less invasive. In cases when there are choices between:

Processing when recording the performance data in the instrumentation.

OR

Processing when retrieving the performance data.

Priority is given in the design to make the instrumentation faster, pushing some complexity to data retrieval.

Performance schema was designed while keeping an eye on future developments and how to facilitate the PS usage in new code. As such, to make it more successful, the barrier of entry for a developer should be low, so it is easy to instrument code. This is particularly true for the instrumentation interface. The interface is available for C and C++ code, so it does not require parameters that the calling code cannot easily provide, supports partial instrumentation (for example, instrumenting mutexes does not require that every mutex is instrumented). The Performance Schema instrument interface is designed in such a way that any improvement/additions in the future will not require modifications, as well as old instrumentation remaining unaffected by the changes.

The final scope for PS is to have it implemented in any plugin included in MySQL, although pretending to have them always using the latest version will be unrealistic in most cases. Given that the Performance Schema implementation must provide up to date support, within the same deployment, multiple versions of the instrumentation interface must ensure binary compatibility with each version.

The importance of flexibility means we may have conditions like:

  • Server supporting the Performance Schema + a storage engine that is instrumented.
  • Server supporting the Performance Schema + a storage engine that is not instrumented.
  • Server not supporting the Performance Schema + a storage engine that is instrumented.


Finally, we need to take in to account that the Performance Schema can be included or excluded from the server binary, using build time configuration options, with exposure in the compiling interface.

Performance Schema Interfaces

As mentioned above, PS can be excluded from code at the moment of the code compilation, thanks to the PS compile interface. This interface is one of seven that are present in PS. The full list is:

  • Instrument interface
  • Compiling interface
  • Server bootstrap interface
  • Server startup interface
  • Runtime configuration interface
  • Internal audit interface
  • Query interface

Instrument Interface:

This is the one that allows plugin implementers to add their instruments to PS. In general the interface is available for:

  • C implementations
  • C++ implementations
  • The core SQL layer (/sql)
  • The mysys library (/mysys)
  • MySQL plugins, including storage engines,
  • Third party plugins, including third party storage engines.


Compiling Interface:

As mentioned earlier, this is used during the build and will include or exclude PS code from the binaries.

Server Bootstrap Interface:

This is an internal private interface, which has the scope to provide access to the instructions demanded and create the tables for the PS itself.

Server Startup Interface:

This interface will expose options used with the mysqld command line or in the my.cnf, required to:

  • Enable or disable the performance schema.
  • Specify some sizing parameters.


Runtime Configuration Interface

This is one of the two most important interfaces for DBAs and SAs. It will allow the configuration of the PS at runtime. Using the methods expose by this interface, we will be able to configure what instruments, consumers, users and more we want to have active. This interface uses standard SQL and is very easy to access and use. Also, it is the preferred method to activate or deactivate instruments. Thus, when we start the server we should always enable the PS with all the instruments and consumers deactivated, and use this interface to choose only the ones we are interested in.

Internal Audit Interface:

The internal audit interface is provided to the DBA to inspect if the Performance Schema code itself is functioning properly. This interface is necessary because a failure caused while instrumenting code in the server should not cause failures in the MySQL server itself, and in turn the performance schema implementation never raises errors during runtime execution. To access the information a DBA just needs to issue the SHOW ENGINE PERFORMANCE SCHEMA STATUS; command.

Query Interface:

Lastly, this interface is the one that allows us to access the collected data, and to perform data filtering, grouping, join, etc. It will also allow access to a special table like the summary tables and digest, which will be discussed later on.

Consumers and Instruments

Another important concept in PS to understand is the difference between Instruments and Consumers.

Instruments:

Instruments are the ones collecting raw data where the calls are embedded in the code, such as:


MYSQL_TABLE_IO_WAIT(PSI_TABLE_FETCH_ROW, active_index, result,
    { result= index_prev(buf); })


In this case the code refers to the MYSQL_TABLE_IO_WAIT function declared in the handler.cc class (<mysql_root_code>/sql/handler.cc). If enabled in the compilation phase the above function will provide PS the information related to specific table io_wait.

The instruments demanded to manage that data collection is: wait/io/table/sql/handler.

The naming convention for the instruments is quite easy. The first part wait is the name of the Top-level Instrument component (list later), the second io is the observed condition, and table is the object.  The remaining suffix is referring to more specific plugin implementations and includes innodb, myisam, sql or names like IO_CACHE::append_buffer_lock. In the above example it refers to the Handler class in SQL tree.


Instruments are organized by top level components like:

  • Idle: An instrumented idle event. This instrument has no further components.
  • Memory: An instrumented memory event.
  • Stage: An instrumented stage event.
  • Statement: An instrumented statement event.
  • Transaction: An instrumented transaction event. This instrument has no further components.
  • Wait: An instrumented wait event.

 Each top level has an n number of instruments:


+-------------+------+
| name        | Numb |
+-------------+------+
| idle        |    1 |
| memory      |  367 |
| stage       |  117 |
| statement   |  191 |
| transaction |    1 |
| wait        |  297 |
+-------------+------+


We can and should keep in consideration that, it is best practice to enable only the instruments we may require for the time we need them. This can be achieved using the re-using the runtime interface (I will explain how exactly later on).

There exists official documentation (http://dev.mysql.com/doc/refman/5.7/en/performance-schema-instrument-naming.html) providing more detailed information about the list of what is available for each Top Component.

Consumers:

The Consumers are the destination of the data collected from the instruments. Consumers have different scope and timelines. Also, consumer like event statements has many different tables like:

  • Current
  • History
  • History long
  • Summaries (by different aggregation)
  • Summary Digest (like what we can find by processing the slow query log)

 Once more it is important to define what we are looking for and enable only what we need. For instance, if we need to review/identify the SQL with the most impacting, we should enable only the events_statements_current, events_statements_history and events_statements_summary_by_digest. All the other consumers can stay off. It is also important to keep in mind that each event may have a relation with another one. In this case, we will be able to navigate the tree relating the events using the fields EVENT_ID and NESTING_EVENT_ID where the last one is the EVENT_ID of the parent.

Pre-Filtering vs. Post-filtering

We are almost there, stay tight! Another important concept to understand is the difference between post and pre-filtering. As I mentioned, we can easily query the Consumer tables with SQL, we can create complex SQL to join tables and generate complex reports. But this can be quite heavy and resource consuming, especially if we want to dig on specific sections of our MySQL server.

In this case we can use the pre-filtering approach. The pre-filtering is basically a way to tell to PS to collect information ONLY from a specific source like user/IP (actors) or Object(s) like Tables, Triggers, Events, and Functions. The last one can be set at a general level or down to a specific object name.

The pre-filtering with the activation of the right instruments and consumer is a powerful way to collect the information without overloading the server with useless data. It is also very easy to implement given we just need to set the objects and/or actors in the setup tables as we like.


Rolling the Ball, Setup the PS for Observation as Start

Now that we have covered the basic concepts we can start to work on the real implementation.

Compile the Source Code:

As mentioned earlier, we can use the compile interface to include or exclude features from the code compilation. The available options are:

  • DISABLE_PSI_COND Exclude Performance Schema condition instrumentation
  • DISABLE_PSI_FILE Exclude Performance Schema file instrumentation
  • DISABLE_PSI_IDLE Exclude Performance Schema idle instrumentation
  • DISABLE_PSI_MEMORY Exclude Performance Schema memory instrumentation
  • DISABLE_PSI_METADATA Exclude Performance Schema metadata instrumentation
  • DISABLE_PSI_MUTEX Exclude Performance Schema mutex instrumentation
  • DISABLE_PSI_RWLOCK Exclude Performance Schema rwlock instrumentation
  • DISABLE_PSI_SOCKET Exclude Performance Schema socket instrumentation
  • DISABLE_PSI_SP Exclude Performance Schema stored program instrumentation
  • DISABLE_PSI_STAGE Exclude Performance Schema stage instrumentation
  • DISABLE_PSI_STATEMENT Exclude Performance Schema statement instrumentation
  • DISABLE_PSI_STATEMENT_DIGEST Exclude Performance Schema statement_digest instrumentation
  • DISABLE_PSI_TABLE Exclude Performance Schema table instrumentation

This level of detail is so granular that we can only include the things we are planning to use.

The positive aspect of doing so at the compilation level is that we will be sure no one will mess-up adding undesired instruments. The drawback is that if we change our mind and we decide we may need the ones we had excluded, we will have to compile the whole server again.

As a result, I would say that using this approach is not for someone that is just starting to use PS. Given you are still discovering what is there, it make sense to compile with all the features (default).

Configure PS in my.cnf:

To set the PS correctly in the my.cnf is quite important, so I strongly suggest disabling any instrument and consumer at the start-up. They can be enabled by the script later, and that would be much safer for a production database.

I normally recommend a section like the following:


performance_schema=1
performance_schema_events_waits_history_size=50
performance_schema_events_waits_history_long_size=15000
performance_schema_instrument='%=OFF'
performance_schema_consumer_events_stages_current=0
performance_schema_consumer_events_stages_history=0
performance_schema_consumer_events_stages_history_long=0
performance_schema_consumer_events_statements_current=0
performance_schema_consumer_events_statements_history=0
performance_schema_consumer_events_statements_history_long=0
performance_schema_consumer_events_transactions_current=0
performance_schema_consumer_events_transactions_history=0
performance_schema_consumer_events_transactions_history_long=0
performance_schema_consumer_events_waits_current=0
performance_schema_consumer_events_waits_history=0
performance_schema_consumer_events_waits_history_long=0
performance_schema_consumer_global_instrumentation=0
performance_schema_consumer_thread_instrumentation=0
performance_schema_consumer_statements_digest=0


The settings above will start the server with PS as “enabled”, but all the instruments and consumer will be OFF. Well, this is not entirely true, as for the moment of the writing (MySQL 5.7.7) once the PS is enabled the instruments related to memory/performance_schema are enabled regardless, which make sense given they are dedicated to monitor the memory utilization of PS.

A final note about the configuration is that we can decide to use the counting option of the instruments instead, capturing the latency time. To do so, we just have to declare it as: performance_schema_instrument='statement/sql/%=COUNTED'

In this case I had set that ALL the SQL statements should be counted.

Start Server and Set Only the Users We Need:

Once we have started our MySQL server, we are almost ready to go.

This is it, given we start it with NO instruments, we have to decide where to begin, and given we all know the most impacting factor in a database server is how we query it, we will start from there. In turn, analyzing what is going from the SQL point of view. Although, I want to catch the work coming from my application user, not from everywhere. Given this we can set the user in the actor table. This is very simple given we will use the Runtime configuration interface which uses SQL syntax.

So, let say I want to trace only my application user named stress running from machines in the 10.0.0.0/24 range. I will need to:


UPDATE setup_actors SET ENABLED='NO' WHERE user='%'; 
INSERT INTO setup_actors VALUES('10.0.0.%','stress','%','YES');
(root@localhost) [performance_schema]>select * FROM setup_actors;
+----------+--------+------+---------+
| HOST     | USER   | ROLE | ENABLED |
+----------+--------+------+---------+
| %        | %      | %    | NO      |
| 10.0.0.% | stress | %    | YES     |
+----------+--------+------+---------+
2 rows IN SET (0.00 sec)


Great, from now on PS will only focus on my user stress, so now let us decide what to enable for instruments and consumers.

Once more using SQL command we will enable all the instruments related to SQL statements, but wait a minute, if you check the instrument table, you will see we have several variations of the statements instrument:

  • SQL
  • SP
  • Scheduler
  • Com
  • Abstract

Also, this is not included but relevant is the TRANSACTION. For now, we will only enable the SQL, ABSTRACT, Scheduler and Transaction.

SQL will be:


UPDATE  setup_instruments SET ENABLED='YES' WHERE ENABLED='NO' AND name LIKE 'statement/abstract/%'; 
UPDATE  setup_instruments SET ENABLED='YES' WHERE ENABLED='NO' AND name LIKE 'statement/sql/%';
UPDATE  setup_instruments SET ENABLED='YES' WHERE ENABLED='NO' AND name LIKE 'transaction';
(root@localhost) [performance_schema]>select count(*) FROM setup_instruments
 WHERE ENABLED = 'YES' AND name NOT LIKE 'memory%';
+----------+
| count(*) |
+----------+
|      143 |
+----------+
1 row IN SET (0.01 sec)


We have 143 instruments active. Now we must setup the consumers and choose the destination that will receive the data.

The list of consumers is the following:


(root@localhost) [performance_schema]>select * FROM setup_consumers;
+----------------------------------+---------+
| NAME                             | ENABLED |
+----------------------------------+---------+
| events_stages_current            | NO      |
| events_stages_history            | NO      |
| events_stages_history_long       | NO      |
| events_statements_current        | NO      |
| events_statements_history        | NO      |
| events_statements_history_long   | NO      |
| events_transactions_current      | NO      |
| events_transactions_history      | NO      |
| events_transactions_history_long | NO      |
| events_waits_current             | NO      |
| events_waits_history             | NO      |
| events_waits_history_long        | NO      |
| global_instrumentation           | NO      |
| thread_instrumentation           | NO      |
| statements_digest                | NO      |
+----------------------------------+---------+
15 rows IN SET (0.00 sec)


To enable ANY of them, first we have to enable the GLOBAL one, which works as a global power on/off. The same thing applies for the Thread instrumentation:


UPDATE setup_consumers SET ENABLED='YES' WHERE NAME='global_instrumentation';
UPDATE setup_consumers SET ENABLED='YES' WHERE NAME='thread_instrumentation';


Then we need to activate at least the events_statements_current to see something, I suggest activating also history and statements_digest.


UPDATE setup_consumers SET ENABLED='YES' WHERE NAME='events_statements_current';
UPDATE setup_consumers SET ENABLED='YES' WHERE NAME='events_statements_history';
UPDATE setup_consumers SET ENABLED='YES' WHERE NAME='statements_digest';
UPDATE setup_consumers SET ENABLED='YES' WHERE NAME='events_transactions_current';
UPDATE setup_consumers SET ENABLED='YES' WHERE NAME='events_transactions_history';


As result, we will have the following consumers activated:


(root@localhost) [performance_schema]>select * FROM setup_consumers;
+----------------------------------+---------+
| NAME                             | ENABLED |
+----------------------------------+---------+
| events_stages_current            | NO      |
| events_stages_history            | NO      |
| events_stages_history_long       | NO      |
| events_statements_current        | YES     |
| events_statements_history        | YES     |
| events_statements_history_long   | NO      |
| events_transactions_current      | YES     |
| events_transactions_history      | YES     |
| events_transactions_history_long | NO      |
| events_waits_current             | NO      |
| events_waits_history             | NO      |
| events_waits_history_long        | NO      |
| global_instrumentation           | YES     |
| thread_instrumentation           | YES     |
| statements_digest                | YES     |
+----------------------------------+---------+
15 rows IN SET (0.00 sec)


Final optimization for the pre-filtering is to decide IF we want to catch all the objects and reduce them to a subset. By default PS will use the settings below:


(root@localhost) [performance_schema]>select * FROM setup_objects;
+-------------+--------------------+-------------+---------+-------+
| OBJECT_TYPE | OBJECT_SCHEMA      | OBJECT_NAME | ENABLED | TIMED |
+-------------+--------------------+-------------+---------+-------+
| EVENT       | mysql              | %           | NO      | NO    |
| EVENT       | performance_schema | %           | NO      | NO    |
| EVENT       | information_schema | %           | NO      | NO    |
| EVENT       | %                  | %           | YES     | YES   |
| FUNCTION    | mysql              | %           | NO      | NO    |
| FUNCTION    | performance_schema | %           | NO      | NO    |
| FUNCTION    | information_schema | %           | NO      | NO    |
| FUNCTION    | %                  | %           | YES     | YES   |
| PROCEDURE   | mysql              | %           | NO      | NO    |
| PROCEDURE   | performance_schema | %           | NO      | NO    |
| PROCEDURE   | information_schema | %           | NO      | NO    |
| PROCEDURE   | %                  | %           | YES     | YES   |
| TABLE       | mysql              | %           | NO      | NO    |
| TABLE       | performance_schema | %           | NO      | NO    |
| TABLE       | information_schema | %           | NO      | NO    |
| TABLE       | %                  | %           | YES     | YES   |
| TRIGGER     | mysql              | %           | NO      | NO    |
| TRIGGER     | performance_schema | %           | NO      | NO    |
| TRIGGER     | information_schema | %           | NO      | NO    |
| TRIGGER     | %                  | %           | YES     | YES   |
+-------------+--------------------+-------------+---------+-------+
20 rows IN SET (0.00 sec)


It is easy to understand that ANY object existing in the default Schema will be ignored. In our case, for now, we will keep it as it is, but this will be our next filtering step after we have analyzed some data. This will happen in the PART 2, stay tuned.

Conclusions

For now, you should understand what a Performance Schema is, its basic concept, as well as what interfaces are available and for what. You should also be able to compile the source code with and without PS, or part of it. You should be able to configure the MySQL configuration file correctly, and perform the initial configuration at runtime. Finally, you should know how to query the PS and how to dig in the information, which will also be discussed in the Part 2.


PlanetMySQL Voting: Vote UP / Vote DOWN
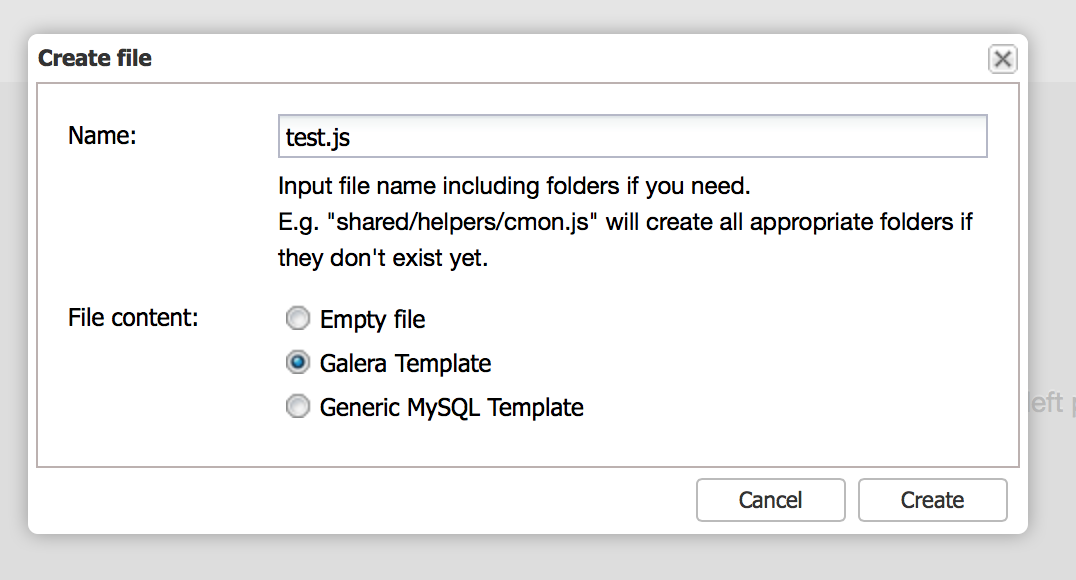
Part 1: How to Effectively Use a Performance Schema

$
0
0

Performance Schema (PS) has been the subject of many, many recent discussions, presentations, and articles.  After its release in MySQL 5.7, PS has become the main actor for people who want to take the further steps in MySQL monitoring. At the same time, it has become clear that Oracle intends to make PS powerful with so many features and new instrumentation that old-style monitoring will begin to look like obsolete tools from the Stone Age.

This article will explain PS and provide guidance on what needs to be done in order to use it effectively.

What I am not going to do is to dig into specific performance issues or address polemics about what PS is and what, in a Utopian vision, it should be. I have seen too many presentations, articles and comments like this and they are not productive, nor are they in line with my target which is: keep people informed on how to do things EASILY.

For the scope of this article I will base my code mainly on version MySQL 5.7, with some digression to MySQL 5.6, if and when it makes sense.

Basic Concepts

Before starting the real how-to, it is my opinion that we must cover a few basic concepts and principles about PS. The primary goal of the Performance Schema is to measure (instrument) the execution of the server. A good measure should not cause any change in behavior. To achieve this, the overall design of the Performance Schema complies with the following, very severe design constraints:

  • The parser is unchanged. Also, there are no new keywords or statements. This guarantees that existing applications will run the same way with or without the Performance Schema.
  • All the instrumentation points return “void”, there are no error codes. Even if the performance schema fails internally, execution of the server code will proceed.
  • None of the instrumentation points allocate memory. All the memory used by the Performance Schema is pre-allocated at startup, and is considered “static” during the server life time.
  • None of the instrumentation points use any pthread_mutex, pthread_rwlock, or pthread_cond (or platform equivalents). Executing the instrumentation point should not cause thread scheduling to change in the server.

In other words, the implementation of the instrumentation points, including all the code called by the instrumentation points is:

  • Malloc free
  • Mutex free
  • Rwlock free

Currently, there is still an issue with the usage of the LF_HASH, which introduces memory allocation, though a plan exists to be replace it with lock-free/malloc-free hash code table.

The observer should not influence the one observe. As such, the PS must be as fast as possible, while being less invasive. In cases when there are choices between:

  • Processing when recording the performance data in the instrumentation.

OR

  • Processing when retrieving the performance data.

Priority is given in the design to make the instrumentation faster, pushing some complexity to data retrieval.

Performance schema was designed while keeping an eye on future developments and how to facilitate the PS usage in new code. As such, to make it more successful, the barrier of entry for a developer should be low, so it is easy to instrument code. This is particularly true for the instrumentation interface. The interface is available for C and C++ code, so it does not require parameters that the calling code cannot easily provide, supports partial instrumentation (for example, instrumenting mutexes does not require that every mutex is instrumented). The Performance Schema instrument interface is designed in such a way that any improvement/additions in the future will not require modifications, as well as old instrumentation remaining unaffected by the changes.

The final scope for PS is to have it implemented in any plugin included in MySQL, although pretending to have them always using the latest version will be unrealistic in most cases. Given that the Performance Schema implementation must provide up to date support, within the same deployment, multiple versions of the instrumentation interface must ensure binary compatibility with each version.

The importance of flexibility means we may have conditions like:

  • Server supporting the Performance Schema + a storage engine that is instrumented.
  • Server supporting the Performance Schema + a storage engine that is not
  • Server not supporting the Performance Schema + a storage engine that is instrumented.

Finally, we need to take in to account that the Performance Schema can be included or excluded from the server binary, using build time configuration options, with exposure in the compiling interface.

Performance Schema Interfaces

As mentioned above, PS can be excluded from code at the moment of the code compilation, thanks to the PS compile interface. This interface is one of seven that are present in PS. The full list is:

  • Instrument interface
  • Compiling interface
  • Server bootstrap interface
  • Server startup interface
  • Runtime configuration interface
  • Internal audit interface
  • Query interface

Instrument Interface:

This is the one that allows plugin implementers to add their instruments to PS. In general the interface is available for:

  • C implementations
  • C++ implementations
  • The core SQL layer (/sql)
  • The mysys library (/mysys)
  • MySQL plugins, including storage engines,
  • Third party plugins, including third party storage engines.

Compiling Interface:

As mentioned earlier, this is used during the build and will include or exclude PS code from the binaries.

Server Bootstrap Interface:

This is an internal private interface, which has the scope to provide access to the instructions demanded and create the tables for the PS itself.

Server Startup Interface:

This interface will expose options used with the mysqld command line or in the my.cnf, required to:

  • Enable or disable the performance schema.
  • Specify some sizing parameters.

Runtime Configuration Interface

This is one of the two most important interfaces for DBAs and SAs. It will allow the configuration of the PS at runtime. Using the methods expose by this interface, we will be able to configure what instruments, consumers, users and more we want to have active. This interface uses standard SQL and is very easy to access and use. Also, it is the preferred method to activate or deactivate instruments. Thus, when we start the server we should always enable the PS with all the instruments and consumers deactivated, and use this interface to choose only the ones we are interested in.

Internal Audit Interface:

The internal audit interface is provided to the DBA to inspect if the Performance Schema code itself is functioning properly. This interface is necessary because a failure caused while instrumenting code in the server should not cause failures in the MySQL server itself, and in turn the performance schema implementation never raises errors during runtime execution. To access the information a DBA just needs to issue the SHOW ENGINE PERFORMANCE SCHEMA STATUS; command.

Query Interface:

Lastly, this interface is the one that allows us to access the collected data, and to perform data filtering, grouping, join, etc. It will also allow access to a special table like the summary tables and digest, which will be discussed later on.

Consumers and Instruments

Another important concept in PS to understand is the difference between Instruments and Consumers.

Instruments:

Instruments are the ones collecting raw data where the calls are embedded in the code, such as:

MYSQL_TABLE_IO_WAIT(PSI_TABLE_FETCH_ROW, active_index, result,

{ result= index_prev(buf); })

In this case the code refers to the MYSQL_TABLE_IO_WAIT function declared in the handler.cc class (<mysql_root_code>/sql/handler.cc). If enabled in the compilation phase the above function will provide PS the information related to specific table io_wait.

The instruments demanded to manage that data collection is: wait/io/table/sql/handler.

The naming convention for the instruments is quite easy. The first part wait is the name of the Top-level Instrument component (list later), the second io is the observed condition, and table is the object.  The remaining suffix is referring to more specific plugin implementations and includes innodb, myisam, sql or names like IO_CACHE::append_buffer_lock. In the above example it refers to the Handler class in SQL tree.

Instruments are organized by top level components like:

  • Idle: An instrumented idle event. This instrument has no further components.
  • Memory: An instrumented memory event.
  • Stage: An instrumented stage event.
  • Statement: An instrumented statement event.
  • Transaction: An instrumented transaction event. This instrument has no further components.
  • Wait: An instrumented wait event.

Each top level has an n number of instruments:

+-------------+------+
| name        | Numb |
+-------------+------+
| idle        |    1 |
| memory      |  367 |
| stage       |  117 |
| statement   |  191 |
| transaction |    1 |
| wait        |  297 |
+-------------+------+

We can and should keep in consideration that, it is best practice to enable only the instruments we may require for the time we need them. This can be achieved using the re-using the runtime interface (I will explain how exactly later on).

There exists official documentation  (insert hyperlink: http://dev.mysql.com/doc/refman/5.7/en/performance-schema-instrument-naming.html) providing more detailed information about the list of what is available for each Top Component.

Consumers:

The Consumers are the destination of the data collected from the instruments. Consumers have different scope and timelines. Also, consumer like event statements has many different tables like:

  • Current
  • History
  • History long
  • Summaries (by different aggregation)
  • Summary Digest (like what we can find by processing the slow query log)

Once more it is important to define what we are looking for and enable only what we need. For instance, if we need to review/identify the SQL with the most impacting, we should enable only the events_statements_current, events_statements_history and events_statements_summary_by_digest. All the other consumers can stay off. It is also important to keep in mind that each event may have a relation with another one. In this case, we will be able to navigate the tree relating the events using the fields EVENT_ID and NESTING_EVENT_ID where the last one is the EVENT_ID of the parent.

Pre-Filtering vs. Post-filtering

We are almost there, stay tight! Another important concept to understand is the difference between post and pre-filtering. As I mentioned, we can easily query the Consumer tables with SQL, we can create complex SQL to join tables and generate complex reports. But this can be quite heavy and resource consuming, especially if we want to dig on specific sections of our MySQL server.

In this case we can use the pre-filtering approach. The pre-filtering is basically a way to tell to PS to collect information ONLY from a specific source like user/IP (actors) or Object(s) like Tables, Triggers, Events, and Functions. The last one can be set at a general level or down to a specific object name.

The pre-filtering with the activation of the right instruments and consumer is a powerful way to collect the information without overloading the server with useless data. It is also very easy to implement given we just need to set the objects and/or actors in the setup tables as we like.

Rolling the Ball, Setup the PS for Observation as Start

Now that we have covered the basic concepts we can start to work on the real implementation.

Compile the Source Code:

As mentioned earlier, we can use the compile interface to include or exclude features from the code compilation. The available options are:

  • DISABLE_PSI_COND Exclude Performance Schema condition instrumentation
  • DISABLE_PSI_FILE Exclude Performance Schema file instrumentation
  • DISABLE_PSI_IDLE Exclude Performance Schema idle instrumentation
  • DISABLE_PSI_MEMORY Exclude Performance Schema memory instrumentation
  • DISABLE_PSI_METADATA Exclude Performance Schema metadata instrumentation
  • DISABLE_PSI_MUTEX Exclude Performance Schema mutex instrumentation
  • DISABLE_PSI_RWLOCK Exclude Performance Schema rwlock instrumentation
  • DISABLE_PSI_SOCKET Exclude Performance Schema socket instrumentation
  • DISABLE_PSI_SP Exclude Performance Schema stored program instrumentation
  • DISABLE_PSI_STAGE Exclude Performance Schema stage instrumentation
  • DISABLE_PSI_STATEMENT Exclude Performance Schema statement instrumentation
  • DISABLE_PSI_STATEMENT_DIGEST Exclude Performance Schema statement_digest instrumentation
  • DISABLE_PSI_TABLE Exclude Performance Schema table instrumentation

This level of detail is so granular that we can only include the things we are planning to use.

The positive aspect of doing so at the compilation level is that we will be sure no one will mess-up adding undesired instruments. The drawback is that if we change our mind and we decide we may need the ones we had excluded, we will have to compile the whole server again.

As a result, I would say that using this approach is not for someone that is just starting to use PS. Given you are still discovering what is there, it make sense to compile with all the features (default).

Configure PS in my.cnf:

To set the PS correctly in the my.cnf is quite important, so I strongly suggest disabling any instrument and consumer at the start-up. They can be enabled by the script later, and that would be much safer for a production database.

I normally recommend a section like the following:

performance_schema=1

performance_schema_events_waits_history_size=50

performance_schema_events_waits_history_long_size=15000

performance_schema_instrument=’%=OFF’

performance_schema_consumer_events_stages_current=0

performance_schema_consumer_events_stages_history=0

performance_schema_consumer_events_stages_history_long=0

performance_schema_consumer_events_statements_current=0

performance_schema_consumer_events_statements_history=0

performance_schema_consumer_events_statements_history_long=0

performance_schema_consumer_events_transactions_current=0

performance_schema_consumer_events_transactions_history=0

performance_schema_consumer_events_transactions_history_long=0

performance_schema_consumer_events_waits_current=0

performance_schema_consumer_events_waits_history=0

performance_schema_consumer_events_waits_history_long=0

performance_schema_consumer_global_instrumentation=0

performance_schema_consumer_thread_instrumentation=0

performance_schema_consumer_statements_digest=0

The settings above will start the server with PS as “enabled”, but all the instruments and consumer will be OFF. Well, this is not entirely true, as for the moment of the writing (MySQL 5.7.7) once the PS is enabled the instruments related to memory/performance_schema are enabled regardless, which make sense given they are dedicated to monitor the memory utilization of PS.

A final note about the configuration is that we can decide to use the counting option of the instruments instead, capturing the latency time. To do so, we just have to declare it as: performance_schema_instrument=’statement/sql/%=COUNTED’

In this case I had set that ALL the SQL statements should be counted.

Start Server and Set Only the Users We Need:

Once we have started our MySQL server, we are almost ready to go.

This is it, given we start it with NO instruments, we have to decide where to begin, and given we all know the most impacting factor in a database server is how we query it, we will start from there. In turn, analyzing what is going from the SQL point of view. Although, I want to catch the work coming from my application user, not from everywhere. Given this we can set the user in the actor table. This is very simple given we will use the Runtime configuration interface which uses SQL syntax.

So, let say I want to trace only my application user named stress running from machines in the 10.0.0.0/24 range. I will need to:

update setup_actors set ENABLED='NO' where user='%';
insert into setup_actors values('10.0.0.%','stress','%','YES');
(root@localhost) [performance_schema]>select * from setup_actors;
+----------+--------+------+---------+
| HOST     | USER   | ROLE | ENABLED |
+----------+--------+------+---------+
| %        | %      | %    | NO      |
| 10.0.0.% | stress | %    | YES     |
+----------+--------+------+---------+
2 rows in set (0.00 sec)

Great, from now on PS will only focus on my user stress, so now let us decide what to enable for instruments and consumers.

Once more using SQL command we will enable all the instruments related to SQL statements, but wait a minute, if you check the instrument table, you will see we have several variations of the statements instrument:

  • SQL
  • SP
  • Scheduler
  • Com
  • Abstract

Also, this is not included but relevant is the TRANSACTION. For now, we will only enable the SQL, ABSTRACT, Scheduler and Transaction.

SQL will be:

update  setup_instruments SET ENABLED=’YES’ where ENABLED=’NO’ and name like ‘statement/abstract/%';

update  setup_instruments SET ENABLED=’YES’ where ENABLED=’NO’ and name like ‘statement/sql/%';

update  setup_instruments SET ENABLED=’YES’ where ENABLED=’NO’ and name like ‘transaction';

(root@localhost) [performance_schema]>select count(*) from setup_instruments where ENABLED = ‘YES’ and name not like ‘memory%';

+———-+

| count(*) |

+———-+

|      143 |

+———-+

1 row in set (0.01 sec)

We have 143 instruments active. Now we must setup the consumers and choose the destination that will receive the data.

The list of consumers is the following:

(root@localhost) [performance_schema]>select * from setup_consumers;
+----------------------------------+---------+
| NAME                             | ENABLED |
+----------------------------------+---------+
| events_stages_current            | NO      |
| events_stages_history            | NO      |
| events_stages_history_long       | NO      |
| events_statements_current        | NO      |
| events_statements_history        | NO      |
| events_statements_history_long   | NO      |
| events_transactions_current      | NO      |
| events_transactions_history      | NO      |
| events_transactions_history_long | NO      |
| events_waits_current             | NO      |
| events_waits_history             | NO      |
| events_waits_history_long        | NO      |
| global_instrumentation           | NO      |
| thread_instrumentation           | NO      |
| statements_digest                | NO      |
+----------------------------------+---------+
15 rows in set (0.00 sec)

To enable ANY of them, first we have to enable the GLOBAL one, which works as a global power on/off. The same thing applies for the Thread instrumentation:

update setup_consumers set ENABLED=’YES’ where NAME=’global_instrumentation';

update setup_consumers set ENABLED=’YES’ where NAME=’thread_instrumentation';

Then we need to activate at least the events_statements_current to see something, I suggest activating also history and statements_digest.

update setup_consumers set ENABLED=’YES’ where NAME=’events_statements_current';

update setup_consumers set ENABLED=’YES’ where NAME=’events_statements_history';

update setup_consumers set ENABLED=’YES’ where NAME=’statements_digest';

update setup_consumers set ENABLED=’YES’ where NAME=’events_transactions_current';

update setup_consumers set ENABLED=’YES’ where NAME=’events_transactions_history';

As result, we will have the following consumers activated:


(root@localhost) [performance_schema]>select * from setup_consumers;
+----------------------------------+---------+
| NAME                             | ENABLED |
+----------------------------------+---------+
| events_stages_current            | NO      |
| events_stages_history            | NO      |
| events_stages_history_long       | NO      |
| events_statements_current        | YES     |
| events_statements_history        | YES     |
| events_statements_history_long   | NO      |
| events_transactions_current      | YES     |
| events_transactions_history      | YES     |
| events_transactions_history_long | NO      |
| events_waits_current             | NO      |
| events_waits_history             | NO      |
| events_waits_history_long        | NO      |
| global_instrumentation           | YES     |
| thread_instrumentation           | YES     |
| statements_digest                | YES     |
+----------------------------------+---------+
15 rows in set (0.00 sec)

Final optimization for the pre-filtering is to decide IF we want to catch all the objects and reduce them to a subset. By default PS will use the settings below:

(root@localhost) [performance_schema]>select * from setup_objects;
+-------------+--------------------+-------------+---------+-------+
| OBJECT_TYPE | OBJECT_SCHEMA      | OBJECT_NAME | ENABLED | TIMED |
+-------------+--------------------+-------------+---------+-------+
| EVENT       | mysql              | %           | NO      | NO    |
| EVENT       | performance_schema | %           | NO      | NO    |
| EVENT       | information_schema | %           | NO      | NO    |
| EVENT       | %                  | %           | YES     | YES   |
| FUNCTION    | mysql              | %           | NO      | NO    |
| FUNCTION    | performance_schema | %           | NO      | NO    |
| FUNCTION    | information_schema | %           | NO      | NO    |
| FUNCTION    | %                  | %           | YES     | YES   |
| PROCEDURE   | mysql              | %           | NO      | NO    |
| PROCEDURE   | performance_schema | %           | NO      | NO    |
| PROCEDURE   | information_schema | %           | NO      | NO    |
| PROCEDURE   | %                  | %           | YES     | YES   |
| TABLE       | mysql              | %           | NO      | NO    |
| TABLE       | performance_schema | %           | NO      | NO    |
| TABLE       | information_schema | %           | NO      | NO    |
| TABLE       | %                  | %           | YES     | YES   |
| TRIGGER     | mysql              | %           | NO      | NO    |
| TRIGGER     | performance_schema | %           | NO      | NO    |
| TRIGGER     | information_schema | %           | NO      | NO    |
| TRIGGER     | %                  | %           | YES     | YES   |
+-------------+--------------------+-------------+---------+-------+
20 rows in set (0.00 sec)

It is easy to understand that ANY object existing in the default Schema will be ignored. In our case, for now, we will keep it as it is, but this will be our next filtering step after we have analyzed some data. This will happen in the PART 2, stay tuned.

Conclusions

For now, you should understand what a Performance Schema is, its basic concept, as well as what interfaces are available and for what. You should also be able to compile the source code with and without PS, or part of it. You should be able to configure the MySQL configuration file correctly, and perform the initial configuration at runtime. Finally, you should know how to query the PS and how to dig in the information, which will also be discussed in the Part 2.

Find out more about Pythian’s services in MySQL.


PlanetMySQL Voting: Vote UP / Vote DOWN

Fun with Bugs #36 - Bugs fixed in MySQL 5.6.25

$
0
0
Two days ago Oracle had released MySQL 5.6.25, so it's time to check what bugs reported by MySQL Community are fixed there. As usual, I'll mention both a bug reporter and engineer who verified the bug. Please, pay attention to fixes in replication and partitioning - if you use these features (or queries to INFORMATION_SCHEMA with a lot of complex tables in your database), please, consider upgrading ASAP.

The following InnoDB related bugs were fixed:
  • Bug #69990 - CREATE_TIME and UPDATE_TIME are wrong for partitioned tables. Finally this bug reported by my colleague Justin Swanhart and verified by Umesh (almost immediately after it was reported) is fixed!
  • Bug #75790 - memcached SET command accepts negative values for expire time. This bug (that Oracle put into InnoDB section in the release notes) was reported and verified by Umesh
  • Bug #74686  - Wrong relevance ranking for InnoDB full text searches under certain conditions. This bug was reported by Tim McLaughlin and verified by Miguel Solorzano.
  • The last but not the least, new innodb_stress test suite by Mark Callaghan is included now, thanks to the Bug #76347 reported by Viswanatham Gudipati.
Oracle had fixed several more memcached and InnoDB-related bugs in 5.6.25, but as they were reported only internally, they are out of the scope of my posts.

A set of related bugs in Partitioning category was fixed:
  • Bug #74288 - Assertion `part_share->partitions_share_refs->num_parts >= m_tot_parts' failed. It was reported by my colleague Roel Van de Paar and verified by Umesh.
  • Bug #74634 - this bug is still private, so we do not see the details.
  • Bug #74451 - this bug is also private. We can probably assume that in case of private bug we had assertion failures or crashes on non-debug builds. So, if you use partitioning a lot, please, consider upgrading to 5.6.25 ASAP.
A lot of replication related bugs were fixed in 5.6.25:
  • Bug #75879 - memory consumed quickly while executing loop in procedure. It was reported by Zhai Weixiang (who had also provided a patch) and verified by Shane Bester. If you ask me, based on the contributions over last 2 years it's about time for Percona to hire Zhai Weixiang into our development team, or Oracle may approach him faster. He is a really brilliant engineer!
  • Bug #75781 - log lock may not be unlocked if add_logged_gtid failed. It was reported by Fangxin Flou (who had provided a patch as well) and verified by Sinisa Milivojevic.
  • Bug #75769 - this bug is still private. Release notes describes the problem as follows: "A slave running MySQL 5.6.24 or earlier could not connect to a master running MySQL 5.7.6 and later that had gtid_mode=OFF_PERMISSIVE or gtid_mode=ON_PERMISSIVE." I wonder why such a bug can be private. Either it was reported like that or we do not see all the details about the impact.
  • Bug #75574 - Can not execute change master after Error occurred in MTS mode. It was reported by Zhang Yingqiang and verified by Sveta Smirnova (while she still worked in Oracle).
  • Bug #75570 - semi-sync replication performance degrades with a high number of threads. The problem was studied in details and reported by Rene' Cannao' and verified by Umesh.
  • Bug #74734  - mysqlbinlog can't decode events > ~1.6GB. It was reported by Hartmut Holzgraefe and verified by Umesh.
  • Bug #69848 - mysql 5.6 slave out of memory error. It was reported by  Jianjun Yang and verified by Sveta SmirnovaBug #72885 (where Shane Bester had clearly identified the memory leak)was declared a duplicate. If you use master-info-repository = TABLE on your 5.6.x slaves, please, consider upgrading to 5.6.25 ASAP.
  • Bug #70711 - mysqlbinlog prints invalid SQL from relay logs when GTID is enabled. This bug was reported by Yoshinori Matsunobu and probably verified formally by Luis Soares.
 There are several fixes in other categories:
  • Bug #75740 - Fix errors detected by ASan at runtime. It was reported and verified by Anitha Gopi based on request from WebScaleSQL team. 
  • Bug #76612 - would like ability to throttle firewall ACCESS DENIED messages in error log. This feature was requested by Shane Bester. Should I tell you again how much I am happy when I see public bug reports from Oracle employees?
  • Bug #76552 - Cannot shutdown MySQL using JDBC driver. This regression bug was reported by Davi Arnaut (who provided a patch as well) and verified by Umesh.
  • Bug #76019 is private. Release notes say: "Inappropriate -Werror options could appear in mysql_config --cflags output." Why on the Earth anyone could set or leave this bug as private is beyond my imagination.
  • Bug #74517 - thread/sql/main doesn't change state/info after startup. PERFORMANCE_SCHEMA was meant to be perfect already, but still some fixes are needed. The bug was reported by Kolbe Kegel and verified by Umesh.
  • Bug #72322 - Query to I_S.tables and I_S.columns leads to huge memory usage. Now I am impressed and I want to check the fix ASAP (as release notes do not say much)! If this bug (reported by my colleague Przemyslaw Malkowski just few weeks ago, on April 11, and verified by Umesh) is really fixed, it's a huge step forward in making INFORMATION_SCHEMA usable.
  • Bug #69638 - Wrong results when running a SELECT that includes a HAVING based on a function. The only optimizer bug from Community fixed in this version was reported by Roger Esteban and verified by Umesh.
  • Bug #69453 - Prepared statement is written to general query log after its execution is finish. It was reported by my colleague Sergei Glushchenko and verified by Umesh.
  • Bug #68999 - SSL_OP_NO_COMPRESSION not defined. It was reported by Remi Colletand verified probably by Georgi Kodinov.
To summarize, 24 or so bug reports from public bugs database were fixed in 5.6.25, of them fixes for replication, partitioned tables and INFORMATION_SCHEMA look really important and impressive. At least 10 of these bug reports were verified by Umesh. 4 bugs remain private, and I think it's probably wrong.
  
PlanetMySQL Voting: Vote UP / Vote DOWN

VividCortex Announces Database Monitoring for MongoDB

$
0
0

We are excited to announce that VividCortex now supports MongoDB, a flexible and scalable NoSQL database. After announcing PostgreSQL support in January and Redis in April, our brainiacs continue to create a unified solution for diverse systems.

During the beta period, VividCortex’s MongoDB customers were impressed, as Chris Clark, DevOps engineer at Parse.ly states: “VividCortex’s highly granular data, including detailed information about each query made against our MongoDB clusters, is invaluable. Installation was a breeze, and the system immediately spotted two problematic queries that had evaded all our other monitoring systems.”

Read the entire release here.


PlanetMySQL Voting: Vote UP / Vote DOWN

Siesta - RESTful Services Made Simple in Go

$
0
0

A kitten getting some REST

All of our services (external REST APIs and internal services) are written in Go. Like others, we wanted to factor out repeated code, but found it hard to do without making things messy or hiding the flexibility of the built-in net/http interfaces. After evaluating many “REST frameworks” for Go, we found some that seemed to have good ideas, but nothing that met our needs well enough. Using these as inspiration and drawing on experience with other languages and their frameworks, we created Siesta. We believe it improves on other projects with similar goals, and is worth trying.

Siesta is our third “REST framework;” the others are ugly internal-only failures we will never open source. Siesta is designed to accomplish the following:

  • Handle common tasks such as defining and validating inputs, which can be in the URL or query string. These are strongly typed and flexible.
  • More sophisticated routing than provided by net/http.
  • Chaining together handlers in a “middleware” fashion to factor out repeated code, compose it easily, and keep the actual handler function for each route clean and clear. This includes things like marshal/unmarshal, setup, and logging.
  • Pass variables in a “context” between middleware handlers.
  • Make services and each bit of middleware logic easier to test.
  • Be idiomatic. For example, parameter definitions draw inspiration from the flag package.

Something that we noticed very early on was that most frameworks try to do too much. Often times frameworks either have features that we don’t need or impose too many limitations on how we build REST services. In particular, frameworks tend to move away from Go’s native net/http usage. We tried to make Siesta as lightweight and minimal as possible while enhancing what is already provided by net/http with idiomatic helpers.

Siesta has helped us in many ways:

  • Middleware greatly reduced the amount of duplicated code.
  • Overall API design has become more modular, which has greatly improved unit tests.
  • Its flexibility has allowed us to do things that weren’t possible with our previous framework.

Siesta has been open-source from the beginning, but we didn’t want to publicize it until we were satisfied that it’s a good enough solution. We’re at that point now and ready to share. We believe it improves on other projects with similar goals, and is worth broad study and perhaps adoption among Gophers writing HTTP services and APIs.

Design

Good design is simple.

http://www.paulgraham.com/taste.html

One of the main principles that we had in mind when designing another REST framework was that it should be as simple as possible. A net/http HandlerFunc has the following signature:

func (w http.ResponseWriter, r *http.Request)

Often times, just using HandlerFuncs leads to a lot of replicated code. In order to deduplicate code, we introduced a context parameter to our handler functions to easily chain them together. Siesta’s use of a context parameter is inspired by a Go concurrency pattern, which is described on the Go blog. Ours is much simpler; it’s an interface that has a Set and Get method, which is trivially implemented as a map[string]interface{}.

type Context interface {
    Set(string, interface{})
    Get(string) interface{}
}

For example, we assign each request an ID so we can easily identify and trace requests in our logs.

func (c siesta.Context, w http.ResponseWriter, r *http.Request) {
    requestID := c.Get("request-id")

    // ...

    if err != nil {
        log.Println("[%v] %v", requestID, err)
        return
    }

    // ...
}

We’ve added a couple of handler function “chains” in Siesta to help with composition. There is a single handler assigned to each route, but we have “pre” and “post” chains surrounding the route handlers that are always executed. The “pre” chain handles things like identifying requests, setting up database handles, and logging requests. The “post” chain has code to actually send data back to the client, for example.

There are times when something goes wrong and you have to quit executing a chain in the middle, perhaps because the request failed some sort of validation. The final piece was to add a “quit” function to signal that the chain should be stopped. The implementation allows us to support termination of certain handlers and not others, allowing us to bypass certain sections of code during errors but still be able to send data back to the client.

Our complete internal signature of a handler became this:

func (c siesta.Context, w http.ResponseWriter, r *http.Request, quit func())

The best thing about Siesta is that it composes handler functions really well. We provide a siesta.Compose() helper to compose multiple handler functions together. The Context and quit parameters are also optional, so you are free to compose different types of handler functions together.

Finally, Siesta makes it really easy to use URL and query string parameters with a flag-like interface. The params example demonstrates its usage.

The project is available on GitHub. Try out the example in the README to get started with Siesta.

Image credit: Takashi Hososhima.


PlanetMySQL Voting: Vote UP / Vote DOWN

MySQL High Available with MHA

$
0
0

Providing a suitable High Availability (HA) solution for each database system is one of the challenging tasks for a DBA and here we have to answer some questions like the following ones:

  1. What is the cost for that HA solution?
  2. Is it required to change the system structure or the DB design to use that HA solution?
  3. Is it complicate to understand, use or maintain ?

Choosing the suitable HA solution for each system will depend on the answers of such questions …
In this post, I’m going to write about MySQL Master High Availability MHA as a nice tool which provides HA for MySQL by performing automatic fail-over or fast online master switching with almost no downtime!

Before going through more details about MHA, let’s first answer the previous questions:

  1. MHA is a free opensource tool, no cost to use it in your system and even no additional servers are required.
  2. No system changes or DB redesign are required to use MHA, keep your system as it is and just use the tool! (Assuming that MySQL replication is already being used).
  3. MHA is easy to implement and its usage is simple.

Overview

As I mentioned above, MHA provides two main benefits:

  • Automatic fail-over: which is helpful for the unexpected master failure, crash, … etc. (the fail-over can be done also manually).
  • Fast online master switching: which is helpful when performing the regular planned or scheduled maintenance operations like kernel updates, MySQL upgrade, HW upgrade, … etc.

If we have 3 servers, master and two slaves (slave1 and slave2) and we want to perform a planned maintenance on the master, we will need to perform the following:

  1. Make sure that no slave lagging problem and all servers are at the same point.
  2. Promote one of the slaves (slave1) to be a new master.
  3. Point the other slave (slave2) to slave1 instead of master.
  4. Configure master to be slave for slave1 to get all updates which will happen during the maintenance.
  5. Stop MySQL service on master to perform the maintenance operation (kernel update “server restart”, MySQL version upgrade, .. etc).
  6. Start MySQL service on master and wait until getting all missing transactions from slave1.
  7. Promote back master to be the current master.
  8. Re-point slave2 to master again.
  9. Configure slave1 to be back as a slave for master.

It’s not as simple as it appears, especially, if classic replication is being used because we will need to get the matched binary log file name and position between the old master and the new one to be used on the slave(s) in the re-pointing step to the new master!
Also, it makes sense to use VIP on the top of the DB layer to be used by the application to avoid extra work from the application – or maybe downtime – during the fail-over process. So, we will need to do extra steps to remove/add the VIP from/to the demoted/promoted master!

mha

MHA can make such process pretty simple and easy!!

Implementation of MHA (version 0.56 at the time of writing this post)

Installation:

MHA consists of two packages, node and manager:

  1. Node package: Should be installed on all DB servers (the master and the two slaves in this example).
  2. Manager package: Recommended to be installed on a separate server but it’s OK to install it on any one of them (preferred not the master in case of the master failed e.g. slave1).

Note:

  • MHA packages can be downloaded from here.
  • Some Perl dependencies are required (DBD::mysql on all servers while Config::Tiny, Log::Dispatch, Parallel::ForkManager and Time::HiRes are required on the manager).

Scripts preparation (on the manager):

  1. Create an application config file (check /sample/conf):

    vi /etc/mha/app1.cnf

    [server default]
    # mysql user and password for MHA (should be created on all DB servers)
    user=mhauser
    password=M0llP@ss
    # Replication user password
    repl_password=s3cret
    ssh_user=root
    # working directory on the manager
    manager_workdir=/var/log/masterha/app1
    # working directory on MySQL servers
    remote_workdir=/var/log/masterha/app1
    #In case of online master switching, the following script will be used
    master_ip_online_change_script=/etc/mha/master_ip_online_change
    #In case of automatic fail-over, the following script will be used
    master_ip_failover_script=/etc/mha/master_ip_failover

    [server1]
    hostname=master

    [server2]
    hostname=slave1
    #Setting higher priority of being the new master (not guaranteed if it was lagging too much)
    candidate_master=1

    [server3]
    hostname=slave2
    #if this server should never be the master (diff data center, weak HW, ... etc.)
    no_master=1

    Notes:

    • No need to specify which server is the master as MHA detects it automatically.
    • candidate_master and no_master options are needed only in the fail-over as in the online master switching we will specify the new master host.
  2. Copy the scripts “master_ip_failover” (will be executed when performing the fail-over) and “master_ip_online_change” (will be executed when performing the online master switching) from /sample/scripts to “/etc/mha/” and make sure they are executable (you can copy only the one you plan to use).
  3. Add the VIP handling part in both scripts:

    my $vip = '192.168.1.100'; # Virtual IP
    my $ssh_add_vip = "/sbin/ip addr add $vip/24 dev eth1";
    my $ssh_del_vip = "/sbin/ip addr del $vip/24 dev eth1";
    my $ssh_send_garp = "/sbin/arping -U $vip -I eth1 -c 1";
    .
    .
    sub main {
    if ( $command eq "stop" ) {
    .
    .
    ## Removing the VIP
    print "Disabling the VIP on the old master if the server is still UP: $orig_master_host \n";
    &del_vip();
    print "DONE ... \n";
    .
    .
    elsif ( $command eq "start" ) {
    .
    .
    ## Adding the VIP
    print "Enabling the VIP - $vip on the new master - $new_master_host \n";
    &add_vip();
    print "DONE ... \n";
    .
    .
    # A simple function that enables the VIP on the new master (should be called when starting the new master)
    sub add_vip() {
    `ssh $new_master_ssh_user\@$new_master_host \" $ssh_add_vip \"`;
    `ssh $new_master_ssh_user\@$new_master_host \" $ssh_send_garp \"`;
    }

    # A simple function that disables the VIP on the old_master (should be called when stopping the old master)
    sub del_vip() {
    `ssh $orig_master_ssh_user\@$orig_master_host \" $ssh_del_vip \"`;
    }

Environment preparation:

  1. Create MySQL user on all DB servers to be used by MHA:
    GRANT ALL ON *.* TO 'mhauser'@'%' IDENTIFIED BY 'M0llP@ss';
  2. Create the replication user on the candidate-master server (slave1 in this example):
    GRANT REPLICATION SLAVE ON *.* TO 'repl'@'%' IDENTIFIED BY's3cret';
  3. Generate ssh key on all servers if it was not already generated:
    ssh-keygen -t rsa
  4. Allow connections between all servers using the ssh keys without prompting for passwords (passphraseless login):

    On the master:
    root@master:/# ssh-copy-id root@slave1
    root@master:/# ssh-copy-id root@slave2
    root@master:/# ssh-copy-id root@master ## Self referential is necessary!!

    And do the same on slave1 and slave2 …

  5. Check from the manager (“slave1″) if SSH settings are correct or not:
    masterha_check_ssh --conf=/etc/mha/app1.cnf
    The message “All SSH connection tests passed successfully” should be printed at the end, otherwise, something wrong should be fixed first.
  6. Check if the replication health is OK or not (from the manager also):
    masterha_check_repl --conf=/etc/mha/app1.cnf
    The message “MySQL Replication Health is OK” should be printed at the end, otherwise, something wrong should be fixed first.
  7. Add the virtual IP on the master to be used by the application (if it was not already added):
    ip addr add 192.168.1.100/24 dev eth1

Now we are ready to perform the fail-over ;)

Perform the fail-over:

Automatic fail-over:

  • To perform the fail-over automatically, the manager should monitor the master. Use the following command to do so:
    slave1# nohup masterha_manager --conf=/etc/mha/app1.cnf /var/log/masterha/app1/app1.log 2>&1 &
  • To check if it is monitoring or not, execute the following command:
    slave1# masterha_check_status --conf=/etc/mha/app1.cnf

Once the manager failed to connect to the master three times (you might need to configure secondary_check_script to make sure it is not a network issue) it will change the master automatically and stop monitoring.

Notes:

  • shutdown_script should be used to power-off the master to make sure it is really down and to avoid split-brain.
  • If you want to stop monitoring the master for any reason, use the following command:
    masterha_stop –conf=/etc/mha/app1.cnf

Manual fail-over:

Sometimes, automatic fail-over is not preferred, so we can do it manually once the master failed using the following command (detecting the master failure is our responsibility!):

masterha_master_switch --master_state=dead --conf=/etc/mha/app1.cnf --dead_master_host=master

Online master switching (planned maintenance):

To perform online master switching for maintenance purpose, just use the following command:
masterha_master_switch --master_state=alive --conf=/etc/mha/app1.cnf --new_master_host=slave1 --orig_master_is_new_slave
Notes:

  • It is recommended to double check the SSH connectivity and replication health also directly before switching the master using masterha_check_ssh and masterha_check_repl scripts.
  • MHA will execute “FLUSH TABLES WITH READ LOCK;” after freezing the writes on the master.
  • Using --orig_master_is_new_slave option will make the master slave for the new master after the switch process.

Common issues and useful tips:

SSH checking is not successful!!

  • Host-names with its IPs are added to /etc/hosts ??
  • Remote root login is permitted ?? “PermitRootLogin yes” in /etc/ssh/sshd_config (sshd should be restarted after that change)!
  • Don’t forget the self referential!!

Replication checking is not successful!!

  • Binary logging is not enabled on the candidate-master slave?!
  • Binary logging is enabled on any of the slaves but the replication user is not created there ?? MHA will consider any slave having bin_log enabled as a candidate master in the replication checking. So, either we have to disable bin_log on all slaves except the candidate master or create the replication user on all slaves having bin_log enabled.
  • Filtration rules are different on the slaves? It should be the same on all slave servers!
  • binlog path is different? consider adding master_binlog_dir in app1.cnf!
  • Same with pid file path, mysql port, mysql client bin dir, … etc. if they are in different paths (full parameter list can be checked out here).
  • Master/Master in active/active setup? (one of them should be read_only as only one active is allowed “active/passive”).
  • MySQL user for MHA ? not enough privileges!!

Slaves can’t connect to the new master!

The replication user is not exists on the candidate master ?

Changing the VIP to the new master is not being reflected immediately to servers in other networks!!

“Gratuitous ARP” need to be sent after adding the VIP on the new master to update the arp table!!
arping -U $vip -I eth1 -c 1

One manager can manage many systems!

I.e. app1, app2, … etc. and it is recommended to have one manager per data-center.

Examples of who uses MHA on productions:

Conclusion

  • MHA implementation in short:
    1. Install node package on all MySQL servers.
    2. Install manager package on the manager.
    3. Create the needed scripts (app1.conf, master_ip_failover, .. etc.).
    4. masterha_check_ssh –conf=/etc/mha/app1.cnf
    5. masterha_check_repl –conf=/etc/mha/app1.cnf
    6. masterha_manager for fail-over or masterha_master_switch for master switch.
    7. That’s it !!!
  • Having your system high available with no additional costs, no system or DB redesign and not in a complex way is possible with the opensource tool, MHA!
  • Finally, thanks to Yoshinori Matsunobu for creating such wonderful tool!!


PlanetMySQL Voting: Vote UP / Vote DOWN

This time it is real...

$
0
0
A few months ago I updated my profile on LinkedIN, and adjusted my position as CTO and founder of Athoa Ltd, a British company currently active for translation services and events that in the past hosted a couple of interesting open source projects. I simply forgot to disable the email notification to my connections, set by default, and in 2-3 hours I received tens of messages from friends and ex-colleagues who were curious to hear about my new adventure.

Today, I changed my profile on LinkedIN again and have left the email notification set on purpose.

As of today, I join the team at ScaleDB. My role is to define the product and the strategy for the company, working closely with CEO Tom Arthur, CTO Moshe Shadmon, CMO Mike Hogan and the rest of the team.

Leaving Canonical

The last nine months at Canonical have been an outstanding and crazily intense journey. I learned as I never learned before about systems and network infrastructures, and I met an amazing team of core engineers. It has been a unique experience, one of those that only come along once in a lifetime - I really mean it - and I will never forget it.

The decision to leave Canonical came after a lot of thinking and many sleepless nights. I met so many great people that in many ways, are making history in IT. In my team under Dan Poler, I worked with experienced Cloud and Solutions Architects that can analyze problems, discuss architectures and suggest solutions from the high level view, down to the kernel of the operating system and even to the silicon of systems and devices. Chris Kenyon and John Zannos teams are called “Sales”, but they are really advisors for a growing ecosystem of providers and adopters of Ubuntu and OpenStack technologies.

I have been inspired by the dedication and leadership of Canonical CEO Jane Silber. Jane has the difficult job of leading a company that is moving at lightspeed in many different directions, so that the technology that powers clouds, networks, end users and small devices can share the same kernel and will eventually converge. Jane is in my opinion the leading force, making Canonical blossom like a plum tree in mid-winter, when the rest of the of the nature still sleeps under the snow.

My greatest experience at Canonical has been working with Mark Shuttleworth. Mark is an inspiration not only for the people of Canonical or for the users of Ubuntu, but for us all. Mark’s energy and passion are second only to his great vision for the future. I recommend everybody to follow Mark’s blog and watch or attend his talks. His attention to detail and search for perfection never shadows the core message and understanding of the big picture; for this reason, both experienced listeners and newbies will have takeaways from his talks.

Back in June last year, I decided to join Canonical because of Mark’s vision. His ideas were in sync with what I wanted to bring at SkySQL/MariaDB. At Canonical, I could see this vision materialize in the direction the products were going, only on larger scale. This experience has reinforced in me the belief that we have an amazing opportunity right in front of us. The world is changing dramatically and at a speed that is incomparable with the past, even when compared with the first 10 years of the new millennium. We must think out of the box and reconsider the models that companies have used so far to sustain their business, since some of them are already anachronistic and create artificial barriers that will eventually collapse.

This experience at Canonical will stay with me forever and I hope to make a good use of what I have learned so far and all that I will learn in the future from Mark.

Joining ScaleDB

The last Percona Live was a great event. It was great to see so many friends and ex-colleagues again, now working on different companies but gathering together once a year as in a school reunion. Percona has now become a mature company, but more importantly, it has reached its maturity growing organically. The results are outstanding and the new course to be a global player in the world of databases looks even more promising.

The list of people and companies I would like to mention is simply too long and it would be a subject for a post per se. I found the MySQL world more active than ever. In this Percona Live I found the perfect balance between solid and mature technologies that are constantly improving, and new and disruptive technologies that are coming out under the same MySQL roof.

I simply feel as I am part of this world, and it is part of me. I worked with databases in many different roles for all my life, first with Digital/Oracle RDB and Digital/HP Datatrieve, then with IBM/Informix, Oracle, Sybase and SQLServer, and last with MySQL. I am looking at this world with the eyes of someone who has been enriched by new experiences. I simply think I have more to offer to this market than to networks and systems infrastructures. I therefore decided to come back. I also feel I can offer more in designing and defining products than in running services.

ScaleDB seems to me the company where I can express myself and I can help more at this point of my working life. With my previous role as advisor for the company, working on products and strategies just feels natural to me. The position is also compatible with my intention to improve and extend my involvement in the MySQL ecosystem, not only as MariaDB Ambassador, but also and equally advocating for Oracle and Percona products.

I also believe that MySQL should not be an isolated world from the rest of the database market. I already expressed my interest in Hadoop and other DB technologies in the past, and I believe that there should be more integration and sharing of information and experiences among these products.

I’ve known and have been working with Moshe Shadmon, ScaleDB CTO, for many years. Back in 2007, we spent time together discussing the use, advantages and disadvantages of distributed databases. At the time, we were talking about the differences between Oracle RAC, MySQL/NDB and DB/2, their strong and weak points, what needed to be improved. That was the time when ScaleDB as a technology started taking the shape that it has today.

ScaleDB is an amazing technology. It is currently usable as a storage engine with MariaDB 10.0, it has been developed with the idea of a cluster database from the ground up. As for MySQL in 2005, when the goal was to provide performance, scalability and ease of use in a single product, ScaleDB today provides more performance and greater scalability, without compromising availability and the use of standard SQL/MySQL. The engineering team at ScaleDB has recently worked on an amazing extension of their technology to sustain fast inserts and real-time queries on commodity hardware, at a fraction of the cost of NoSQL alternatives. This addition makes ScaleDB the perfect solution for storing and retrieving time series data, which is the essence for stream analytics and Internet of Things.

I believe ScaleDB has the incredible potential to become a significant player in the DB world, not only in MySQL. I feel excited and honored to be given the opportunity to work on this new adventure. I will try my hardest to serve the MySQL ecosystem in the best possible way, contributing to its success and improving the collaboration of companies - providers, customers, developers and end users - in MySQL and in the world of databases.

Now hop onto the new ride, the future is already here...


PlanetMySQL Voting: Vote UP / Vote DOWN
Viewing all 18838 articles
Browse latest View live


<script src="https://jsc.adskeeper.com/r/s/rssing.com.1596347.js" async> </script>