Quantcast
Channel: Planet MySQL
Viewing all 18838 articles
Browse latest View live

Optimizing Out-of-order Parallel Replication with MariaDB 10.0

$
0
0
Fri, 2015-05-22 07:19
geoff_montee_g

Out-of-order parallel replication is a great feature in MariaDB 10.0 that improves replication performance by committing independent transactions in parallel on a slave. If slave_parallel_threads is greater than 0, then the SQL thread will instruct multiple worker threads to concurrently apply transactions with different domain IDs.

If an application is setting the domain ID, and if parallel replication is enabled in MariaDB, then out-of-order parallel replication should mostly work automatically. However, depending on an application's transaction size and the slave's lag behind the master, slave_parallel_max_queued may have to be adjusted. In this blog post, I'll show an example where this is the case.

Configure the master and slave

For our master, let's configure the following settings:

[mysqld]
max_allowed_packet=1073741824
log_bin
binlog_format=ROW
sync_binlog=1
server_id=1

For our slave, let's configure the following:

[mysqld]
server_id=2
slave_parallel_threads=2
slave_domain_parallel_threads=1
slave_parallel_max_queued=1KB

In our test, we plan to use two different domain IDs, so slave_parallel_threads is set to 2. Also, notice how small slave_parallel_max_queued is here: it is only set to 1 KB. With such a small value, it will be easier to see the behavior I want to demonstrate.

Set up replication on master

Now, let's set up the master for replication:

MariaDB [(none)]> CREATE USER 'repl'@'192.168.1.46' IDENTIFIED BY 'password';
Query OK, 0 rows affected (0.00 sec)

MariaDB [(none)]> GRANT REPLICATION SLAVE ON *.* TO 'repl'@'192.168.1.46';
Query OK, 0 rows affected (0.00 sec)

MariaDB [(none)]> RESET MASTER;
Query OK, 0 rows affected (0.22 sec)

MariaDB [(none)]> SHOW MASTER STATUS\G
*************************** 1. row ***************************
            File: master-bin.000001
        Position: 313
    Binlog_Do_DB: 
Binlog_Ignore_DB: 
1 row in set (0.00 sec)

MariaDB [(none)]> SELECT BINLOG_GTID_POS('master-bin.000001', 313);
+-------------------------------------------+
| BINLOG_GTID_POS('master-bin.000001', 313) |
+-------------------------------------------+
|                                           |
+-------------------------------------------+
1 row in set (0.00 sec)

If you've set up GTID replication with MariaDB 10.0 before, you've probably used BINLOG_GTID_POS to convert a binary log position to its corresponding GTID position. On newly installed systems like my example above, this GTID position might be blank.

Set up replication on slave

Now, let's set up replication on the slave:

MariaDB [(none)]> SET GLOBAL gtid_slave_pos ='';
Query OK, 0 rows affected (0.09 sec)

MariaDB [(none)]> CHANGE MASTER TO master_host='192.168.1.45', master_user='repl', master_password='password', master_use_gtid=slave_pos;
Query OK, 0 rows affected (0.04 sec)

MariaDB [(none)]> START SLAVE;
Query OK, 0 rows affected (0.01 sec)

MariaDB [(none)]> SHOW SLAVE STATUS\G
*************************** 1. row ***************************
               Slave_IO_State: Waiting for master to send event
                  Master_Host: 192.168.1.45
                  Master_User: repl
                  Master_Port: 3306
                Connect_Retry: 60
              Master_Log_File: master-bin.000001
          Read_Master_Log_Pos: 313
               Relay_Log_File: slave-relay-bin.000002
                Relay_Log_Pos: 601
        Relay_Master_Log_File: master-bin.000001
             Slave_IO_Running: Yes
            Slave_SQL_Running: Yes
              Replicate_Do_DB: 
          Replicate_Ignore_DB: 
           Replicate_Do_Table: 
       Replicate_Ignore_Table: 
      Replicate_Wild_Do_Table: 
  Replicate_Wild_Ignore_Table: 
                   Last_Errno: 0
                   Last_Error: 
                 Skip_Counter: 0
          Exec_Master_Log_Pos: 313
              Relay_Log_Space: 898
              Until_Condition: None
               Until_Log_File: 
                Until_Log_Pos: 0
           Master_SSL_Allowed: No
           Master_SSL_CA_File: 
           Master_SSL_CA_Path: 
              Master_SSL_Cert: 
            Master_SSL_Cipher: 
               Master_SSL_Key: 
        Seconds_Behind_Master: 0
Master_SSL_Verify_Server_Cert: No
                Last_IO_Errno: 0
                Last_IO_Error: 
               Last_SQL_Errno: 0
               Last_SQL_Error: 
  Replicate_Ignore_Server_Ids: 
             Master_Server_Id: 1
               Master_SSL_Crl: 
           Master_SSL_Crlpath: 
                   Using_Gtid: Slave_Pos
                  Gtid_IO_Pos: 
1 row in set (0.00 sec)

Create some test tables on master

Let's set up some test tables on the master. These will automatically be replicated to the slave. We want to test parallel replication with two domains, so we will set up two separate, but identical tables, in two different databases:

MariaDB [(none)]> CREATE DATABASE db1;
Query OK, 1 row affected (0.00 sec)

MariaDB [(none)]> CREATE TABLE db1.test_table (
    -> id INT AUTO_INCREMENT PRIMARY KEY,
    -> file BLOB
    -> );
Query OK, 0 rows affected (0.12 sec)

MariaDB [(none)]> CREATE DATABASE db2;
Query OK, 1 row affected (0.01 sec)

MariaDB [(none)]> CREATE TABLE db2.test_table (
    -> id INT AUTO_INCREMENT PRIMARY KEY,
    -> file BLOB
    -> );
Query OK, 0 rows affected (0.06 sec)

Stop SQL thread on slave

For the test, we want the slave to fall behind the master, and we want its relay log to grow. To make this happen, let's stop the SQL thread on the slave:

MariaDB [(none)]> STOP SLAVE SQL_THREAD;
Query OK, 0 rows affected (0.02 sec)

Insert some data on master

Now, in a Linux shell on the master, let's create a random 1 MB file:

[gmontee@master ~]$ dd if=/dev/urandom of=/tmp/file.out bs=1MB count=1
1+0 records in
1+0 records out
1000000 bytes (1.0 MB) copied, 0.144972 s, 6.9 MB/s
[gmontee@master ~]$ chmod 0644 /tmp/file.out

Now, let's create a script to insert the contents of the file into both of our tables in db1 and db2 with different values of gtid_domain_id:

tee /tmp/domain_test.sql <<EOF
SET SESSION gtid_domain_id=1;
BEGIN;
INSERT INTO db1.test_table (file) VALUES (LOAD_FILE('/tmp/file.out'));
COMMIT;
SET SESSION gtid_domain_id=2;
BEGIN;
INSERT INTO db2.test_table (file) VALUES (LOAD_FILE('/tmp/file.out'));
COMMIT;
EOF

After that, let's run the script a bunch of times. We can do this with a bash loop:

[gmontee@master ~]$ { for ((i=0;i<1000;i++)); do cat /tmp/domain_test.sql; done; } | mysql --max_allowed_packet=1073741824 --user=root

Restart SQL thread on slave

Now the relay log on the slave should have grown quite a bit. Let's restart the SQL thread and watch the transactions get applied. To do this, let's open up two shells on the slave.

On the first shell on the slave, connect to MariaDB and restart the SQL thread:

MariaDB [(none)]> START SLAVE SQL_THREAD;
Query OK, 0 rows affected (0.00 sec)

On the second shell, let's look at SHOW PROCESSLIST output in a loop:

[gmontee@slave ~]$ for i in {1..1000}; do mysql --user=root --execute="SHOW PROCESSLIST;"; sleep 1s; done;

Take a look at the State column for the slave's SQL thread:

+----+-------------+-----------+------+---------+--------+-----------------------------------------------+------------------+----------+
| Id | User        | Host      | db   | Command | Time   | State                                         | Info             | Progress |
+----+-------------+-----------+------+---------+--------+-----------------------------------------------+------------------+----------+
|  3 | system user |           | NULL | Connect |    139 | closing tables                                | NULL             |    0.000 |
|  4 | system user |           | NULL | Connect |    139 | Waiting for work from SQL thread              | NULL             |    0.000 |
|  6 | system user |           | NULL | Connect | 264274 | Waiting for master to send event              | NULL             |    0.000 |
| 10 | root        | localhost | NULL | Sleep   |     43 |                                               | NULL             |    0.000 |
| 21 | system user |           | NULL | Connect |     45 | Waiting for room in worker thread event queue | NULL             |    0.000 |
| 54 | root        | localhost | NULL | Query   |      0 | init                                          | SHOW PROCESSLIST |    0.000 |
+----+-------------+-----------+------+---------+--------+-----------------------------------------------+------------------+----------+

With such a low slave_parallel_max_queued value, it will probably say "Waiting for room in worker thread event queue." most of the time. The SQL thread doesn't have enough memory allocated to read-ahead more of the relay log. This can prevent the SQL thread from providing enough work for all of the worker threads. The worker threads will probably show a State value of "Waiting for work from SQL thread" more often.

Conclusion

If you expect to be able to benefit from parallel slave threads, but you find that the State column in SHOW PROCESSLIST often shows "Waiting for room in worker thread event queue" for your SQL thread, you should try increasing slave_parallel_max_queued to see if that helps. The default slave_parallel_max_queued value of 132 KB will probably be acceptable for most workloads. However, if you have large transactions or if your slave falls behind the master often, and you hope to use out-of-order parallel replication, you may have to adjust this setting. Of course, most users probably want to avoid large transactions and slave lag for other reasons as well.

Has anyone run into this problem before? Were you able to figure out a solution on your own?

About the Author

geoff_montee_g's picture

Geoff Montee is a Support Engineer with MariaDB. He has previous experience as a Database Administrator/Software Engineer with the U.S. Government, and as a System Administrator and Software Developer at Florida State University.


PlanetMySQL Voting: Vote UP / Vote DOWN

History Repeats: MySQL, MongoDB, Percona, and Open Source

$
0
0

History is repeating again. MongoDB is breaking out of the niche into the mainstream, performance and instrumentation are terrible in specific cases, MongoDB isn’t able to fix all the problems alone, and an ecosystem is growing.

Leaf

This should really be a series of blog posts, because there’s a book’s worth of things happening, but I’ll summarize instead.

  • MongoDB is in many respects closely following MySQL’s development, 10 years offset. Single index per query, MyISAM-like storage engine, etc. Background.
  • Tokutek built an excellent transactional storage engine and replaced MongoDB’s, calling it TokuMX. Results were dramatically better performance (plus ACID).
  • MongoDB’s response was to buy WiredTiger and make it the default storage engine in MongoDB 3.0.
  • Percona acquired Tokutek. A book should be written about this someday. The impact to both the MySQL and MongoDB communities cannot be understated. This changes everything. It also changes everything for Percona, which now has a truly differentiated product for both database offerings. This moves them solidly into being a product company, not just support/services/consulting; it is a good answer to the quandary of trying to keep up with the InnoDB engineers.
  • Facebook acquired Parse, which is probably one of the larger MongoDB installations.
  • Facebook’s Mark Callaghan, among others, stopped spending all his time on InnoDB mutexes and so forth. For the last year or so he’s been extremely active in the MongoDB community. The MongoDB community is lucky to have a genius of Mark’s caliber finding and solving problems. There are others, but if Mark Callaghan is working on your open source product in earnest, you’ve arrived.
  • VividCortex is building a MongoDB monitoring solution that will address many of the shortcomings of existing ones. (We have been a bit quiet about it, just out of busyness rather than a desire for secrecy, but now you know.) It’s in beta now.
  • Just as in MySQL, but even earlier, there are lots of -As-A-Service providers for MongoDB, and it’s likely a significant portion of future growth happens here.
  • MongoDB’s conference is jaw-droppingly expensive for a vendor, to the point of being exclusive. At the same time, MongoDB hasn’t quite recognized and embraced some of the things going on outside their walls. If you remember the events of 2009 in the MySQL community, Percona’s announcement of an alternative MongoDB conference might feel a little like deja vu. I’m not sure of the backstory behind this, though.

At the same time that history is repeating in the MongoDB world, a tremendous amount of stuff is happening quietly in other major communities too. Especially MySQL, but also in PostgreSQL, ElasticSearch, Cassandra and other opensource databases. I’m probably only qualified to write about the MySQL side of things; I’m pretty sure most people don’t know a lot of the interesting things that are going on that will have long-lasting effects. Maybe I’ll write about that someday.

In the meanwhile, I think we’re all in for an exciting ride as MongoDB proves me right.

Cropped image by 96dpi


PlanetMySQL Voting: Vote UP / Vote DOWN

Meet Devart ODBC Drivers for Oracle, SQL Server, MySQL, Firebird, InterBase, PostgreSQL, SQLite!

$
0
0

Devart team is proud to introduce a new product line - ODBC Drivers. We believe we can offer the best features, quality, and technical support for database application developers.


PlanetMySQL Voting: Vote UP / Vote DOWN

Introducing MySQL Performance Analyzer

$
0
0

At Yahoo, we manage a massive number of MySQL databases spread across multiple data centers. 

In order to identify and respond to performance issues, we rely on an extremely lightweight and robust web based tool to proactively investigate the issues in them.

The tool has real time tracking features and continually gathers the most important performance metrics, provides visualization and statistical analysis for quickly identifying performance patterns, bottlenecks and possible tuning opportunities.

Features

  • Lightweight Agentless Java Web Application
  • Rich User Interface
  • Gather and Store performance metrics 
  • Detect anomalies and send alerts
  • Access to Real time Performance data

Open Source

Today, we’re releasing MySQL Performance Analyzer. You can check out the code on GitHub.

We’re looking forward to interacting with the MySQL community and continue to develop new features. 

- MySQL Database Engineering Team, Yahoo


PlanetMySQL Voting: Vote UP / Vote DOWN

Optimizer Trace and EXPLAIN FORMAT=JSON in 5.7

$
0
0

I accidentally stumbled upon this Stack Overflow question this morning:

I am wondering if there is any difference in regards to performance between the following:

SELECT ... FROM ... WHERE someFIELD IN(1,2,3,4);
SELECT ... FROM ... WHERE someFIELD between  0 AND 5;
SELECT ... FROM ... WHERE someFIELD = 1 OR someFIELD = 2 OR someFIELD = 3 ...;

It is an interesting question because there was no good way to answer it when it was asked in 2009. All of the queries resolve to the same output in EXPLAIN. Here is an example using the sakila schema:

mysql> EXPLAIN SELECT * FROM film WHERE film_id BETWEEN 1 AND 5\G
mysql> EXPLAIN SELECT * FROM film WHERE film_id IN (1,2,3,4,5)\G
mysql> EXPLAIN SELECT * FROM film WHERE film_id =1 or film_id=2 or film_id=3 or film_id=4 or film_id=5\G
********* 1. row *********
           id: 1
  select_type: SIMPLE
        table: film
   partitions: NULL
         type: range
possible_keys: PRIMARY
          key: PRIMARY
      key_len: 2
          ref: NULL
         rows: 5
     filtered: 100.00
        Extra: Using where

Times have changed though. There are now a couple of useful features to show the difference :)

Optimizer Trace

Optimizer trace is a new diagnostic tool introduced in MySQL 5.6 to show how the optimizer is working internally. It is similar to EXPLAIN, with a few notable differences:

  • It doesn't just show the intended execution plan, it shows the alternative choices.
  • You enable the optimizer trace, then you run the actual query.
  • It is far more verbose in its output.

Here are the outputs for the three versions of the query:

  1. SELECT * FROM film WHERE film_id BETWEEN 1 AND 5
  2. SELECT * FROM film WHERE film_id IN (1,2,3,4,5)
  3. SELECT * FROM film WHERE film_id =1 or film_id=2 or film_id=3 or film_id=4 or film_id=5

What is the difference?

The optimizer trace output shows that the first query executes as one range, while the second and third execute as 5 separate single-value ranges:

                  "chosen_range_access_summary": {
                    "range_access_plan": {
                      "type": "range_scan",
                      "index": "PRIMARY",
                      "rows": 5,
                      "ranges": [
                        "1 <= film_id <= 1",
                        "2 <= film_id <= 2",
                        "3 <= film_id <= 3",
                        "4 <= film_id <= 4",
                        "5 <= film_id <= 5"
                      ]
                    },
                    "rows_for_plan": 5,
                    "cost_for_plan": 6.0168,
                    "chosen": true
                  }

This can also be confirmed with the handler counts from SHOW STATUS:

BETWEEN 1 AND 5: 
 Handler_read_key: 1
 Handler_read_next: 5
IN (1,2,3,4,5):
 Handler_read_key: 5
film_id =1 or film_id=2 or film_id=3 or film_id=4 or film_id=5:
 Handler_read_key: 5

So I would say that BETWEEN 1 AND 5 is the cheapest query, because it finds one key and then says next, next, next until finished. The optimizer seems to agree with me. A single range access plus next five times costs 2.0168 instead of 6.0168:

                  "chosen_range_access_summary": {
                    "range_access_plan": {
                      "type": "range_scan",
                      "index": "PRIMARY",
                      "rows": 5,
                      "ranges": [
                        "1 <= film_id <= 5"
                      ]
                    },
                    "rows_for_plan": 5,
                    "cost_for_plan": 2.0168,
                    "chosen": true
                  }
                }

For context, a cost unit is a logical representation of approximately one random IO. It is stable to compare costs between different execution plans.

Ranges are not all equal

Perhaps a better example to demonstrate this, is the difference between these two ranges:

  • SELECT * FROM film WHERE film_id BETWEEN 1 and 20
  • SELECT * FROM film WHERE (film_id BETWEEN 1 and 10) or (film_id BETWEEN 911 and 920)

It's pretty obvious that the second one needs to execute in two separate ranges. EXPLAIN will not show this difference, and both queries appear the same:

********* 1. row *********
           id: 1
  select_type: SIMPLE
        table: film
   partitions: NULL
         type: range
possible_keys: PRIMARY
          key: PRIMARY
      key_len: 2
          ref: NULL
         rows: 20
     filtered: 100.00
        Extra: Using where

Two distinct separate ranges may be two separate pages, and thus have different cache efficiency on the buffer pool. It should be possible to distinguish between the two.

EXPLAIN FORMAT=JSON

EXPLAIN FORMAT=JSON was introduced in MySQL 5.6 along with OPTIMIZER TRACE, but where it really becomes useful is MySQL 5.7. The JSON output will now include cost information (as well as showing separate ranges as attached_condition):

********* 1. row *********
EXPLAIN: {
  "query_block": {
    "select_id": 1,
    "cost_info": {
      "query_cost": "10.04"
    },
    "table": {
      "table_name": "film",
      "access_type": "range",
      "possible_keys": [
        "PRIMARY"
      ],
      "key": "PRIMARY",
      "used_key_parts": [
        "film_id"
      ],
      "key_length": "2",
      "rows_examined_per_scan": 20,
      "rows_produced_per_join": 20,
      "filtered": "100.00",
      "cost_info": {
        "read_cost": "6.04",
        "eval_cost": "4.00",
        "prefix_cost": "10.04",
        "data_read_per_join": "15K"
      },
      "used_columns": [
        "film_id",
        "title",
        "description",
        "release_year",
        "language_id",
        "original_language_id",
        "rental_duration",
        "rental_rate",
        "length",
        "replacement_cost",
        "rating",
        "special_features",
        "last_update"
      ],
      "attached_condition": "((`film`.`film_id` between 1 and 10) or (`film`.`film_id` between 911 and 920))"
    }
  }
}

With the FORMAT=JSON output also showing cost, we can see that two ranges costs 10.04, versus one big range costing 9.04 (not shown). These queries are not identical in cost even though they are in EXPLAIN output.

Conclusion

I have heard many users say "joins are slow", but a broad statement like this misses magnitude. By including the cost information in EXPLAIN we get all users to speak the same language. We can now say "this join is expensive", which is a much better distinction :)

It is time to start using OPTIMIZER TRACE, and particularly in 5.7 ditch EXPLAIN for EXPLAIN FORMAT=JSON.


PlanetMySQL Voting: Vote UP / Vote DOWN
What Makes A Database Mature?

$
0
0

Many database vendors would like me to take a look at their products and consider adopting them for all sorts of purposes. Often they’re pitching something quite new and unproven as a replacement for mature, boring technology I’m using happily.

I would consider a new and unproven technology, and I often have. As I’ve written previously, though, a real evaluation takes a lot of effort, and that makes most evaluations non-starters.

Perhaps the most important thing I’m considering is whether the product is mature. There are different levels of maturity, naturally, but I want to understand whether it’s mature enough for me to take a look at it. And in that spirit, it’s worth understanding what makes a database mature.

Bristlecone

For my purposes, maturity really means demonstrated capability and quality with a lot of thought given to all the little things. The database needs to demonstrate the ability to solve specific problems well and with high quality. Sometimes this comes from customers, sometimes from a large user community (who may not be customers).

Here are some things I’ll consider when thinking about a database, in no particular order.

  • What problem do I have? It’s easy to fixate on a technology and start thinking about how awesome it is. Some databases are just easy to fall in love with, to be frank. Riak is in this category. I get really excited about the features and capabilities, the elegance. I start thinking of all the things I could do with Riak. But now I’m putting the cart before the horse. I need to think about my problems first.
  • Query flexibility. Does it offer sophisticated execution models to handle the nuances of real-world queries? If not, I’ll likely run into queries that run much more slowly than they should, or that have to be pulled into application code. MySQL has lots of examples of this. Queries such as ORDER BY with a LIMIT clause, which are super-common for web workloads, did way more work than they needed to in older versions of MySQL. (It’s better now, but the scars remain in my mind).
  • Query flexibility. The downside of a sophisticated execution engine with smart plans is they can go very wrong. One of the things people like about NoSQL is the direct, explicit nature of queries, where an optimizer can’t be too clever for its own good and cause a catastrophe. A database needs to make up its mind: if it’s simple and direct, OK. If it’s going to be smart, the bar is very high. A lot of NoSQL databases that offer some kind of “map-reduce” query capability fall into the middle ground here: key-value works great, but the map-reduce capability is far from optimal.
  • Data protection. Everything fails, even things you never think about. Does it automatically check for and guard against bit rot, bad memory, partial page writes, and the like? What happens if data gets corrupted? How does it behave?
  • Backups. How do you back up your data? Can you do it online, without interrupting the running database? Does it require proprietary tools? If you can do it with standard Unix tools, there’s infinitely more flexibility. Can you do partial/selective backups? Differential backups since the last backup?
  • Restores. How do you restore data? Can you do it online, without taking the database down? Can you restore data in ways you didn’t plan for when taking the backup? For example, if you took a full backup, can you efficiently restore just a specific portion of the data?
  • Replication. What is the model—synchronous, async, partial, blend? Statement-based, change-based, log-based, or something else? How flexible is it? Can you do things like apply intensive jobs (schema changes, big migrations) to a replica and then trade master-and-replica? Can you filter and delay and fidget with replication all different ways? Can you write to replicas? Can you chain replication? Replication flexibility is an absolutely killer feature. Operating a database at scale is very hard with inflexible replication. Can you do multi-source replication? If replication breaks, what happens? How do you recover it? Do you have to rebuild replicas from scratch? Lack of replication flexibility and operability is still one of the major pain points in PostgreSQL today. Of course, MySQL’s replication provides a lot of that flexibility, but historically it didn’t work reliably, and gave users a huge foot-gun. I’m not saying either is best, just that replication is hard but necessary.
  • Write stalls. Almost every new database I’ve seen in my career, and a lot of old ones, has had some kind of write stalls. Databases are very hard to create, and typically it takes 5-10 years to fix these problems if they aren’t precluded from the start (which they rarely are). If you don’t talk about write stalls in your database in great detail, I’m probably going to assume you are sweeping them under the rug or haven’t gone looking for them. If you show me you’ve gone looking for them and either show that they’re contained or that you’ve solved them, that’s better.
  • Independent evaluations. If you’re a solution in the MySQL space, for example, you’re not really serious about selling until you’ve hired Percona to do evaluations and write up the results. In other database communities, I’d look for some similar kind of objective benchmarking and evaluations.
  • Operational documentation. How good is your documentation? How complete? When I was at Percona and we released XtraBackup, it was clearly a game-changer, except that there was no documentation for a long time, and this hurt adoption badly. Only a few people could understand how it worked. There were only a few people inside of Percona who knew how to set it up and operate it, for that matter. This is a serious problem for potential adopters. The docs need to explain important topics like daily operations, what the database is good at, what weak points it has, and how to accomplish a lot of common tasks with it. Riak’s documentation is fantastic in this regard. So is MySQL’s and PostgreSQL’s.
  • Conceptual documentation. How does it work, really? One database that I think has been hurt a little bit by not really explaining how-it-works is NuoDB, which used an analogy of a flock of birds all working together. It’s a great analogy, but it needs to be used only to set up a frame of reference for a deep-dive, rather than as a pat answer. (Perhaps somewhat unfairly, I’m writing this offline, and not looking to see if NuoDB has solved this issue I remember from years ago.) Another example was TokuDB’s Fractal Tree indexes. For a long time it was difficult to understand exactly what fractal tree indexes really did. I can understand why, and I’ve been guilty of the same thing, but I wasn’t selling a database. People really want to feel sure they understand how it works before they’ll entrust it with their data, or even give it a deep look. Engineers, in particular, will need to be convinced that the database is architected to achieve its claimed benefits.
  • High availability. Some databases are built for HA, and those need to have a really clear story around how they achieve it. Walk by the booth of most new database vendors at a conference and ask them how their automatically HA solution works, and they’ll tell you it’s elegantly architected for zero downtime and seamless replacement of failed nodes and so on. But as we know, these are really hard problems. Ask them about their competition, and they’ll say “sure, they claim the same stuff, but our code actually works in failure scenarios, and theirs doesn’t.” They can’t all be right.
  • Monitoring. What does the database tell me about itself? What can I observe externally? Most new or emerging databases are basically black boxes. This makes them very hard to operate in real production scenarios. Most people building databases don’t seem to know what a good set of monitoring capabilities even looks like. MemSQL is a notable exception, as is Datastax Enterprise. As an aside, the astonishing variety of opensource databases that are not monitorable in a useful way is why I founded VividCortex.
  • Tooling. It can take a long time for a database’s toolbox to become robust and sophisticated enough to really support most of the day-to-day development and operational duties. Good tools for supporting the trickier emergency scenarios often take much longer. (Witness the situation with MySQL HA tools after 20 years, for example.) Similarly, established databases often offer rich suites of tools for integrating with popular IDEs like Visual Studio, spreadsheets and BI tools, migration tools, bulk import and export, and the like.
  • Client libraries. Connecting to a database from your language of choice, using idiomatic code in that language, is a big deal. When we adopted Kafka at VividCortex, it was tough for us because the client libraries at the time were basically only mature for Java users. Fortunately, Shopify had open-sourced their Kafka libraries for Go, but unfortunately they weren’t mature yet.
  • Third-party offerings. Sometimes people seem to think that third-party providers are exclusively the realm of open-source databases, where third parties are on equal footing with the parent company, but I don’t think this is true. Both Microsoft and Oracle have enormous surrounding ecosystems of companies providing alternatives for practically everything you could wish, except for making source code changes to the database itself. If I have only one vendor to help me with consulting, support, and other professional services, it’s a dubious proposition. Especially if it’s a small team that might not have the resources to help me when I need it most.

The most important thing when considering a database, though, is success stories. The world is different from a few decades ago, when the good databases were all proprietary and nobody knew how they did their magic, so proofs of concept were a key sales tactic. Now, most new databases are opensource and the users either understand how they work, or rest easy in the knowledge that they can find out if they want. And most are adopted at a ratio of hundreds of non-paying users for each paying customer. Those non-paying users are a challenge for a company in many ways, but at least they’re vouching for the solution.

Success stories and a community of users go together. If I can choose from a magical database that claims to solve all kinds of problems perfectly, versus one that has broad adoption and lots of discussions I can Google, I’m not going to take a hard look at the former. I want to read online about use cases, scaling challenges met and solved, sharp edges, scripts, tweaks, tips and tricks. I want a lot of Stack Exchange discussions and blog posts. I want to see people using the database for workloads that look similar to mine, as well as different workloads, and I want to hear what’s good and bad about it. (Honest marketing helps a lot with this, by the way. If the company’s own claims match bloggers’ claims, a smaller corpus online is more credible as a result.)

Roots

These kinds of dynamics help explain why most of the fast-growing emerging databases are opensource. Opensource has an automatic advantage because of free users vouching for the product. Why would I ever consider a proof-of-concept to do a sales team a favor, at great cost and effort to myself, when I could use an alternative database that’s opensource and has an active community discussing the database? In this environment, the proof of concept selling model is basically obsolete for the mass market. It may still work for specialized applications where you’ll sell a smaller number of very pricey deals, but it doesn’t work in the market of which I’m a part.

In fact, I’ve never responded positively to an invitation to set up a PoC for a vendor (or even to provide data for them to do it). It’s automatically above my threshold of effort. I know that no matter what, it’s going to involve a huge amount of time and effort from me or my teams.

There’s another edge-case—databases that are built in-house at a specific company and then are kicked out of the nest, so to speak. This is how Cassandra got started, and Kafka too. But the difference between a database that works internally for a company (no matter how well it works for them) and one that’s ready for mass adoption is huge, and you can see that easily in both of those examples. I suspect few people have that experience to point to, but probably a lot of readers have released some nifty code sample as open-source and seen how different it is to create an internal-use library, as opposed to one that’ll be adopted by thousands or more people.

Remarkably few people at database companies seem to understand the things I’ve written about above. The ones who do—and I’ve named some of them—might have great success as a result. The companies who aren’t run by people who have actually operated databases in their target markets recently, will probably have a much harder time of it.

I don’t make much time to coach companies on how they should approach me. It’s not my problem, and I feel no guilt saying no without explanation. (One of my favorite phrases is “no is a complete sentence.”) But enough companies have asked me, and I have enough friends at these companies, that I thought it would be helpful to write this up. Hopefully this serves its intended purpose and doesn’t hurt any feelings. Please use the comments to let me know if I can improve this post.

Bristlecone pine by yenchao, roots by mclcbooks


PlanetMySQL Voting: Vote UP / Vote DOWN
Leveraging AWS tools to speed up management of Galera Cluster on Amazon Cloud

$
0
0

We previously covered basic tuning and configuration best practices for MyQL Galera Cluster on AWS. In this blog post, we’ll go over some AWS features/tools that you may find useful when managing Galera on Amazon Cloud. This won’t be a detailed how-to guide as each tool described below would warrant its own blog post. But this should be a good overview of how you can use the AWS tools at your disposal.

EBS backups

If you have chosen EBS volumes as storage for your database (you could have chosen ephemeral volumes too), you can benefit greatly from their ability of taking snapshots of the data.

In general, there are two ways of running backups:

  • Logical backup executed in the form of mysqldump, mydumper or similar tools. The result of it is a set of SQL commands which should recreate your database;
  • Physical backup created, very often, using xtrabackup. 

Xtrabackup is a great tool but it is limited by network performance. If you create a streaming backup, you need to push data over the network. If you have local backups but you want to provision a new host, you have to push the data over the network.

EBS volumes, on the other hand, allow you to take snapshots. Such snapshot can be then used to create a new EBS volume, which can be mounted to an existing instance or a new one. It limits the overhead of managing backups - no need to move them from one place to another, the snapshots are just there, when you need them.

There are couple of things you’d want to consider before relying on EBS snapshots as a backup solution. First - it is a snapshot. The snapshot is taken at a given time for a given volume. If MySQL is up, when it comes to data integrity, the snapshot data is somewhat equivalent to that of a forced power-off. If you’d like to restore a database from the snapshot, you should expect to perform InnoDB recovery - a process which may take a while to complete. You may minimize this impact by either running ‘FLUSH TABLES WITH READ LOCK’ as a part of the snapshotting process or, even better for the data consistency, you may stop the MySQL process and take a cold backup. As you can see, it’s up to you what kind of consistency you want to achieve, keeping in mind that consistency comes with the price of downtime (longer or shorter) of that instance.

If you are using multiple EBS volumes and created a RAID using mdadm, then you need to take a snapshot of all the EBS volumes at the same time. This is a tricky process and there are tools which can help you here. The most popular one is ec2-consistent-snapshot. This tool gives you plenty of options to choose from. You can lock MySQL with ‘FLUSH TABLE WITH READ LOCK’, you can stop MySQL, you can freeze the filesystem. Please keep in mind that you need to perform a significant amount of testing to ensure the backup process works smoothly and does not cause issues. Luckily, with the recent introduction of large EBS volumes, the need for RAIDed setups in EC2 decreases - more workloads can now fit in a single EBS volume.

Please keep in mind that there are plenty of use cases where using xtrabackup instead of (or along with, why not?) EBS snapshots makes much more sense. For example, it’s really hard to take a snapshot every 5 minutes - xtrabackup’s incremental backup will work just fine. Additionally (and it’s true for all physical backups) you want to make a copy of binary logs, to have the ability to restore data to a certain point in time. You can use snapshots as well for that.

Provisioning new nodes using EBS snapshot

If we use EBS snapshots as backup method, we can use them to provision new nodes. It is very easy to provision a node in Galera cluster - just create an empty one, start MySQL and watch the full state transfer (SST). The main downside of SST is the time needed for it. It’s most probably using xtrabackup so, again, network throughput is crucial in overall performance. Even with fast networks, if we are talking about large data sets of hundreds of gigabytes or more, the syncing process will take hours to complete. It is independent of the actual number of write operations - e.g., even if we have a very small number of DML’s on a terabyte database, we still have to copy 1TB of data.

Luckily, Galera provides an option to make  an incremental state transfer (IST). If all of the missing data is available in the gcache on the donor node, only that will be transferred, without the need of moving all of the data.
We can leverage this process by using a recent EBS snapshot to create a new node - if the snapshot is recent enough, other members of the cluster may still have the required data in their gcache.

By default, the gcache is set to 128M, which is fairly small buffer. It can be increased though. To determine how long the gcache can store data, knowing its size is not enough - it depends on the writeset sizes and number of writesets per second. You can monitor ‘wsrep_local_cached_downto’ variable to know the last writeset that is still cached. Below is a simple bash script which shows you for how long your gcache can store data.

#!/bin/bash

wsrep_last_committed=$(mysql -e "show global status like 'wsrep_last_committed'" | grep wsrep_last_committed | awk '{print $2}')
wsrep_local_cached_downto=$(mysql -e "show global status like 'wsrep_local_cached_downto'" | grep wsrep_local_cached_downto | awk '{print $2}')
date
echo ${wsrep_last_committed}

while [ ${wsrep_local_cached_downto} -lt ${wsrep_last_committed} ]
do
    wsrep_local_cached_downto=$(mysql -e "show global status like 'wsrep_local_cached_downto'" | grep wsrep_local_cached_downto | awk '{print $2}')
    sleep 1s
done
date
echo ${wsrep_local_cached_downto}

Once we size the gcache according to our workload, we can start to benefit from it.

We would start by creating a node and then attach to it an existing EBS volume created from a snapshot of our data. Once the node is up, it’s time to check the grastate.dat file to make sure the proper uuid and sequence number are there. If you used a cold backup, most likely that data is already in place. If MySQL was online when the snapshot was taken, then you’ll probably see something like:

# GALERA saved state
version: 2.1
uuid:    dbf2c394-fe2a-11e4-8622-36e83c1c99d0
seqno:   -1
cert_index:

In this is the case, we need to get a correct sequence number by running:

$ mysqld_safe --wsrep-recover

In the result we should get (among other messages) something similar to:

150519 13:53:10 mysqld_safe Assigning dbf2c394-fe2a-11e4-8622-36e83c1c99d0:14 to wsrep_start_position

We are interested in:

dbf2c394-fe2a-11e4-8622-36e83c1c99d0:14 

That’s our uuid and sequence number - now we have to edit the grastate.dat file and set the uuid and seqno in the same way.

This should be enough (as long as the needed data is still cached on the donor node) to bring the node into the cluster without full state transfer (SST). Don’t be surprised - IST may take a while too. It really depends on the particular workload and network speed - you’d have to test in your particular environment to tell which way of provisioning is more efficient.

As always, when working with EBS snapshots, you need to remember the warmup process. Amazon suggests that the performance may be up to 50% lower if the volume is not warmed up. It is up to you if you’d like to perform the warmup or not but you need to remember that this process may takes several hours.If this is a planned scale-up, probably it is a good idea to set the  wsrep_desync to ‘ON’ and perform the warmup process.

Using Amazon Machine Images to speed up provisioning

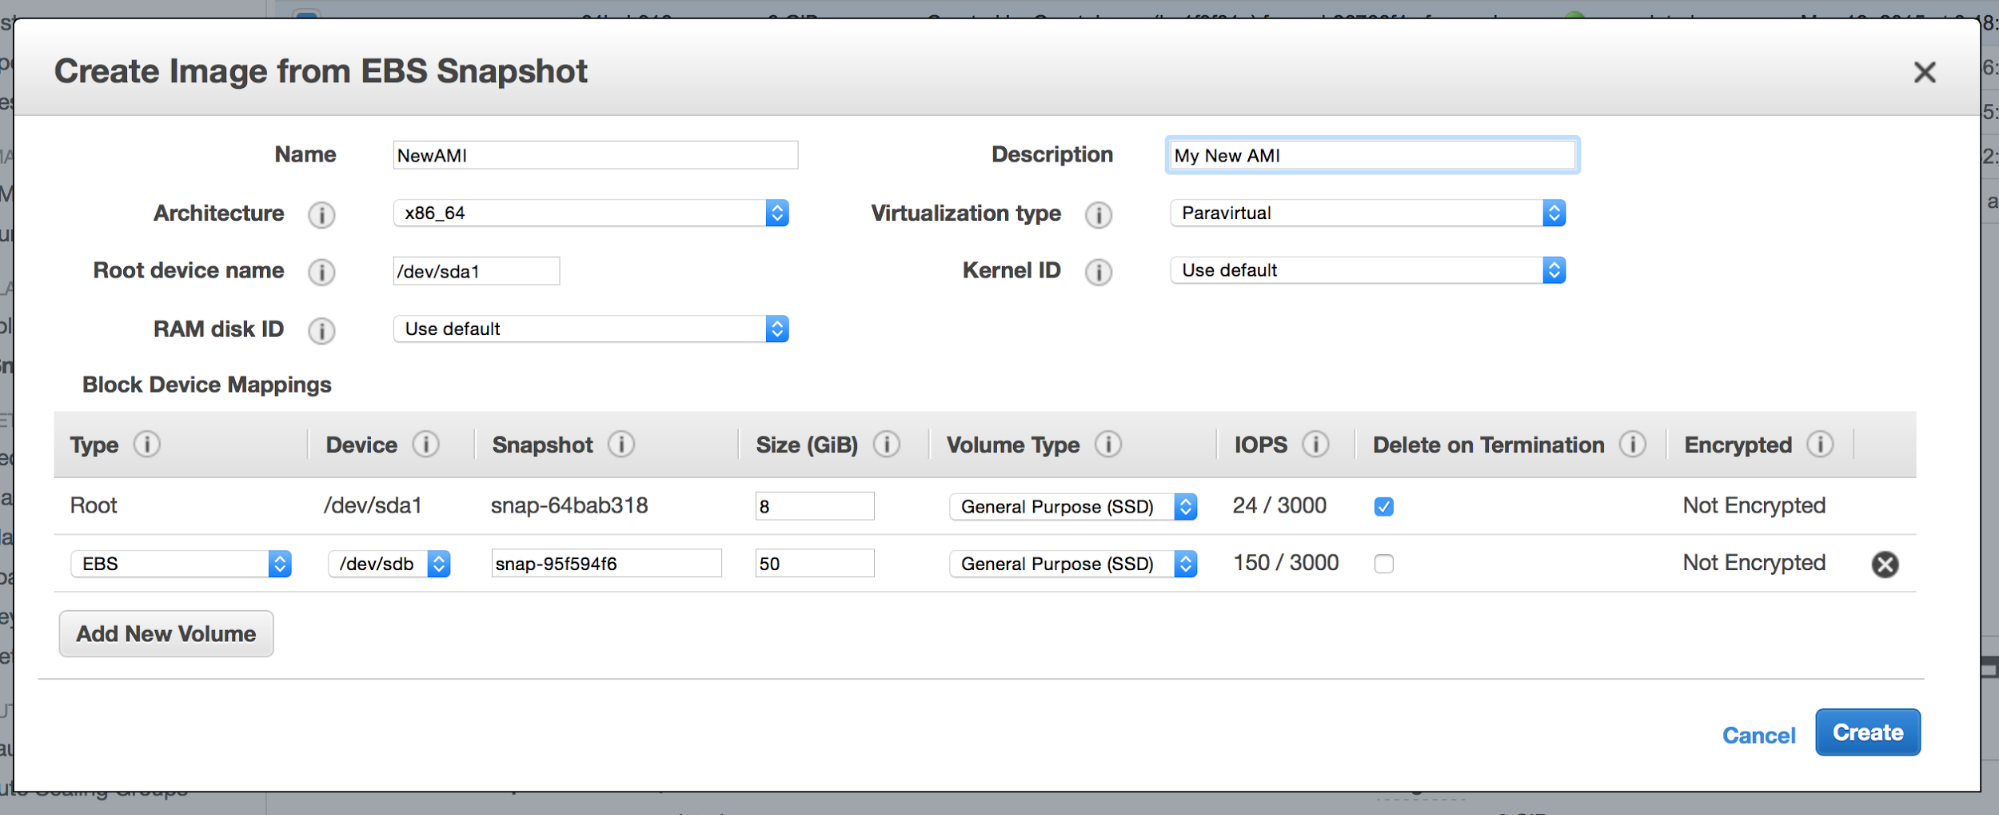
As you may know, an EC2 instance is created from an AMI - image of the instance. It is possible to create your own AMI using either CLI or just clicking in the web console. Why are we talking about it? Well, AMIs may come in handy when you customized your nodes heavily. Let’s say you installed a bunch of additional software or tools that you use in your day-to-day operations. Yes, those missing bits can be installed manually when provisioning a new node. Or, those missing bits can be installed via Chef/Puppet/Ansible/you_name_it in the provisioning process. But both manual installation or an automated provisioning process can take some time. Why not rely on an AMI to deliver us the exact environment we want? You can setup your node the way you like, pick it in the web console and then choose “Image” -> “Create Image” option. An AMI will be created based on the EBS snapshot and you can use it later to provision new nodes.

AMI’s can also be created from existing snapshots. This is actually great because, with a little bit of scripting, one can easily bundle the latest snapshots with the AMI and create an image that includes an almost up to date data directory.

Auto scaling groups

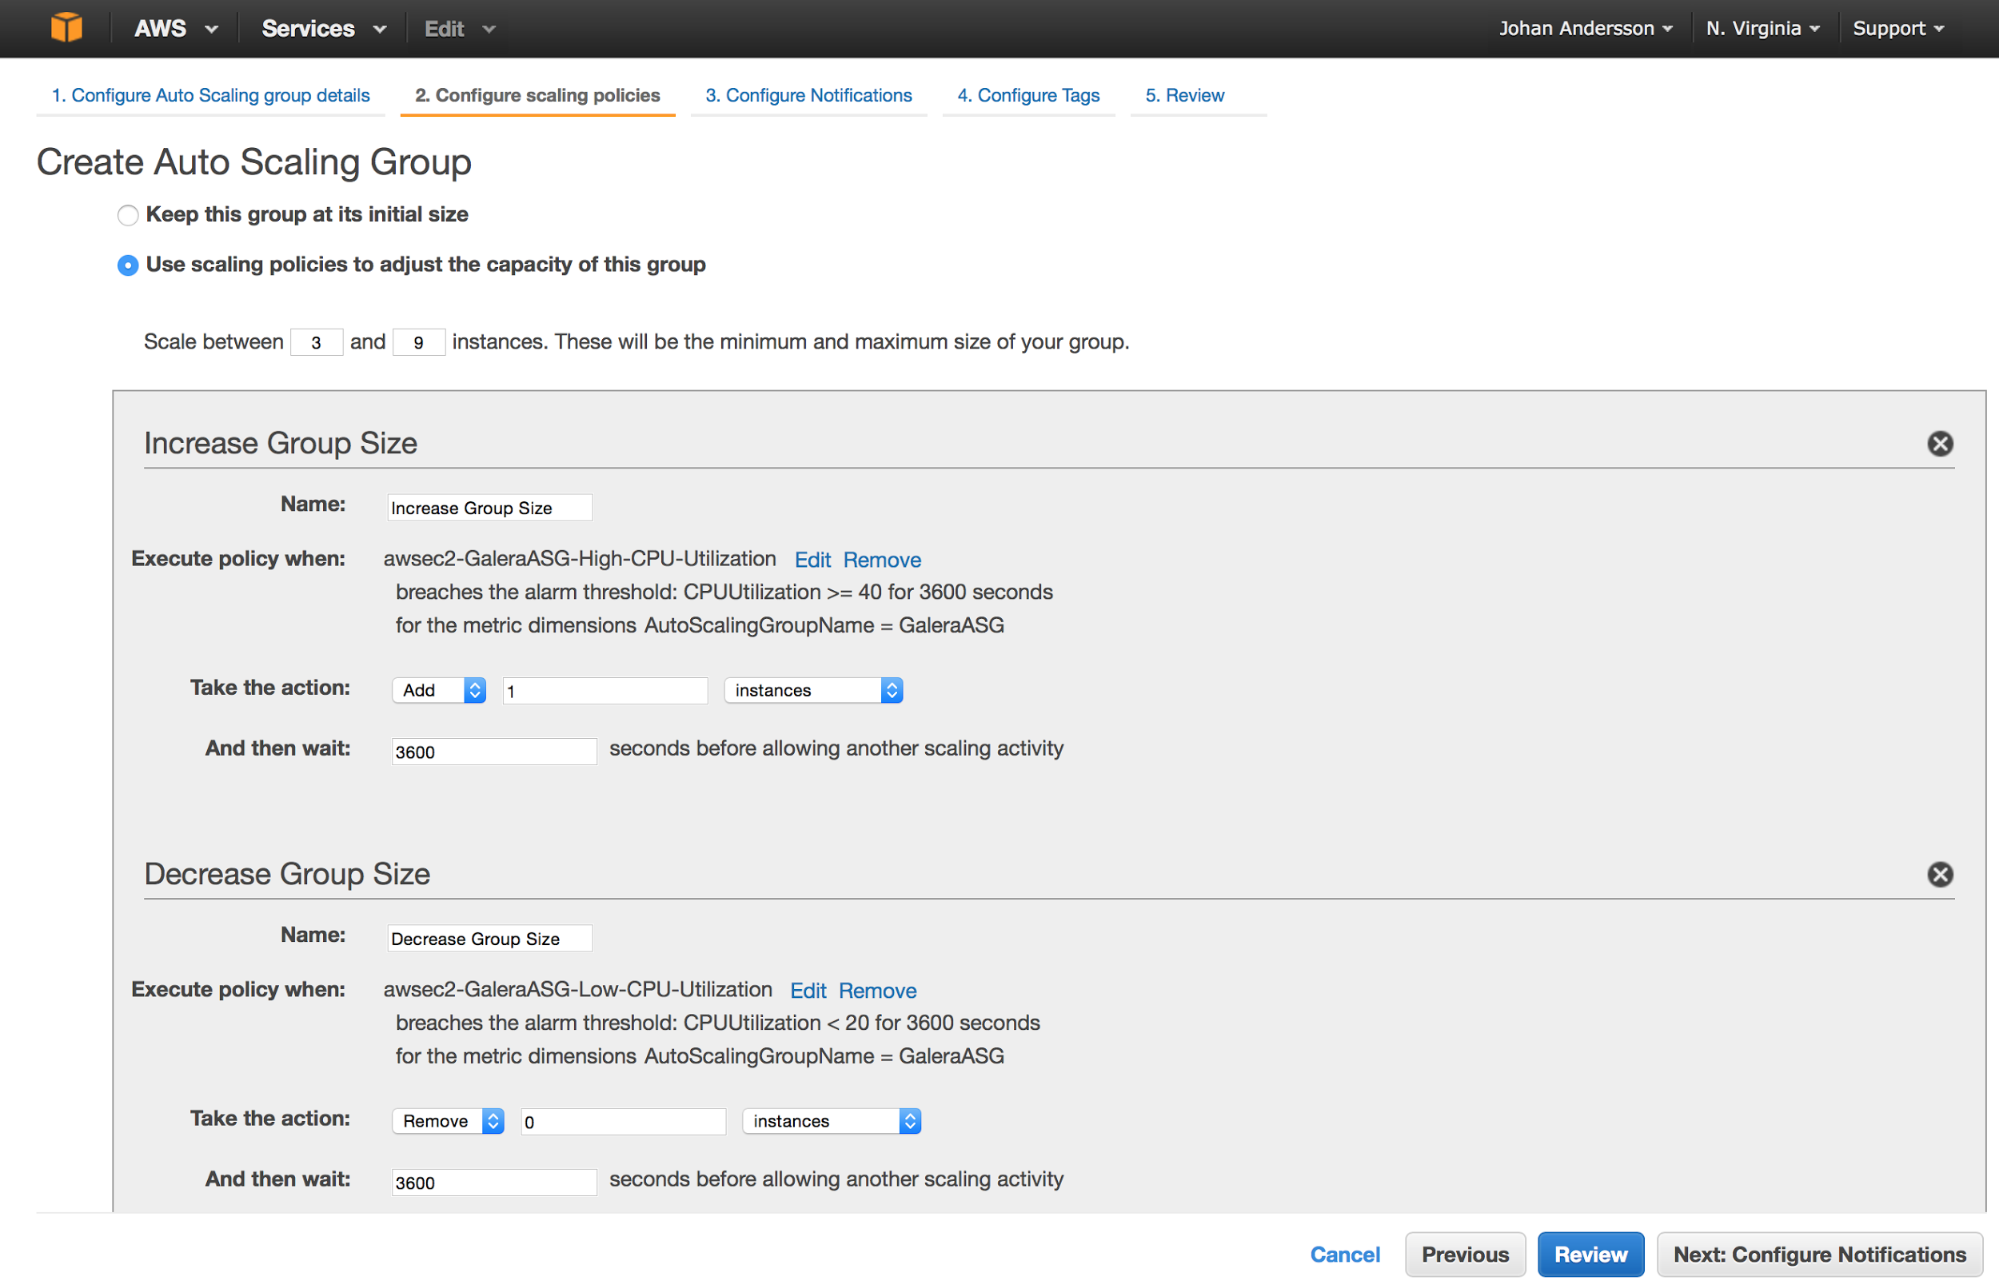
Auto scaling groups (ASG) is a set of mechanisms in EC2 that allows you to setup a dynamically scalable environment in several clicks. So AWS takes care of creating and destroying instances to maintain the required capacity. This can be useful if you get a surge in traffic, or for availability reasons in case you lose a few instances and want them replaced.

You would need to define the instance size to create, the AMI to create those new instances from and a set of conditions determining when new instances should be created. A simple example would be: ASG should have minimum 3, max 9 instances, split in three availability zones. A new instance should be added when CPU utilization is higher than 50% for a period of 2h, one of instances should be terminated when CPU utilization will be less than 20% for a period of 2h.

This tool is mostly designed for hosts which can be created and terminated quickly and easily, especially those that are stateless. Databases in general are more tricky, as they are stateful and a new instance is dependent on IO to sync up its data. Instances that use MySQL replication are not so easy to spin up but Galera is slightly more flexible, especially if we combine it with automated AMI creation to get the latest data included when the instance comes up.

One main problem to solve is that the Galera nodes need a wsrep_cluster_address setup with IP addresses of the nodes in the cluster. It uses this data to find other members of the cluster and to join the group communication. It is not required to have all of the cluster nodes listed in this variable, there has to be at least one correct IP.

We can approach this problem twofold. We can setup a semi-auto scaling environment - spin up a regular Galera cluster, let’s say three nodes. This will be a permanent part of our cluster. As a next step, we can create an AMI with wsrep_cluster_address including those three IP addresses and use it for the ASG. In this way, every new node created by the ASG will join the cluster using an IP of one of those permanent nodes. This approach has one significant advantage - by having permanent nodes, we can ensure to have a node with full gcache. You need to remember that the gcache is an in-memory buffer and is cleared after node restart.

Using Simple Notification Service as a callback to ASG

Another approach would be to fully automate our auto-scaling environment. For that we have to find a way of checking when ASG decided to create a new node, or terminate an old one, before updating wsrep_cluster_address. We can do this using SNS. 

First of all, a new “topic” (access point) needs to be created and a subscription needs to be added to this topic. The trick here is to use http protocol for a subscription.

This way, notifications related to a given topic will be sent as a POST request to the given http server. It’s great for our needs because we can create a handler (it can be either a daemon or xinetd service that calls some script) that will handle the POST messages, parse them and perform some actions as defined in our implemented logic.

Once we have a topic and subscription ready, when creating ASG, you can pick one of the SNS topics as a place where notifications will be sent.

The whole workflow looks as below:

  1. One of the conditions was met and ASG scale up/down event has been triggered
  2. New instance is added (or an old one is removed)
  3. Once that is done, notification will be sent to the defined SNS topic
  4. Handler script listening on the http address defined for the SNS subscription parses the POST request and does it’s magic.

The magic mentioned in the last point can be done in many ways, but the final result should be to get the IP addresses of the current set of Galera nodes and update wsrep_cluster_address accordingly. It may also require node restart for the joining node (to actually connect to the cluster using the new set of IP’s from wsrep_cluster_address). You may also need to setup Galera segments accordingly should you want to use them. Maybe a proxy configuration will have to be updated also?

All this can be done in multiple ways. One of them would be to use Ansible + ec2.py script as a dynamic inventory and use tags to mark new instances that need configuration (you can setup a set of tags for instances created by ASG), but it can be done using any tool as long as it works for you.

The main disadvantage of this fully automated approach is that you don’t really control when a given instance will be terminated, which one will be picked up for a termination etc. It should not be a problem in terms of the availability (your setup should be able to handle instances going down at random times anyway) but it may cause some additional scripting to handle the dynamic nature. It will also be more prone to SST (compared to a hybrid static/dynamic approach described earlier). That is, unless you add logic to check the wsrep_local_cached_downto and pick a donor based on the amount of data in the gache instead of relying on Galera itself to automatically choose the donor.

One important point to remember is that Galera takes time to get up and running - even IST may take some time. This needs to be taken under consideration when creating autoscaling policies. You want to allow some time for a Galera node to get up to speed and take traffic before proceeding with adding another node to the cluster. You also don’t want to be too aggressive in terms of the thresholds that determine when a new node should be launched - as the launch process is taking time, you’d probably want to wait a bit to confirm the scale-up is indeed required.

Blog category:


PlanetMySQL Voting: Vote UP / Vote DOWN
What’s the latest with Hadoop

$
0
0

The Big Data explosion in recent years has created a vast number of new technologies in the area of data processing, storage, and management. One of the biggest names to appear on the scene is Hadoop. In case you need a quick review, Hadoop is a Big Data storage system that takes in large amounts of data from servers and breaks it into smaller, manageable chunks. The technology is complex but at a high level the Hadoop ecosystem essentially takes a “divide and conquer” approach to processing Big Data instead of processing data in tables, as in a relational database like Oracle or MySQL.


hadoop1


One projection expects Hadoop to grow 25X to a global market value of $50.2 billion by the year 2020, driven by the continuous expansion of Big Data and related technologies. There are several reasons why Hadoop is going to continue to scale up in the next five years. Let’s take a look here at some of the major trends you and your organization should expect from this key Big Data technology through the remainder of 2015.


Hadoop will become the de facto data operating system


Hadoop is a notably complex ecosystem, and some have argued that it hasn’t caught on in the business world as rapidly as one might expect. But the market seems much more optimistic overall. As one source well states, “Distributed analytic frameworks, such as MapReduce, are evolving into distributed resource managers that are gradually turning Hadoop into a general-purpose data operating system . . . “ What this means on the ground is that more and more businesses are finding ways to adopt Hadoop as the “cornerstone” of their technology needs. Companies like Wal-Mart, Verizon Communications and Netflix use Hadoop to mine data to derive customer insights, and more on getting on the band-wagon.


hadoop2


SQL is making Hadoop more accessible


While Hadoop has emerged in the market as a viable solution for managing Big Data, the reality is that much of the business world is still very SQL-centric. More and more tools have emerged to make Hadoop data accessible through this familiar query language. SQL-on-Hadoop is now becoming a standard protocol and is expected to continue experiencing strong growth. The advantage of this is many-fold, most notably because it eliminates the need for businesses to hire data scientists and analysis to write complex queries in Python, Java, and JavaScript.


Hadoop is moving to the Cloud


The incessant consumer demand for bigger, better, and faster applications has created the need for big data analytics that can process at the speed of the market. Big data and cloud technologies are now integrally related. Public clouds providers such as Amazon Web Services, Google, and Microsoft, offer their own brands of big data systems in their clouds that are cost efficient and easily scalable for businesses of all sizes. Hadoop was originally designed for on-premises experimentation. The advantage of the cloud is that it solves the issue of idle time and allows businesses a very affordable way to spin up a huge cluster for big experiments.


Hadoop skills will become more mainstream


Hadoop has traditionally been a very specialized niche. But as the technology continues to scale and become “democratized” through SQL and cloud integrations mentioned above, Forrester predicts that organizations will be able to tap in-house web developers to write MapReduce jobs with Java or use SQL to query Hadoop-sized data sets.


hadoop3


Today’s data sizes will soon seem miniscule compared to what’s ahead in the next few years, especially considering the massive growth expected in the Internet of Things market. The biggest takeaway here is that Hadoop remains a viable and important asset for managing your Bid Data needs. Hadoop has proven resilient within the ebb and flow of the market and is fast becoming a commodity item for businesses to leverage. If you haven’t done so yet, now is the time to start figuring out your Hadoop/Big Data/Internet of Things strategy. Begin by exploring relevant use cases that will help your organization keep up with the tsunami of Big Data in the next 5 years. If you don’t, your competitors surely will.


PlanetMySQL Voting: Vote UP / Vote DOWN

MySQL Optimizer Tracer usage case with count(*)

$
0
0

What is Optimizer Trace?
After reading topic about Optimizer Tracer by Morgan Tocker decided to test it.
From Optimizer Trace and EXPLAIN FORMAT=JSON in 5.7:
Optimizer trace is a new diagnostic tool introduced in MySQL 5.6 to show how the optimizer is working internally. It is similar to EXPLAIN, with a few notable differences:

It doesn’t just show the intended execution plan, it shows the alternative choices.
You enable the optimizer trace, then you run the actual query.
It is far more verbose in its output.

For understanding goal of article please read previous one about related verified optimizer BUG:
Playing with count(*) optimizer work

We have 2 queries:
select count(*) from sales;
select count(*) from sales where sales_id > 0;

Firstly let’s get explain plan for query with JSON format and as regular:

-- JSON

mysql> explain format=json select count(*) from sales;
| {
  "query_block": {
    "select_id": 1,
    "table": {
      "table_name": "sales",
      "access_type": "index",
      "key": "sales_cust_idx",
      "used_key_parts": [
        "CUSTOMER_ID"
      ] /* used_key_parts */,
      "key_length": "4",
      "rows": 2489938,
      "filtered": 100,
      "using_index": true
    } /* table */
  } /* query_block */
} 

mysql> explain select count(*) from sales\G
*************************** 1. row ***************************
           id: 1
  select_type: SIMPLE
        table: sales
         type: index
possible_keys: NULL
          key: sales_cust_idx
      key_len: 4
          ref: NULL
         rows: 2489938
        Extra: Using index
1 row in set (0.00 sec)

Second query:


-- JSON

mysql> explain format=json select count(*) from sales where  sales_id > 0\G
*************************** 1. row ***************************
EXPLAIN: {
  "query_block": {
    "select_id": 1,
    "table": {
      "table_name": "sales",
      "access_type": "range",
      "possible_keys": [
        "PRIMARY"
      ],
      "key": "PRIMARY",
      "used_key_parts": [
        "SALES_ID"
      ],
      "key_length": "4",
      "rows": 1244969,
      "filtered": 100,
      "using_index": true,
      "attached_condition": "(`sales`.`sales`.`SALES_ID` > 0)"
    }
  }
}


mysql> explain select count(*) from sales where  sales_id > 0\G
*************************** 1. row ***************************
           id: 1
  select_type: SIMPLE
        table: sales
         type: range
possible_keys: PRIMARY
          key: PRIMARY
      key_len: 4
          ref: NULL
         rows: 1244969
        Extra: Using where; Using index
1 row in set (0.00 sec)

From Explain plan it is obvious that, first query will use “Index Scan”, second will use “Range Scan + Index”. First query will use, sales_cust_idx in customer_id column, second query will use primary key in sales_id column.

From first view, there now difference between queries, but optimizer estimates half of rows when attaching sales_id > 0 condition.
See related BUG: #68814

Now let’s examine problem with Optimizer Tracer.
So before running query you should enable optimizer trace:

SET OPTIMIZER_TRACE="enabled=on",END_MARKERS_IN_JSON=on;
SET OPTIMIZER_TRACE_MAX_MEM_SIZE=1000000;

After run first query:

mysql> select count(*) from sales;
+----------+
| count(*) |
+----------+
|  2500003 |
+----------+
1 row in set (0.58 sec)

Query to OPTIMIZER_TRACE table from information_schema:

mysql> select query, trace from INFORMATION_SCHEMA.OPTIMIZER_TRACE;


 select count(*) from sales | {
  "steps": [
    {
      "join_preparation": {
        "select#": 1,
        "steps": [
          {
            "expanded_query": "/* select#1 */ select count(0) AS `count(*)` from `sales`"
          }
        ] /* steps */
      } /* join_preparation */
    },
    {
      "join_optimization": {
        "select#": 1,
        "steps": [
          {
            "table_dependencies": [
              {
                "table": "`sales`",
                "row_may_be_null": false,
                "map_bit": 0,
                "depends_on_map_bits": [
                ] /* depends_on_map_bits */
              }
            ] /* table_dependencies */
          },
          {
            "rows_estimation": [
              {
                "table": "`sales`",
                "table_scan": {
                  "rows": 2489938,
                  "cost": 10347
                } /* table_scan */
              }
            ] /* rows_estimation */
          },
          {
            "considered_execution_plans": [
              {
                "plan_prefix": [
                ] /* plan_prefix */,
                "table": "`sales`",
                "best_access_path": {
                  "considered_access_paths": [
                    {
                      "access_type": "scan",
                      "rows": 2.49e6,
                      "cost": 508335,
                      "chosen": true
                    }
                  ] /* considered_access_paths */
                } /* best_access_path */,
                "cost_for_plan": 508335,
                "rows_for_plan": 2.49e6,
                "chosen": true
              }
            ] /* considered_execution_plans */
          },
          {
            "attaching_conditions_to_tables": {
              "original_condition": null,
              "attached_conditions_computation": [
              ] /* attached_conditions_computation */,
              "attached_conditions_summary": [
                {
                  "table": "`sales`",
                  "attached": null
                }
              ] /* attached_conditions_summary */
            } /* attaching_conditions_to_tables */
          },
          {
            "refine_plan": [
              {
                "table": "`sales`",
                "access_type": "index_scan"
              }
            ] /* refine_plan */
          }
        ] /* steps */
      } /* join_optimization */
    },
    {
      "join_execution": {
        "select#": 1,
        "steps": [
        ] /* steps */
      } /* join_execution */
    }
  ] /* steps */

Interesting part for query 1 is ->
“cost_for_plan”: 508335,
“rows_for_plan”: 2.49e6,
“chosen”: true

Cost is 508335, rows for plan is 2.49e6 = 2490000 rows, is roughly equal to explain plan estimation.

Now second query:

mysql> select count(*) from sales where sales_id > 0;
+----------+
| count(*) |
+----------+
|  2500003 |
+----------+
1 row in set (1.18 sec)

Query to OPTIMIZER_TRACE:

mysql> select query, trace from INFORMATION_SCHEMA.OPTIMIZER_TRACE;

select count(*) from sales where sales_id > 0 | {
  "steps": [
    {
      "join_preparation": {
        "select#": 1,
        "steps": [
          {
            "expanded_query": "/* select#1 */ select count(0) AS `count(*)` from `sales` where (`sales`.`SALES_ID` > 0)"
          }
        ] /* steps */
      } /* join_preparation */
    },
    {
      "join_optimization": {
        "select#": 1,
        "steps": [
          {
            "condition_processing": {
              "condition": "WHERE",
              "original_condition": "(`sales`.`SALES_ID` > 0)",
              "steps": [
                {
                  "transformation": "equality_propagation",
                  "resulting_condition": "(`sales`.`SALES_ID` > 0)"
                },
                {
                  "transformation": "constant_propagation",
                  "resulting_condition": "(`sales`.`SALES_ID` > 0)"
                },
                {
                  "transformation": "trivial_condition_removal",
                  "resulting_condition": "(`sales`.`SALES_ID` > 0)"
                }
              ] /* steps */
            } /* condition_processing */
          },
          {
            "table_dependencies": [
              {
                "table": "`sales`",
                "row_may_be_null": false,
                "map_bit": 0,
                "depends_on_map_bits": [
                ] /* depends_on_map_bits */
              }
            ] /* table_dependencies */
          },
          {
            "ref_optimizer_key_uses": [
            ] /* ref_optimizer_key_uses */
          },
          {
            "rows_estimation": [
              {
                "table": "`sales`",
                "range_analysis": {
                  "table_scan": {
                    "rows": 2489938,
                    "cost": 508337
                  } /* table_scan */,
                  "potential_range_indices": [
                    {
                      "index": "PRIMARY",
                      "usable": true,
                      "key_parts": [
                        "SALES_ID"
                      ] /* key_parts */
                    },
                    {
                      "index": "sales_cust_idx",
                      "usable": false,
                      "cause": "not_applicable"
                    }
                  ] /* potential_range_indices */,
                  "best_covering_index_scan": {
                    "index": "sales_cust_idx",
                    "cost": 500418,
                    "chosen": true
                  } /* best_covering_index_scan */,
                  "setup_range_conditions": [
                  ] /* setup_range_conditions */,
                  "group_index_range": {
                    "chosen": false,
                    "cause": "not_group_by_or_distinct"
                  } /* group_index_range */,
                  "analyzing_range_alternatives": {
                    "range_scan_alternatives": [
                      {
                        "index": "PRIMARY",
                        "ranges": [
                          "0 < SALES_ID"
                        ] /* ranges */,
                        "index_dives_for_eq_ranges": true,
                        "rowid_ordered": true,
                        "using_mrr": false,
                        "index_only": true,
                        "rows": 1244969,
                        "cost": 251364,
                        "chosen": true
                      }
                    ] /* range_scan_alternatives */,
                    "analyzing_roworder_intersect": {
                      "usable": false,
                      "cause": "too_few_roworder_scans"
                    } /* analyzing_roworder_intersect */
                  } /* analyzing_range_alternatives */,
                  "chosen_range_access_summary": {
                    "range_access_plan": {
                      "type": "range_scan",
                      "index": "PRIMARY",
                      "rows": 1244969,
                      "ranges": [
                        "0 < SALES_ID"
                      ] /* ranges */
                    } /* range_access_plan */,
                    "rows_for_plan": 1244969,
                    "cost_for_plan": 251364,
                    "chosen": true
                  } /* chosen_range_access_summary */
                } /* range_analysis */
              }
            ] /* rows_estimation */
          },
          {
            "considered_execution_plans": [
              {
                "plan_prefix": [
                ] /* plan_prefix */,
                "table": "`sales`",
                "best_access_path": {
                  "considered_access_paths": [
                    {
                      "access_type": "range",
                      "rows": 1.24e6,
                      "cost": 500357,
                      "chosen": true
                    }
                  ] /* considered_access_paths */
                } /* best_access_path */,
                "cost_for_plan": 500357,
                "rows_for_plan": 1.24e6,
                "chosen": true
              }
            ] /* considered_execution_plans */
          },
          {
            "attaching_conditions_to_tables": {
              "original_condition": "(`sales`.`SALES_ID` > 0)",
              "attached_conditions_computation": [
              ] /* attached_conditions_computation */,
              "attached_conditions_summary": [
                {
                  "table": "`sales`",
                  "attached": "(`sales`.`SALES_ID` > 0)"
                }
              ] /* attached_conditions_summary */
            } /* attaching_conditions_to_tables */
          },
          {
            "refine_plan": [
              {
                "table": "`sales`",
                "access_type": "range"
              }
            ] /* refine_plan */
          }
        ] /* steps */
      } /* join_optimization */
    },
    {
      "join_execution": {
        "select#": 1,
        "steps": [
        ] /* steps */
      } /* join_execution */
    }
  ] /* steps */

It is much more complicated with second query and due to lacking documentation for all output, i am looking for explanations from experts.

First thing is, it says in “potential_range_indices” that “index”: “sales_cust_index” is not usable:

"potential_range_indices": [
                    {
                      "index": "PRIMARY",
                      "usable": true,
                      "key_parts": [
                        "SALES_ID"
                      ] /* key_parts */
                    },
                    {
                      "index": "sales_cust_idx",
                      "usable": false,
                      "cause": "not_applicable"
                    }
                  ]

But in “best_covering_index_scan”, “index”: “sales_cust_idx” is marked as “chosen”:true

"best_covering_index_scan": {
                    "index": "sales_cust_idx",
                    "cost": 500418,
                    "chosen": true
                  } 

Second thing is, in “range_scan_alternatives” and,

"analyzing_range_alternatives": {
                    "range_scan_alternatives": [
                      {
                        "index": "PRIMARY",
                        "ranges": [
                          "0 < SALES_ID"
                        ] /* ranges */,
                        "index_dives_for_eq_ranges": true,
                        "rowid_ordered": true,
                        "using_mrr": false,
                        "index_only": true,
                        "rows": 1244969,
                        "cost": 251364,
                        "chosen": true
                      } 

in “chosen_range_access_summary”, “rows_for_plan” is 1244969 and “cost_for_plan” is 251364

"chosen_range_access_summary": {
                    "range_access_plan": {
                      "type": "range_scan",
                      "index": "PRIMARY",
                      "rows": 1244969,
                      "ranges": [
                        "0 < SALES_ID"
                      ] /* ranges */
                    } /* range_access_plan */,
                    "rows_for_plan": 1244969,
                    "cost_for_plan": 251364,
                    "chosen": true
                  } 

But for final “best_access_path” “cost_for_plan” is increased to 500357 and “rows_for_plan” is 1.24e6 = 1240000:

"best_access_path": {
                  "considered_access_paths": [
                    {
                      "access_type": "range",
                      "rows": 1.24e6,
                      "cost": 500357,
                      "chosen": true
                    }
                  ] /* considered_access_paths */
                } /* best_access_path */,
                "cost_for_plan": 500357,
                "rows_for_plan": 1.24e6,
                "chosen": true
              }

Third thing is that, sales_id > 0 is rewritten to 0 < sales_id

 
"ranges": [
                        "0 < SALES_ID"
                      ] 

* After explanations from community this article will be updated*

The post MySQL Optimizer Tracer usage case with count(*) appeared first on Azerbaijan MySQL UG.


PlanetMySQL Voting: Vote UP / Vote DOWN

How We Ensure VividCortex Never Loses Data

$
0
0

Adrian Cockcroft really nailed it when he said that a monitoring system has to be more reliable than what it’s monitoring. I don’t mind admitting that in our first year or so, we had some troubles with losing telemetry data. Customers were never sure whether their systems were offline, the agents were down, or we were not collecting the data. Even a few seconds of missing data is glaringly obvious when you have 1-second resolution data. There’s nowhere to hide.

It was embarrassing and we made it a top priority to fix. And fix it we did. This isn’t news, but we never wrote about it, so it’s time. Hopefully this is helpful to someone else building systems like ours, where the workload is hard in unusual ways, and all sorts of interesting things break in ways you wouldn’t expect. Here’s how we built a system that’s highly resilient at scale, and doesn’t lose data.

Agent In-Memory Spooling

The first set of changes we made were to our agents. We added a small, very short-lived round-robin in-memory buffer and coded the agents to handle specific API responses and network problems. If there’s a temporary failure, the chunk of data goes into the buffer and gets retried. This works well for transient “hiccups” but is a dangerous thing to do in general.

This is actually the most obvious of the changes, which explains why we did it first! It also explains why we got so many requests from customers for this kind of thing. Every time a customer’s firewall would break our outbound connections, we’d troubleshoot it and the customer would say “can you make the agents spool to disk?” It’s a good suggestion but it’s also a foot-gun. We put a lot of effort into making sure our agents don’t cause troubles on customer systems. Spooling anything to disk is much more dangerous in my experience than the “safe” things we do that have occasionally caused edge-case problems.

In a diverse customer base, the most banal of things will blow up badly… but after a few months we had things working really well. However, we still had fundamental challenges in our backend systems that were causing troubles regardless of how resilient the agents were.

API Changes

Our APIs were initially a monolith. There are a lot of problems with monolithic APIs, and that’s worth a blog post someday. For purposes of never losing data, breaking into smaller, tightly purposed APIs is really important. This way they can all be operated separately.

Still more important is separating read and write paths. Reads can tend to be long-running and potentially use a lot of resources, which are difficult to constrain in specific scenarios. Writes need to just put the data somewhere durable ASAP and finish so they’re not tying up resources. These two conflict; reads can block the resources the writes need, causing e.g. waiting for a database connection, or worse still, dying un-serviced while we reboot the API to fix a resource-hogging read. You can read more about the challenges and solutions at our blog post about seeing in-flight requests and blockers in real-time.

After separating our monolith into smaller services, separating reads and writes, and including our opensource libraries for managing in-flight requests, we had a much more resilient system. But there was still one major problem.

Decoupling From The Database

Our APIs were still writing directly to the database, meaning that any database downtime or other problems were guaranteed to cause us to lose incoming data as soon as the agent’s round-robin buffer filled up. We had a short window for downtime-causing changes, but no more.

The “obvious” solution to this is a queueing system, like RabbitMQ or similar. However, after seeing those in action at a lot of customers while I was a consultant, I didn’t like them very much. It’s not that they don’t work well. They usually do, although indeed they do fail in very difficult ways when things go wrong. What bothers me about them is that they are neither here-nor-there architecturally and instead of simplifying the architecture, they make it more complex in a lot of cases.

What I wanted, I thought, was not a queue but a message bus. The queue is okay inasmuch as it decouples the direct dependency between components in the architecture, but a message bus implies ordering and organizing principles that I didn’t see expressed in message queues. I wanted a “river of data” flowing one direction, from which everyone could drink.

And then we found Kafka and realized we didn’t want a bus or river, we wanted a log. I’ll leave you to read more on the log as a unifying abstraction if you haven’t yet. I intuitively knew that Kafka was the solution we were looking for. In previous jobs I’d built similar things using flat files in a filesystem (which is actually an incredibly simple, reliable, high performance way to do things). We discussed amongst ourselves and all came to the same conclusion.

Kafka actually took us a while to get into production; more than six months, I think. There were sharp edges and problems with client libraries in Go and so on. Those were solved and we got it up and running. We had one instance where we bled pretty heavily on a gotcha in partition management and node replacement. Maybe a couple other minor things I’m forgetting. Other than that, Kafka has been exactly what it sounds like.

Kafka is a huge part of why we don’t lose data anymore. Our APIs do the minimal processing and then write the data into Kafka. Several very important problems are solved, easily and elegantly: HA, decoupling, architectural straightforwardness.

More Agent Changes

But we weren’t done yet. While talking with Adrian Cockcroft (one of our advisors, who works with us on a weekly basis) we brought up another customer networking issue where some data didn’t get sent from the agents and expired from the buffer. Although this issue had been a customer problem, we knew there were still mistakes we could make that would cause problems too:

  • We could forget to renew our SSL key.
  • We could forget to pay our DNS provider.
  • We could accidentally terminate our EC2 instances that load-balance and proxy.

There are still single points of failure and there always will be. What if we set up a backup instance of our APIs, we wondered? With completely separate resources end-to-end? Separate DNS names and providers, separate hosting, separate credit cards for billing, and so on? Agents could send data to these as a backup if the main instance were down.

I know, you’re probably thinking “just go through the main instances and make them have no SPOFs!” but we were doing a what-if thought experiment, “what if we do a separate one instead, will we get 99% of the benefit at a tiny fraction of the cost and effort of really hardening our main systems?” You see, each incremental 9 of availability is exponential in cost and effort.

It was just a thought, and it led somewhere great: instead of duplicating our entire infrastructure, rely on one of the most robust systems on the Internet. If you guessed Amazon S3, you’re right.

It was Adrian’s suggestion: if the APIs are down or unreachable for some reason, and we’re about to expire data from the ring buffer, instead pack the data up, encrypt it, and write it to a write-only S3 bucket. Monitor S3 for data being written to it (which should “never happen” of course) and pull that data out, verify everything about it, and push it into Kafka.

The beauty of this system is that it has very few moving parts. We wouldn’t want to use it as our primary channel for getting data into our backend, but it’s great for a fallback. We’ve architected it to layer anonymity and high security on top of S3’s already high security, and of course it’s configurable so we can disable it if customers dislike it.

As a bonus, we found one set of agents were sending data to S3 that shouldn’t have been, and found a bug in our round-robin buffer! This is always the worry about infrequently-used “emergency flare” code–it’s much more likely to have bugs than code that runs constantly.

Conclusions

Your mileage may vary, but in our case we’ve achieved the level of resilience and high availability we need, for a large and fast-moving inbound stream, with commodity/simple components, by doing the following:

  • Make agents spool locally, and send to S3 as a last-ditch effort
  • Decompose APIs into smallish “macroservices” bundles
  • Run critical read and write paths through entirely separate channels
  • Decouple writes from the databases with Kafka

I’d love to hear your feedback in the comments!


PlanetMySQL Voting: Vote UP / Vote DOWN

Log Buffer #424: A Carnival of the Vanities for DBAs

$
0
0

This Log Buffer Edition covers various valuable blog posts from the fields of Oracle, SQL Server and MySQL.

Oracle:

  • Oracle Big Data Appliance X5-2 with Big Data SQL for the DBA.
  • Loading, Updating and Deleting From HBase Tables using HiveQL and Python.
  • In keeping with the ODA quarterly patching strategy, Appliance Manager 12.1.2.3 is now available.
  • From time to time someone publishes a query on the OTN database forum and asks how to make it go faster, and you look at it and think, “it’s a nice example to explain a couple of principles because it’s short, easy to understand, obvious what sort of things might be wrong, and easy to fix.”
  • Optimizing the PL/SQL Challenge IV: More OR Condition Woes.

SQL Server:

  • Will RDBMs be obsolete? Should Data Professionals care about Big Data technologies? What is NoSQL? What is Hadoop?
  • In a development team, there are times when the relationships between developers and testers can become strained. How can you turn this potential conflict into something more positive?
  • Michael Fal is a huge advocate of automation and many ways it can improve the lives of developers and DBAs alike, but you can’t just automate all your problems away.
  • One way to handle a very complex database project with several databases and cross references.
  • Building the Ideal VMware-based SQL Server Virtual Machine.

MySQL:

  • Optimizing Out-of-order Parallel Replication with MariaDB 10.0.
  • General-purpose MySQL applications should read MySQL option files like /etc/my.cnf, ~/.my.cnf, … and ~/.mylogin.cnf. But ~/.mylogin.cnf is encrypted.
  • Creating and Restoring Database Backups With mysqldump and MySQL Enterprise Backup.
  • If you don’t know much about bash shell, you should start with the prior post to learn about bash arrays.
  • Installing Kubernetes Cluster with 3 minions on CentOS 7 to manage pods and services.

Learn more about Pythian’s expertise in Oracle , SQL Server and MySQL.


PlanetMySQL Voting: Vote UP / Vote DOWN

Making Existing SQLPLUS Scripts 12c and Container DB (PDB) Compatible

$
0
0

Oracle 12c introduces new catalog features including CDB_ dictionary views (which include a CON_ID column) superseding the DBA_ views that most DBA sqlplus scripts are based upon.

However, existing DBA sqlplus scripts can easily be modified using just a few simple sqlplus techniques to be compatible with 11g, as well as all types of 12c databases including legacy and container databases.

The following simple SQL and sqlplus techniques can be used to make a “universal script” that is compatible with all versions.

Illustrating the Issue

Let’s say for sake of example that we have a simple 10g/11g monitoring script that’s checking the amount of freespace in each tablespace by querying the DBA_TABLESPACE_USAGE_METRICS view.

On our 10g or 11g database the following query gives the necessary information:

SQL> select version from v$instance;

VERSION
-----------------
11.2.0.4.0

SQL> select tablespace_name, tablespace_size, used_percent
  2  from DBA_TABLESPACE_USAGE_METRICS
  3  order by tablespace_name;

TABLESPACE_NAME                TABLESPACE_SIZE USED_PERCENT
------------------------------ --------------- ------------
FCCDEV                                  256000      .053125
SYSAUX                                 1024000   31.0617188
SYSTEM                                 1024000   9.19453125
TEMP                                   1024000            0
UNDOTBS1                               1024000      .015625
USERS                                   256000        1.275

6 rows selected.

SQL>


Now will the same query work on a 12c database? Of course it will:

SQL> select version from v$instance;

VERSION
-----------------
12.1.0.2.0

SQL> select tablespace_name, tablespace_size, used_percent
  2  from DBA_TABLESPACE_USAGE_METRICS
  3  order by tablespace_name;

TABLESPACE_NAME                TABLESPACE_SIZE USED_PERCENT
------------------------------ --------------- ------------
SYSAUX                                 4194302   .773048769
SYSTEM                                 4194302   1.05991414
TEMP                                   4194302            0
UNDOTBS1                               4194302   .031280532
USERS                                  4194302   .003051759

SQL>


It executes successfully on the 12c database but there’s a problem: the query is only returning the data from the root container (or more accurately, from the container in which the statement was executed). The PDB data is missing, I have both open and closed PDBs in this database:

SQL> select con_id, name, open_mode from V$CONTAINERS order by con_id;

    CON_ID NAME                           OPEN_MODE
---------- ------------------------------ ----------
         1 CDB$ROOT                       READ WRITE
         2 PDB$SEED                       READ ONLY
         3 TEST1                          READ WRITE
         4 LDB3                           MOUNTED

SQL>


The LDB3 PDB is closed (mounted) so I’m not interested in monitoring the tablespace freespace in it but I am interested in the details from the opened TEST1 PDB.

To get the required information we need to make two or three (Third being optional) changes:

1) Change the view from DBA_ to CDB_
2) Add the CON_ID column to the output
3) Add the CON_ID column to the ORDER BY clause

Hence (executing from CDB$ROOT) the query becomes:

SQL> select con_id, tablespace_name, tablespace_size, used_percent
  2  from CDB_TABLESPACE_USAGE_METRICS
  3  order by con_id, tablespace_name;

    CON_ID TABLESPACE_NAME                TABLESPACE_SIZE USED_PERCENT
---------- ------------------------------ --------------- ------------
         1 SYSAUX                                 4194302   .773048769
         1 SYSTEM                                 4194302   1.05991414
         1 TEMP                                   4194302            0
         1 UNDOTBS1                               4194302   .031280532
         1 USERS                                  4194302   .003051759
         3 AUDIT_DATA                               64000        .2875
         3 SYSAUX                                 4194302   .410843091
         3 SYSTEM                                 4194302   .474167096
         3 TPCCTAB                                1024000   5.63203125

9 rows selected.

SQL>


So that works fine, but as it stands we have two versions of the query and therefore we need two monitoring scripts.


Building Blocks for the Universal Script

Applying a number of simple sqlplus techniques can help us with this and will allow us to make the single universal version of the sqlplus script.

1) Use a SQLPLUS variable:

The sqlplus DEFINE command allows us to define variables. We can easily define a variable that tells us which view prefix to use depending on whether the database version is 11g or 12c.

SQL> COLUMN view_prefix NEW_VALUE view_prefix
SQL> SELECT DECODE(SUBSTR(version,1,INSTR(version,'.')-1),'12','CDB','DBA') view_prefix FROM v$instance;

VIE
---
CDB

SQL>


2) Dynamically build the view name:

The second tip is that in sqlplus to concatenate a variable with a string a period must be used to show where the variable name ends:

SQL> prompt &view_prefix
CDB

SQL> prompt &view_prefix._TABLESPACE_USAGE_METRICS
CDB_TABLESPACE_USAGE_METRICS

SQL>


Plugging that into the original query gives:

SQL> select tablespace_name, tablespace_size, used_percent
  2  from &view_prefix._TABLESPACE_USAGE_METRICS
  3  order by tablespace_name;
old   2: from &view_prefix._TABLESPACE_USAGE_METRICS
new   2: from CDB_TABLESPACE_USAGE_METRICS

TABLESPACE_NAME                TABLESPACE_SIZE USED_PERCENT
------------------------------ --------------- ------------
AUDIT_DATA                               64000        .2875
SYSAUX                                 4194302   .410843091
SYSAUX                                 4194302   .773048769
SYSTEM                                 4194302   1.05991414
SYSTEM                                 4194302   .474167096
TEMP                                   4194302            0
TPCCTAB                                1024000   5.63203125
UNDOTBS1                               4194302   .031280532
USERS                                  4194302   .003051759

9 rows selected.

SQL>

But we’re missing the container ID column.


3) Add columns dynamically using additional sqlplus variables:

We can “optionally” include columns such as the CON_ID column using the same technique:

SQL> COLUMN view_prefix NEW_VALUE view_prefix NOPRINT
SQL> SELECT DECODE(SUBSTR(version,1,INSTR(version,'.')-1),'12','CDB','DBA') view_prefix FROM v$instance;

SQL> COLUMN con_id_col NEW_VALUE con_id_col NOPRINT
SQL> SELECT DECODE(SUBSTR(version,1,INSTR(version,'.')-1),'12','con_id,','') con_id_col FROM v$instance;

SQL> select &con_id_col tablespace_name, tablespace_size, used_percent
  2  from &view_prefix._TABLESPACE_USAGE_METRICS
  3  order by &con_id_col tablespace_name;
old   1: select &con_id_col tablespace_name, tablespace_size, used_percent
new   1: select con_id, tablespace_name, tablespace_size, used_percent
old   2: from &view_prefix._TABLESPACE_USAGE_METRICS
new   2: from CDB_TABLESPACE_USAGE_METRICS
old   3: order by &con_id_col tablespace_name
new   3: order by con_id, tablespace_name

    CON_ID TABLESPACE_NAME                TABLESPACE_SIZE USED_PERCENT
---------- ------------------------------ --------------- ------------
         1 SYSAUX                                 4194302   .773239504
         1 SYSTEM                                 4194302   1.05991414
         1 TEMP                                   4194302            0
         1 UNDOTBS1                               4194302   .003814699
         1 USERS                                  4194302   .003051759
         3 AUDIT_DATA                               64000        .2875
         3 SYSAUX                                 4194302   .410843091
         3 SYSTEM                                 4194302   .474167096
         3 TPCCTAB                                1024000   5.63203125

9 rows selected.

SQL>


Note that the comma is in the variable and not in the column list in the SQL SELECT or ORDER BY clauses.

The script is now dynamically determining whether to use the CDB_ or DBA_ view and similarly dynamically adding the CON_ID column to the SELECT and ORDER BY clauses. (And of course should be executed from the root container.)

And the exact same script still works on the 11g database using the 11g version of sqlplus!

Similarly the optional column (including the comma) defined in the sqlplus variable could be used in an aggregation GROUP BY clause. However, if the query has no other aggregation columns then we might need to add a constant to the GROUP BY clause (and ORDER BY), otherwise the GROUP BY would have no columns listed and the universal sqlplus script is executed against an 11g database.

For example:

SQL> COLUMN view_prefix NEW_VALUE view_prefix NOPRINT
SQL> SELECT DECODE(SUBSTR(version,1,INSTR(version,'.')-1),'12','CDB','DBA') view_prefix FROM v$instance;

SQL> COLUMN con_id_col NEW_VALUE con_id_col NOPRINT
SQL> SELECT DECODE(SUBSTR(version,1,INSTR(version,'.')-1),'12','con_id,','') con_id_col FROM v$instance;

SQL> select &con_id_col min(extended_timestamp), max(extended_timestamp)
  2  from &view_prefix._AUDIT_TRAIL
  3  group by &con_id_col 1 order by &con_id_col 1;
old   1: select &con_id_col min(extended_timestamp), max(extended_timestamp)
new   1: select con_id, min(extended_timestamp), max(extended_timestamp)
old   2: from &view_prefix._AUDIT_TRAIL
new   2: from CDB_AUDIT_TRAIL
old   3: group by &con_id_col 1 order by &con_id_col 1
new   3: group by con_id, 1 order by con_id, 1

    CON_ID MIN(EXTENDED_TIMESTAMP)                  MAX(EXTENDED_TIMESTAMP)
---------- ---------------------------------------- ----------------------------------------
         3 13-MAY-15 11.54.52.106301 AM -06:00      13-MAY-15 12.16.18.941308 PM -06:00

SQL>


Finally, once we’re done testing and debugging, we can get rid of the ugly “old” and “new” statements using:

SET VERIFY OFF

Implementing these techniques will allow modifications of most existing DBA sqlplus scripts to create universal versions, of which will be compatible with 11g (and likely earlier) databases as well as 12c legacy and container databases.


Deeper Dive

What if our monitoring query is based on an underlying catalog table and not a dictionary view?

For example, let’s say that our objective is to report on users and the last time the database password was changed. The password change date isn’t presented in the DBA_USERS or CDB_USERS view, but it is in the underlying SYS.USER$ table. Hence the monitoring query might be something like:

SQL> select name, ptime from SYS.USER$
  2  where type#=1 order by name;

NAME                     PTIME
------------------------ ---------
ANONYMOUS                23-APR-15
...
SYSTEM                   23-APR-15
XDB                      23-APR-15
XS$NULL                  23-APR-15


If we look at the view definition of any of the CDB_ views it is apparent that the view traverses the open PDBs by using the new 12c “CONTAINERS” function which accepts a table name as the only argument.

When run from the root container the CONTAINERS() function will traverse all open PDBs (assuming the common user used has local PDB permission to access the referenced table).

NOTE: Prior to 12.1.0.2 the CONTAINERS function was called CDB$VIEW.

Thus, we can use the new function as follows:

SQL> select con_id, name, ptime from CONTAINERS(SYS.USER$)
  2  where type#=1 order by con_id, name;

    CON_ID NAME                     PTIME
---------- ------------------------ ---------
         1 ANONYMOUS                23-APR-15
...
         1 SYSTEM                   23-APR-15
         1 XDB                      23-APR-15
         1 XS$NULL                  23-APR-15
         3 ANONYMOUS                23-APR-15
...
         3 SYSTEM                   23-APR-15
         3 XDB                      23-APR-15
         3 XS$NULL                  23-APR-15


Or to make the script universal so the single script can be run on both 11g and 12c:

SQL> COLUMN view_prefix NEW_VALUE view_prefix NOPRINT
SQL> SELECT DECODE(SUBSTR(version,1,INSTR(version,'.')-1),'12','CONTAINERS(SYS.USER$)','SYS.USER$') view_prefix FROM v$instance;

SQL> COLUMN con_id_col NEW_VALUE con_id_col NOPRINT
SQL> SELECT DECODE(SUBSTR(version,1,INSTR(version,'.')-1),'12','con_id,','') con_id_col FROM v$instance;

SQL> select &con_id_col name, ptime from &view_prefix.
  2  where type#=1 order by &con_id_col name;
old   1: select &con_id_col name, ptime from &view_prefix.
new   1: select con_id, name, ptime from CONTAINERS(SYS.USER$)
old   2: where type#=1 order by &con_id_col name
new   2: where type#=1 order by con_id, name

    CON_ID NAME                     PTIME
---------- ------------------------ ---------
         1 ANONYMOUS                23-APR-15
...
         1 XDB                      23-APR-15
         1 XS$NULL                  23-APR-15
         3 ANONYMOUS                23-APR-15
...
         3 XDB                      23-APR-15
         3 XS$NULL                  23-APR-15

SQL>


A final question might be: why isn’t the PDB$SEED database shown in the results?

The answer is that a new 12c initialization parameter EXCLUDE_SEED_CDB_VIEW controls whether the seed database is displayed in CDB_ view (or CONTAINERS() function calls). EXCLUDE_SEED_CDB_VIEW is dynamic and session modifiable:

SQL> show parameter EXCLUDE_SEED_CDB_VIEW

NAME                                 TYPE        VALUE
------------------------------------ ----------- ------------------------------
exclude_seed_cdb_view                boolean     TRUE

SQL> select con_id, count(1) from cdb_users group by con_id;

    CON_ID   COUNT(1)
---------- ----------
         1         18
         3         20

SQL> alter session set EXCLUDE_SEED_CDB_VIEW=FALSE;

Session altered.

SQL> select con_id, count(1) from cdb_users group by con_id;

    CON_ID   COUNT(1)
---------- ----------
         1         18
         2         17
         3         20

SQL>


Other tools

A final question is whether this technique will still work if the SQL script is run through other tools? The answer is: “it depends“.

It depends on whether the other tools support the “define” command and the use of script variables. Specifically, Oracle SQL Developer and the newer sqlcl tool does. The above examples work fine in SQL Developer and sqlcl using the standard sqlcl “default” sqlformat. Other sqlformat options in sqlcl show some issues (testing with sqlcl version 4.2.0.15.121.1046).


Learn more about Pythian’s expertise in Oracle and MySQL.


PlanetMySQL Voting: Vote UP / Vote DOWN

MySQL Query Profiling with Performance Schema

$
0
0

One of my favorite tools for query optimization is profiling. But recently I noticed this warning:

mysql> set profiling=1;
Query OK, 0 rows affected, 1 warning (0.00 sec)

mysql> show warnings;
+---------+------+----------------------------------------------------------------------+
| Level   | Code | Message                                                              |
+---------+------+----------------------------------------------------------------------+
| Warning | 1287 | '@@profiling' is deprecated and will be removed in a future release. |
+---------+------+----------------------------------------------------------------------+

After looking through certain documentation , I should indeed start using the Performance Schema to get this information.

Okay, so let’s give that a try.

I confirmed that I started MySQL 5.6.23 with the default of Performance Schema = ON:

mysql> show global variables like '%perf%';
+--------------------------------------------------------+-------+
| Variable_name                                          | Value |
+--------------------------------------------------------+-------+
| performance_schema                                     | ON    |
...

I’ll be using a development server for doing query profiling, so I can turn all of these on:

mysql> update performance_schema.setup_instruments set enabled='YES', timed='YES'; #you want the stage* ones enabled
mysql> update performance_schema.setup_consumers set enabled='YES'; #you want the events_statements_history* and events_stages_history* enabled

Start with fresh collection tables:

mysql> truncate performance_schema.events_stages_history_long;
mysql> truncate performance_schema.events_statements_history_long;

Then turn the profiler on:

mysql> set profiling=1;

Now run a sample query:

mysql> select distinct(msa) from zip.codes;

And find the resulting event IDs to use in the query below:

mysql> select event_id, end_event_id, sql_text from performance_schema.events_statements_history_long where sql_text like '%msa%';
...
|      41 |       938507 | select distinct(msa) from zip.codes                                                                  |
...

Insert those beginning and ending event IDs, and here’s the new profiling output on my test query from Performance Schema:

mysql> select substring_index(event_name,'/',-1) as Status, truncate((timer_end-timer_start)/1000000000000,6) as Duration from performance_schema.events_stages_history_long where event_id>=41 and event_id<=938507;

+----------------------+----------+
| Status               | Duration |
+----------------------+----------+
| init                 | 0.000103 |
| checking permissions | 0.000006 |
| Opening tables       | 0.000051 |
| init                 | 0.000014 |
| System lock          | 0.000007 |
| optimizing           | 0.000003 |
| statistics           | 0.000011 |
| preparing            | 0.000011 |
| Creating tmp table   | 0.000048 |
| executing            | 0.000002 |
| Sending data         | 1.251331 |
| end                  | 0.000003 |
| removing tmp table   | 0.000008 |
| query end            | 0.000006 |
| closing tables       | 0.000009 |
| freeing items        | 0.000111 |
| cleaning up          | 0.000002 |
+----------------------+----------+

Compare the legacy profiling available for the query:

mysql> show profile for query 1;
+----------------------+----------+
| Status               | Duration |
+----------------------+----------+
| starting             | 0.000125 |
| checking permissions | 0.000007 |
| Opening tables       | 0.000020 |
| init                 | 0.000014 |
| System lock          | 0.000007 |
| optimizing           | 0.000003 |
| statistics           | 0.000011 |
| preparing            | 0.000011 |
| Creating tmp table   | 0.000027 |
| executing            | 0.000001 |
| Sending data         | 1.353825 |
| end                  | 0.000005 |
| removing tmp table   | 0.000007 |
| end                  | 0.000002 |
| query end            | 0.000006 |
| closing tables       | 0.000009 |
| freeing items        | 0.000069 |
| cleaning up          | 0.000028 |
+----------------------+----------+

The obvious question is: Why I would want to be limited to this information when the Performance Schema has so much more available?

But this proves we can get profiler information in a format we’re used to when MySQL fully deprecates the profiling tool.


Learn more about Pythian’s expertise in MySQL.


PlanetMySQL Voting: Vote UP / Vote DOWN

MariaDB 5.5.43 Overview and Highlights

$
0
0

MariaDB 5.5.43 was recently released (it is the latest MariaDB 5.5), and is available for download here:

https://downloads.mariadb.org/mariadb/5.5.43/

This is a maintenance release, and so there were not too many major changes, but definitely a few worth mentioning, as well as one *important* caution:

  • Security Fixes: Fixes for the following security vulnerabilities:
  • Deprecation Notice: As per the MariaDB Deprecation Policy, this will be the final release of MariaDB 5.5 for Fedora 19 “Schrödinger’s Cat”, Ubuntu 10.04 LTS “Lucid”, and Mint 9 LTS “Isadora”. When the next version of MariaDB 5.5 is released, repositories for these distributions will go away.
  • Includes all bugfixes and updates from MySQL 5.5.43 (MySQL 5.5.43 Overview and Highlights)
  • TokuDB upgraded to 7.5.6
  • XtraDB upgraded to 5.5.42-37.1
  • Important mysql_upgrade Caution: The mysql_upgrade in this version introduced a serious bug which affects mysql_upgrade. If already running a MariaDB 5.5.x version, then you can safely skip running mysql_upgrade. However, if migrating from MySQL to MariaDB 5.5, then note this bug. For this specific bug, the problem appears if the targeted databases include data structures such as views with binary or text blobs. The malfunction is in the REPAIR VIEW statement which the script calls.
    • The fix will appear in MariaDB 5.5.44, which will be available soon (MariaDB 5.5.44 includes all MySQL 5.5.44 fixes, so it will be available very shortly after MySQL 5.5.44 is released).

Given the security fixes, you may want to review the CVEs to see if this is something you need to address. Also, if running TokuDB or XtraDB, you may also want to benefit from those fixes, as well as the new MariaDB fixes. However, if you plan on migrating from MySQL, if the above bug is relevant to you, then you should either upgrade to MariaDB 5.5.42, wait for 5.5.44, or possibly upgrade to MariaDB 10.0 (10.0.19 also contains the fix).

If interested, the official MariaDB 5.5.43 release notes are here:

https://mariadb.com/kb/en/mariadb/development/release-notes/mariadb-5543-release-notes/

And the full list of fixed bugs and changes in MariaDB 5.5.43 can be found here:

https://mariadb.com/kb/en/mariadb/development/changelogs/mariadb-5543-changelog/

Hope this helps.


PlanetMySQL Voting: Vote UP / Vote DOWN

MariaDB 10.0.18 Overview and Highlights

$
0
0

MariaDB 10.0.18 was recently released, and is available for download here:

https://downloads.mariadb.org/mariadb/10.0.18/

This is the ninth GA release of MariaDB 10.0, and 19th overall release of MariaDB 10.0.

There were no major functionality changes, but there were some general improvements, several security fixes, plus a 10.0.18 mysql_upgrade caution, and quite a few bug fixes, so let me cover what I feel are the main items of note:

  • Security Fixes: Fixes for the following security vulnerabilities:
  • InnoDB upgraded to 5.6.24
  • XtraDB upgraded to 5.6.23-72.1
  • Spider upgraded to 3.2.21
  • mroonga upgraded to 5.02
  • Performance Schema upgraded to 5.6.24
  • Connect upgraded to 1.03.0006
  • Deprecation Notice: As per the MariaDB Deprecation Policy, this will be the final release of MariaDB 5.5 for Fedora 19 “Schrödinger’s Cat”, Ubuntu 10.04 LTS “Lucid”, and Mint 9 LTS “Isadora”. When the next version of MariaDB 5.5 is released, repositories for these distributions will go away.
  • Important mysql_upgrade Caution: The mysql_upgrade in this version introduced a serious bug which affects mysql_upgrade. If already running a MariaDB 5.5.x version, then you can safely skip running mysql_upgrade. However, if migrating from MySQL to MariaDB 5.5, then note this bug. For this specific bug, the problem appears if the targeted databases include data structures such as views with binary or text blobs. The malfunction is in the REPAIR VIEW statement which the script calls.
    • The fix will appear in MariaDB 5.5.44, which will be available soon (MariaDB 5.5.44 includes all MySQL 5.5.44 fixes, so it will be available very shortly after MySQL 5.5.44 is released).

Given the security fixes, if you are running a prior version of 10.0, I would recommend upgrading. However, due to the mysql_upgrade bug in this version, I recommend upgrading to
10.0.19 instead (as it contains the fix for this bug).

You can read more about the 10.0.18 release here:

https://mariadb.com/kb/en/mariadb-10018-release-notes/

And if interested, you can review the full list of changes in 10.0.18 (changelogs) here:

https://mariadb.com/kb/en/mariadb-10018-changelog/

Hope this helps.


PlanetMySQL Voting: Vote UP / Vote DOWN

MariaDB 10.0.19 Overview and Highlights

$
0
0

MariaDB 10.0.19 was recently released, and is available for download here:

https://downloads.mariadb.org/mariadb/10.0.19/

This is the tenth GA release of MariaDB 10.0, and 20th overall release of MariaDB 10.0.

This was a quick release in order to get a fix for a mysql_upgrade bug (MDEV-8115) introduced in 10.0.18, so there is that, and only 9 other bug fixes.

Here are the main items of note:

  • Fixed the server crash caused by mysql_upgrade (MDEV-8115)
  • Connect upgraded to 1.03.0007

Due to the mysql_upgrade bug fix as well as all of the fixes in MariaDB 10.0.18 (including 5 Security fixes), I would definitely recommend upgrading to this if you are running a prior version of MariaDB 10.0, especially 10.0.18.

You can read more about the 10.0.19 release here:

https://mariadb.com/kb/en/mariadb-10019-release-notes/

And if interested, you can review the full list of changes in 10.0.19 (changelogs) here:

https://mariadb.com/kb/en/mariadb-10019-changelog/

Hope this helps.


PlanetMySQL Voting: Vote UP / Vote DOWN

MySQL 5.7 key features

$
0
0

The other day I was discussing new features of MySQL 5.7 with a Percona Support customer. After that conversation, I thought it would be a good idea to compile list of important features of MySQL 5.7. The latest MySQL 5.7.6 release candidate (RC) is out and is packed with nice features. Here’s a list of some MySQL 5.7 key features.

Replication Enhancements:

  • One of the top features in MySQL 5.7 is multi-source replication. With multi-source replication you can point multiple master server’s to slave so limitation of slave having only one master is lift off. There is nice blog post written by my colleague on multi-source replication you will find useful.
  • SHOW SLAVE STATUS is non-blocking since MySQL 5.7. SHOW SLAVE STATUS returns immediately without waiting for STOP SLAVE to finish which can be blocked by long running SQL query from replication SQL_THREAD. As a side note, the LOCK FREE SHOW SLAVE STATUS feature is first implemented in Percona Server 5.5.
  • Now you can have all the information about SHOW SLAVE STATUS from performance schema database tables. More details here from the manual.
  • With the new CHANGE REPLICATION FILTER command now you can modify replication filters rules without bouncing MySQL servers.
  • Since MySQL 5.7 you can perform CHANGE MASTER TO without stopping the slave via the STOP SLAVE command. For further details check the manual.
  • There is now a different method for parallel replication. With new implementation the slave can apply transaction in parallel with single database/schema too. Check slave_parallel_type for details.
  • Global Transaction Identifiers (GTID) is a feature that automatically tracks the replication position in replication stream, and since MySQL 5.7 gtid_mode is dynamic variables, which means you can enable/disable GTID in replication topology without synchronizing and restarting entire set of MySQL servers. As a side note, online GTID deployment feature is added in Percona Server 5.6. With this feature you can deploy GTID on existing replication setups without marking master read_only and stopping all slaves in replication chain. My colleague Stephane had written nice blogpost to perform online migration without master downtime.

InnoDB Enhancements:

  • Now you can resize InnoDB buffer pool online. Since MySQL 5.7 innodb_buffer_pool_size is a dynamic variable which provides the ability to resize buffer pool without restarting MySQL server.
  • From MySQL 5.7, online ALTER TABLE also supports RENAME INDEX clause to rename an index. This change will take in place without table copy operation.
  • InnoDB supports Transportable Tablespace feature for partitioned InnoDB tables. I wrote a blog post on Transportable Tablespace that you will find useful.
  • Innochecksum utility is enhanced with new options. I also wrote a recent blog post on this same topic.
  • As of MySQL 5.7, InnoDB supports “spatial indexes” and it also supports online DDL operation to add spatial indexes i.e. ALTER TABLE .. ALGORITHM=INPLACE.
  • Improved InnoDB buffer pool dump/reload operations. A new system variable, innodb_buffer_pool_dump_pct allows you to specify percentage of most recently used pages in each buffer pool to read out and dump.

Triggers:

  • As per SQL standard, MySQL 5.7 now supports multiple triggers per table for trigger event (DML) and timing (BEFORE,AFTER) i.e. multiple triggers are permitted now for each event e.g. multiple triggers on INSERT action.

Performance Improvements:

  • Bulk data load is improved on InnoDB in MySQL 5.7. InnoDB performs a bulk load when creating or rebuilding indexes. This method known as sorted index build and enhance create index operation and it also impacts FULLTEXT indexes.
  • Currently there is a single page cleaner thread responsible for flushing dirty pages from the buffer pool(s). In MySQL 5.7 InnoDB parallel flushing was implemented to improve flushing where separate background thread for each buffer pool instance for flush list, LRU list. It’s worth to mention a two-threaded flushing implemented in Percona Server 5.6.

Optimizer Improvements:

  • EXPLAIN FOR CONNECTION will let you run explain statements for already running queries. This may yield important information towards query optimization.
  • In MySQL 5.7 the optimizer avoids the creatation temporary table for result of UNION ALL queries and this will help to reduce disk I/O and disk space when UNION yields large result set. I found Morgan Tocker post informative on same.
  • JSON format for EXPLAIN first introduced in MySQL 5.6 which produces extended information. JSON format for EXPLAIN is enhanced in version 5.7 by printing total query cost which makes it easier to see the difference between the good and bad execution plans.
  • MySQL 5.7 now supports generated columns also known as virtual columns as new feature. My colleague Alexander explained this really well in this blogpost

MySQL Test Suite Enhancements:

  • The MySQL test suite now uses InnoDB as its default storage engine. Along with that many new tests added and existing tests enhanced including test suite for replication with GTID.

Security Enhancements:

  • Since MySQL 5.7 there is a password expiration policy in place. Any user that connects to a MySQL server goes through a password expiration life cycle and must change the password. More from the manual here.
  • Database administrators can nowo lock/unlock user accounts. Check details here.
  • As of MySQL 5.7, installation only creates only one ‘root@localhost’ user account with random password and marks the password expiration cycle. So, installation no longer creates anonymous-user accounts and along with that there is no test database. For root user account password, MySQL generates it during data directory initialization and marks it as expired and will write a message to stdout displaying the password.

Conclusion:
This is only a short list of new features in MySQL 5.7. Please feel free to add your favorite features in the comments section. Along with new features, there are quite a few deprecated/removed features in MySQL 5.7. You can get full list from the manual.

The post MySQL 5.7 key features appeared first on MySQL Performance Blog.


PlanetMySQL Voting: Vote UP / Vote DOWN

Fedora 22 is out, and we’re ready

$
0
0
Fedora 22 arrived yesterday. With a cutting edge GCC (5.1), the new DNF package management system, and improved tooling for server administration, we congratulate the Fedora community on yet another innovative release. We’re following up from our side, and as of yesterday our repos offer Fedora 22 packages of these products: MySQL Server 5.6 (currently […]
PlanetMySQL Voting: Vote UP / Vote DOWN
Rearchitecting GitHub Pages

$
0
0

GitHub Pages, our static site hosting service, has always had a very simple architecture. From launch up until around the beginning of 2015, the entire service ran on a single pair of machines (in active/standby configuration) with all user data stored across 8 DRBD backed partitions. Every 30 minutes, a cron job would run generating an nginx map file mapping hostnames to on-disk paths.

There were a few problems with this approach: new Pages sites did not appear until the map was regenerated (potentially up to a 30-minute wait!); cold nginx restarts would take a long time while nginx loaded the map off disk; and our storage capacity was limited by the number of SSDs we could fit in a single machine.

Despite these problems, this simple architecture worked remarkably well for us — even as Pages grew to serve thousands of requests per second to over half a million sites.

When we started approaching the storage capacity limits of a single pair of machines and began to think about what a rearchitected GitHub Pages would look like, we made sure to stick with the same ideas that made our previous architecture work so well: using simple components that we understand and avoiding prematurely solving problems that aren't yet problems.

The new infrastructure

The new Pages infrastructure has been in production serving Pages requests since January 2015 and we thought we'd share a little bit about how it works.

architecture diagram

Frontend tier

After making it through our load balancers, incoming requests to Pages hit our frontend routing tier. This tier comprises a handful of Dell C5220s running nginx. An ngx_lua script looks at the incoming request and makes a decision about which fileserver to route it to. This involves querying one of our MySQL read replicas to look up which backend storage server pair a Pages site has been allocated to.

Once our Lua router has made a routing decision, we just use nginx's stock proxy_pass feature to proxy back to the fileserver. This is where ngx_lua's integration with nginx really shines, as our production nginx config is not much more complicated than:

location / {
  set $gh_pages_host "";
  set $gh_pages_path "";

  access_by_lua_file /data/pages-lua/router.lua;

  proxy_set_header X-GitHub-Pages-Root $gh_pages_path;
  proxy_pass http://$gh_pages_host$request_uri;
}

One of the major concerns we had with querying MySQL for routing is that this introduces an availability dependency on MySQL. This means that if our MySQL cluster is down, so is GitHub Pages. The reliance on external network calls also adds extra failure modes — MySQL queries performed over the network can fail in ways that a simple in-memory hashtable lookup cannot.

This is a tradeoff we accepted, but we have mitigations in place to reduce user impact if we do have issues. If the router experiences any error during a query, it'll retry the query a number of times, reconnecting to a different read replica each time. We also use ngx_lua's shared memory zones to cache routing lookups on the pages-fe node for 30 seconds to reduce load on our MySQL infrastructure and also allow us to tolerate blips a little better.

Since we're querying read replicas, we can tolerate downtime or failovers of the MySQL master. This means that existing Pages will remain online even during database maintenance windows where we have to take the rest of the site down.

We also have Fastly sitting in front of GitHub Pages caching all 200 responses. This helps minimise the availability impact of a total Pages router outage. Even in this worst case scenario, cached Pages sites are still online and unaffected.

Fileserver tier

The fileserver tier consists of pairs of Dell R720s running in active/standby configuration. Each pair is largely similar to the single pair of machines that the old Pages infrastructure ran on. In fact, we were even able to reuse large parts of our configuration and tooling for the old Pages infrastructure on these new fileserver pairs due to this similarity.

We use DRBD to sync Pages site data between the two machines in each pair. DRBD lets us synchronously replicate all filesystem changes from the active machine to the standby machine, ensuring that the standby machine is always up to date and ready to take over from the active at a moment's notice — say for example if the active machine crashes or we need to take it down for maintenance.

We run a pretty simple nginx config on the fileservers too - all we do is set the document root to $http_x_github_pages_root (after a little bit of validation to thwart any path traversal attempts, of course) and the rest just works.

Wrapping up

Not only are we now able to scale out our storage tier horizontally, but since the MySQL routing table is kept up to date continuously, new Pages sites are published instantly rather than 30 minutes later. This is a huge win for our customers. The fact that we're no longer loading a massive pre-generated routing map when nginx starts also means the old infrastructure's cold-restart problem is no longer an issue.

response times

We've also been really pleased with how ngx_lua has worked out. Its performance has been excellent — we spend less than 3ms of each request in Lua (including time spent in external network calls) at the 98th percentile across millions of HTTP requests per hour. The ability to embed our own code into nginx's request lifecycle has also meant that we're able to reuse nginx's rock-solid proxy functionality rather than reinventing that particular wheel on our own.


PlanetMySQL Voting: Vote UP / Vote DOWN

ClusterControl 1.2.10 Released

$
0
0

The Severalnines team is pleased to announce the release of ClusterControl 1.2.10. This release contains key new features along with performance improvements and bug fixes. We have outlined some of the key new features below. 


  • Highlights of ClusterControl 1.2.10 include:
  • ClusterControl DSL (Domain Specific Language) 
  • Integrated Developer Studio (Developer IDE) 
  • Database Advisors/JS bundle 
  • On-premise Deployment of MySQL / MariaDB Galera Cluster (New implementation)
  • Detection of long running and deadlocked transactions (Galera)
  • Detection of most advanced (last committed) node in case of cluster failure (Galera)
  • Registration of manually added nodes with ClusterControl
  • Failover and Slave Promotion in MySQL 5.6 Replication setups 
  • General front-end optimizations 

For additional details about the release:

ClusterControl DSL (Domain Specific Language): We are excited to announce our new, powerful ClusterControl DSL, which allows you extend the functionality of your ClusterControl platform by creating Advisors, Auto Tuners or “mini Programs”. The DSL syntax is based on JavaScript, with extensions to provide access to ClusterControl’s internal data structures and functions. The DSL allows you to execute SQL statements, run shell commands/programs across all your cluster hosts, and retrieve results to be processed for advisors/alerts or any other actions. 

Integrated Developer Studio (Developer IDE): The ClusterControl Dev Studio provides a simple and elegant development environment to quickly create, edit, compile, run, test, debug and schedule your JS programs. This is pretty cool - you are able to develop database advisors or mini programs that automate database tasks from within your web browser. 

Advisors/JS Bundle: Advisors in ClusterControl are powerful constructs; they provide specific advice on how to address issues in areas such as performance, security, log management, configuration, storage space, etc. They can be anything from simple configuration advice, warning on thresholds or more complex rules for predictions or cluster-wide automation tasks based on the state of your servers or databases.
In general, advisors perform more detailed analysis, and produce more comprehensive recommendations than alerts.

s9s-advisor-bundle on Github:
We ship a set of basic advisors that are open source under an MIT licence and which include rules and alerts on security settings, system checks (NUMA, Disk, CPU), queries, innodb, connections, performance schema, Galera configuration, NDB memory usage, and so on. The advisors can be downloaded from Github. Through the Developer Studio, it is easy to import ClusterControl JS bundles written by our partners or community users, or export your own for others to try out. 

On-premise Deployment of MySQL/MariaDB Galera Cluster: We have rewritten the on-premises deployment functionality for Galera clusters. You can now easily deploy a Galera cluster with up to 9 DB nodes.

Detection of long running and deadlocked transactions: Deadlocks, also called deadly embrace, happens when two or more transactions permanently block each other. These can cause quite a number of problems, especially in a synchronous cluster like Galera. It is now possible to view these through the web UI.

Galera Recovery - Detection of most advanced (last committed) node: In the unfortunate case of a cluster-wide crash, where the cluster is not restarting, you might need to bootstrap the cluster using the node with the most recent data. The admin can now get information about the most advanced node, and use that to bootstrap the cluster.

Registration of manually added nodes with ClusterControl: In some cases, an admin might be using other automation tools, e.g., Chef or Puppet, to add nodes to an existing cluster. In that case, it is now easy to register these new nodes to ClusterControl so they show up in the UI.

Failover and Slave Promotion in MySQL 5.6 Replication Setups: For MySQL Replication setups, you can now promote a slave to a master from the UI. It requires that you are on MySQL 5.6, and use GTID.

We encourage you to provide feedback and testing. If you’d like a demo, feel free to request one

With over 7,000 users to date, ClusterControl is the leading, platform independent automation and management solution for MySQL, MariaDB, MongoDB and PostgreSQL. 

Thank you for your ongoing support, and happy clustering!

For additional tips & tricks, follow our blog: http://www.severalnines.com/blog/.

Blog category:


PlanetMySQL Voting: Vote UP / Vote DOWN
Viewing all 18838 articles
Browse latest View live


<script src="https://jsc.adskeeper.com/r/s/rssing.com.1596347.js" async> </script>