Quantcast
Channel: Planet MySQL
Viewing all 18786 articles
Browse latest View live

How to use MySQL 8.0.4 with a GUI

$
0
0

If you want to have a look on what is about to come in the new version of the popular database and is used to Syntax Highlighting you don’t need to be chained to the Terminal.

Some of you may use tools like MySQL Workbench or Sequel Pro (as of the release of this post both tools had the following error occurring), and even if you are using the Terminal (if you are using an old version of mysql​, like 5.7) you may encounter this error:

Unable to connect to host 127.0.0.1, or the request timed out.

Be sure that the address is correct and that you have the necessary privileges, or try increasing the connection timeout (currently 10 seconds).

MySQL said: Authentication plugin ‘caching_sha2_password’ cannot be loaded: dlopen(/usr/local/lib/plugin/caching_sha2_password.so, 2): image not found

The reason for that is because since the 8.0.4 RC release, MySQL now uses SHA-2 Pluggable Authentication. In another words, how the database does authentication now changed.

Graphical User Interface

As of now, the only tool I could verify that it is working is Datagrip. But there is some steps to make sure you can successfully connect to the server. Follow the steps

1. The JDBC Connector

  1. Open the JDBC Connector page. Click on “Development Releases” tab and select your operating system, as of this post 8.0.9 was the latest version.
  2. Select the zip version of the file, if you are using macOS, select “Platform Independent”.
  3. The website it will ask for you to login, you don’t need to login, there is a link on the bottom of the page that says: “No thanks, just start my download.”.
  4. Unzip the zip​ file mysql-connector-java-8.0.9-rc.zip (the name may be different for you if the version is different)
  5. A folder will be created with the name of the compressed file, inside copy the jar file to a location where you can access it later easily, for example, I put mine in ~/workspace/drivers folder.

2. The GUI configuration

  1. Open Datagrip. Go to “File > Data Sources“. A window will open, right click on top of the “MySQL” name and select Duplicate.
  2. A new Driver is added with the name “MySQL [2]”, rename it to “MySQL 8.0”
    Data_Sources_and_Drivers.png
  3. Then, unselect “Use” on “Driver Files” and click on the + sign. Select the jar file you downloaded on the previous section.
    Data_Sources_and_Drivers.png
  4. Click in Apply.

3. Adding the source

  1. On the same window, click on the + sign on the top left. Select “MySQL 8.0
    Screen Shot 2018-02-22 at 14.50.28.png
  2. Fill out the details as you would for a connection:
    Data_Sources_and_Drivers
  3. Click on “Test Connection“.
  4. If everything worked, just click in “OK” to exit the screen.

MariaDB MaxScale 2.2: Introducing Failover, Switchover and Automatic Rejoin

$
0
0
MariaDB MaxScale 2.2: Introducing Failover, Switchover and Automatic Rejoin Esa Korhonen Thu, 02/22/2018 - 18:16

Failure tolerance and recoverability are essential for a high availability (HA) database setup. Although modern systems are quite reliable, hardware errors or software bugs (not necessarily in the database itself) can bring a system down. MariaDB HA setups use master-slave replication to copy the data to multiple servers, which may be located in different datacenters. Should the master server fail the application can be directed to use one of the slave servers. This operation either requires manual interference from a dba or a custom automated script. Depending on time of day and personnel, manual operation may be slow. Custom scripts may lack testing and flexibility. Clearly, recovery should be automatic, thoroughly tested and preferably included in existing database scalability software.

To answer this demand, MariaDB MaxScale 2.2.2. adds the following master-slave replication cluster management features:

  • Failover: replace a failed master with the most up-to-date slave
  • Switchover: swap the running master with a designated slave
  • Rejoin: rejoin a standalone server to the cluster as a slave

MariaDB MaxScale is an advanced database proxy for MariaDB database servers. It sits between client applications and the database servers, routing client queries and server responses. MaxScale also monitors the servers, so it will quickly notice any changes in server status or replication topology. This makes MaxScale a natural choice for controlling failover and similar features.

Failover for the master-slave cluster can and often should be set to activate automatically. Switchover must be activated manually through MaxAdmin, MaxCtrl or the REST interface. Rejoin can be set to automatic or activated manually. These features are implemented in the mariadbmonitor-module. This module replaces the old mysqlmonitor (MaxScale is still backwards compatible with the old name). All three operations require GTID-based replication and are intended for simple single-master replication topologies. Additionally, failover and switchover expect the topology to be one-layer deep. The cluster master may be replicating from an external master, in which case a promoted master server is instructed to replicate from the external master.

In this blog post, we present an example setup and experiment with the new features. The database setup for this example is:

  • One VM for MariaDB MaxScale 2.2.2
  • One VM for the master MariaDB Server
  • One VM for the slave MariaDB Server 
     

_MaxScale Cluster.jpg

[root@box01 ~]# maxadmin list servers
Servers.
-------------------+-----------------+-------+-------------+--------------------
Server             | Address         | Port  | Connections | Status
-------------------+-----------------+-------+-------------+--------------------
box02              | 192.168.50.12   |  3306 |           0 | Master, Running
box03              | 192.168.50.13   |  3306 |           0 | Slave, Running
-------------------+-----------------+-------+-------------+--------------------

Here is the vagrantfile used for the examples of this blog:

# -*- mode: ruby maxscale222
# vi: set ft=ruby :

# Vagrantfile API/syntax version. Don't touch unless you know what you're doing!
VAGRANTFILE_API_VERSION = "2"

Vagrant.configure(VAGRANTFILE_API_VERSION) do |config|

 #: adding ansible stuff
 config.ssh.insert_key = false

 #: maxscale box
 config.vm.define "box01" do |box01|
 box01.vm.hostname="box01"
 box01.vm.box = "centos7.2_x86_64"
 box01.vm.network "private_network", ip: "192.168.50.11", virtualbox__intnet: "XY"
 end
 ######: MASTER / SLAVE SERVERS :######
 #: master, async && semisync replication
 config.vm.define "box02" do |box02|
box02.vm.hostname="box02"
       box02.vm.box = "centos7.2_x86_64"
       box02.vm.network "private_network", ip: "192.168.50.12", virtualbox__intnet: "XY"
 end

 #: slave01, async && semisync replication
 config.vm.define "box03" do |box03|
       box03.vm.hostname="box03"
       box03.vm.box = "centos7.2_x86_64"
       box03.vm.network "private_network", ip: "192.168.50.13", virtualbox__intnet: "XY"
 end
end

Setting up MariaDB Maxscale 2.2.2

In these examples we are running CentOS 7.2. If you are running a Debian based Linux distribution, check (MariaDB Maxscale 2.2.2 Download) for the best MaxScale package for your system.  After downloading, install the packages and configure MaxScale as presented below.

#: packages you want to download
[root@box01 ~]# ls -lhS
total 15M
-rw-r--r--  1 root root 7.8M Jan 10 20:44 maxscale-client-2.2.2-1.centos.7.x86_64.rpm
-rw-r--r--  1 root root 7.0M Jan 10 20:44 maxscale-2.2.2-1.centos.7.x86_64.rpm

#: set up them
[root@box01 ~]# rpm -ivh *.rpm
Preparing...                          ################################# [100%]
Updating / installing...
  1:maxscale-client-2.2.2-1          ################################# [ 50%]
  2:maxscale-2.2.2-1                 ################################# [100%]

#: checking the version
[root@box01 ~]# maxscale --version-full
MaxScale 2.2.2 - eda82881619388a3512d6cfcbcf9ad83ea930339
[...snip...]

#: basic configuration - /etc/maxscale.cnf
[maxscale]
threads=auto
log_info=true

[rwsplit-service]
type=service
router=readwritesplit
user=maxuser
passwd=D96E8B61A569EDD7C625D822203932FA

[CLI]
type=service
router=cli

[CLI Unix Listener]
type=listener
service=CLI
protocol=maxscaled
socket=default

[CLI Inet Listener]
type=listener
service=CLI
protocol=maxscaled
address=localhost
port=6603

Above, the password for the service user is encrypted. An encrypted password can be generated with the maxkeys and maxpasswd utilities. For more information, check maxkeys/maxpasswd. Once configuration is complete, start Maxscale:

[root@box01 ~]# systemctl enable maxscale.service
Created symlink from /etc/systemd/system/multi-user.target.wants/maxscale.service to /usr/lib/systemd/system/maxscale.service.
[root@box01 ~]# systemctl is-enabled maxscale.service
enabled
[root@box01 ~]# systemctl start maxscale.service
[root@box01 ~]# systemctl status maxscale.service
● maxscale.service - MariaDB MaxScale Database Proxy
  Loaded: loaded (/usr/lib/systemd/system/maxscale.service; enabled; vendor preset: disabled)
  Active: active (running) since Fri 2018-01-12 00:24:21 GMT; 5s ago
 Process: 4035 ExecStart=/usr/bin/maxscale (code=exited, status=0/SUCCESS)
 Process: 4032 ExecStartPre=/usr/bin/install -d /var/run/maxscale -o maxscale -g maxscale (code=exited, status=0/SUCCESS)
Main PID: 4038 (maxscale)
  CGroup: /system.slice/maxscale.service
          └─4038 /usr/bin/maxscale

The following script demonstrates MaxScale’s runtime configuration management. These items could have been added to the configuration file instead. The commands generate a server cluster monitor within MaxScale and set it up for automatic cluster management. The individual parameters set here are presented in the next section.

#!/bin/bash

#: creating the monitor
maxadmin create monitor cluster-monitor mariadbmon

#: adding more features for the MariaDBMon monitor
maxadmin alter monitor cluster-monitor user=maxuser password=ACEEF153D52F8391E3218F9F2B259EAD monitor_interval=1000 replication_user=mariadb replication_password=ACEEF153D52F8391E3218F9F2B259EAD failcount=5 auto_failover=true auto_rejoin=true

#: restarting the monitor
maxadmin restart monitor cluster-monitor

#: creating the service listener
maxadmin create listener rwsplit-service rwsplit-listener 0.0.0.0 53310

#: creating and adding the servers
maxadmin create server prod_mariadb01 192.168.50.12 3306
maxadmin create server prod_mariadb02 192.168.50.13 3306
maxadmin add server prod_mariadb01 cluster-monitor rwsplit-service
maxadmin add server prod_mariadb02 cluster-monitor rwsplit-service

Before executing the script above, you should generate the users maxuser and mariadb (or whatever usernames were generated by the script) on the backends. Again, their encrypted passwords for the script should be generated with maxpasswd.

#: script execution output

[root@box01 ~]# ./mxs222_configs_rwsplit.sh
Created monitor 'cluster-monitor'
Listener 'rwsplit-listener' created
Created server 'prod_mariadb01'
Created server 'prod_mariadb02'
Added server 'prod_mariadb01' to 'cluster-monitor'
Added server 'prod_mariadb01' to 'rwsplit-service'
Added server 'prod_mariadb02' to 'cluster-monitor'
Added server 'prod_mariadb02' to 'rwsplit-service'

The monitor is now running. To check the status of Maxscale, execute the following:

#: listing servers after creating the configurations

[root@box01 ~]# maxadmin list servers
Servers.
-------------------+-----------------+-------+-------------+--------------------
Server             | Address         | Port  | Connections | Status
-------------------+-----------------+-------+-------------+--------------------
prod_mariadb01     | 192.168.50.12   |  3306 |           0 | Master, Running
prod_mariadb02     | 192.168.50.13   |  3306 |           0 | Slave, Running
-------------------+-----------------+-------+-------------+--------------------

#: listing monitors

[root@box01 ~]# maxadmin list monitors
---------------------+---------------------
Monitor              | Status
---------------------+---------------------
cluster-monitor      | Running
---------------------+---------------------

Finally, you may check the listener and the open port:

[root@box01 ~]# maxadmin list listeners | grep rwsplit-listener
Rwsplit-listener | rwsplit-service | MariaDBClient | 0.0.0.0 | 53310 | Running 

[root@box01 ~]# netstat -l | grep 53310
tcp        0      0 0.0.0.0:53310           0.0.0.0:*               LISTEN

Monitor configuration parameters

The following parameters enable and control the cluster management features.

  • replication_user and replication_password: These are the username and the password used by MariaDBMonitor when generating a CHANGE MASTER TO-command.

  • auto_failover: Enables automatic failover. Failover can be activated manually regardless of this setting

  • failover_timeout: Time limit (in seconds) for executing a failover, measured from the moment failover (automatic or manual) is activated. If time runs out, an event is logged, and automatic failover is disabled. Typically, the timeout is only reached if the selected new master server cannot consume its relay log quickly enough.

  • auto_rejoin: Enable automatic rejoin. When enabled, two types of servers are set to replicate from the current cluster master:

    • Standalone servers (no slave thread)
    • Any server replicating from (or attempting to) from a server which is not the cluster master server.
  • failcount: How many times (during different monitoring passes) a server must fail to respond to status query before it is declared down and an automatic failover may be triggered if enabled.

  • verify_master_failure: This enables an additional criteria for triggering an automatic failover. The monitor will look at the master binlog file positions of the slave servers and if they have advanced within a configured timeout, failover is not activated even if the monitor cannot connect to the master. This means that at least one slave still receives events even if MaxScale cannot connect to the master.

  • master_failure_timeout: The timeout for verify_master_failure.

  • switchover_timeout: Similar to failover_timeout, just for switchover.

An example configuration file section for a monitor with these settings is below.

[wb@maxscale maxscale.cnf.d]$ cat /var/lib/maxscale/maxscale.cnf.d/cluster-monitor.cnf

[cluster-monitor]
type=monitor
module=mariadbmon
servers=prod_mariadb01,prod_mariadb02
user=maxuser
password=ACEEF153D52F8391E3218F9F2B259EAD
replication_user=mariadb
replication_password=ACEEF153D52F8391E3218F9F2B259EAD
monitor_interval=1000 #: it should be >= 5000 for production
auto_failover=1
failover_timeout=5    #: it should be >= 10 for production
auto_rejoin=true
failcount=5
master_failure_timeout=2
verify_master_failure=true
switchover_timeout=90

Switchover

If the current master is showing any issues, you may want to promote a slave to take its place. The switchover-command takes three arguments: the monitor name, the slave to be promoted and the current master.

#: switchover process
#: listing servers and current status
[root@box01 ~]# maxadmin list servers
Servers.
-------------------+-----------------+-------+-------------+--------------------
Server             | Address         | Port  | Connections | Status
-------------------+-----------------+-------+-------------+--------------------
prod_mariadb01     | 192.168.50.12   |  3306 |           0 | Master, Running
prod_mariadb02     | 192.168.50.13   |  3306 |           0 | Slave, Running
-------------------+-----------------+-------+-------------+--------------------

#: command to make the current slave a new master
[root@box01 ~]# maxadmin call command mariadbmon switchover cluster-monitor prod_mariadb02 prod_mariadb01

#: what Maxscale logs says, default location /var/log/maxscale/maxscale.log
2018-01-12 20:00:28   info   : (2) Started CLI client session [8] for 'root' from localhost
2018-01-12 20:00:28   info   : (8) [cli] MaxAdmin: call command "mariadbmon" "switchover" "cluster-monitor" "prod_mariadb02" "prod_mariadb01"
2018-01-12 20:00:29   notice : (8) [mariadbmon] Stopped the monitor cluster-monitor for the duration of switchover.
2018-01-12 20:00:29   notice : (8) [mariadbmon] Demoting server 'prod_mariadb01'.
2018-01-12 20:00:29   notice : (8) [mariadbmon] Promoting server 'prod_mariadb02' to master.
2018-01-12 20:00:29   notice : (8) [mariadbmon] Old master 'prod_mariadb01' starting replication from 'prod_mariadb02'.
2018-01-12 20:00:29   notice : (8) [mariadbmon] Redirecting slaves to new master.
2018-01-12 20:00:29   notice : (8) [mariadbmon] Switchover prod_mariadb01 -> prod_mariadb02 performed.2018-01-12 20:00:29   info   : Stopped CLI client session [8]

The warning messages suggest activating gtid_strict_mode on the servers, as this enables some additional checks when a server is starting replication.
#: listing servers again
[root@box01 ~]# maxadmin list servers
Servers.
-------------------+-----------------+-------+-------------+--------------------
Server             | Address         | Port  | Connections | Status
-------------------+-----------------+-------+-------------+--------------------
prod_mariadb01     | 192.168.50.12   |  3306 |           0 | Slave, Running
prod_mariadb02     | 192.168.50.13   |  3306 |           0 | Master, Running
-------------------+-----------------+-------+-------------+-------------------- 

Switchover uses the server global setting read_only to freeze the master server when preparing to switch. Users with SUPER-privilege bypass read_only, which allows them to modify data during a switchover. This often causes replication to  break as different servers have different events. To prevent this, make sure that any users who regularly do write queries do not have SUPER.

Failover

Failover is activated when the master crashes or becomes unavailable. MariaDB Monitor will detect that the master is out of reach, will wait for a while in case the master quickly comes back (wait time is configurable), and finally begins failover to replace the failed master with a slave.

For example, if failcount is 5 and monitor_interval is 1000, the failover requires 5 monitor passes without master server connection, with one second waits between monitor passes.

Let's demonstrate by shutting down the current master with systemctl. 

#: failover, let’s kill the current master
[root@box01 ~]# maxadmin list servers
Servers.
-------------------+-----------------+-------+-------------+--------------------
Server             | Address         | Port  | Connections | Status
-------------------+-----------------+-------+-------------+--------------------
prod_mariadb01     | 192.168.50.12   |  3306 |           0 | Slave, Running
prod_mariadb02     | 192.168.50.13   |  3306 |           0 | Master, Running
-------------------+-----------------+-------+-------------+--------------------

[root@box03 mysql]# systemctl stop mariadb
[root@box03 mysql]# systemctl status mariadb
● mariadb.service - MariaDB database server
Loaded: loaded (/usr/lib/systemd/system/mariadb.service; enabled; vendor preset: disabled)
Drop-In: /etc/systemd/system/mariadb.service.d
          └─migrated-from-my.cnf-settings.conf
Active: inactive (dead) since Fri 2018-01-12 20:19:39 GMT; 12s ago
Process: 4295 ExecStartPost=/bin/sh -c systemctl unset-environment _WSREP_START_POSITION (code=exited, status=0/SUCCESS)
Process: 4259 ExecStart=/usr/sbin/mysqld $MYSQLD_OPTS $_WSREP_NEW_CLUSTER $_WSREP_START_POSITION (code=exited, status=0/SUCCESS)
Process: 4223 ExecStartPre=/bin/sh -c [ ! -e /usr/bin/galera_recovery ] && VAR= ||   VAR=`/usr/bin/galera_recovery`; [ $? -eq 0 ]   && systemctl set-environment _WSREP_START_POSITION=$VAR || exit 1 (code=exited, status=0/SUCCESS)
Process: 4221 ExecStartPre=/bin/sh -c systemctl unset-environment _WSREP_START_POSITION (code=exited, status=0/SUCCESS)
Main PID: 4259 (code=exited, status=0/SUCCESS)
Status: "MariaDB server is down"

Below is an excerpt of the MaxScale log. mariadbmon detects that the current master has gone away and after 2 monitor passes failover activates.

#: what Maxscale logs says, default location /var/log/maxscale/maxscale.log
2018-01-12 20:19:39   error  : Monitor was unable to connect to server [192.168.50.13]:3306 : "Can't connect to MySQL server on '192.168.50.13' (115)"
2018-01-12 20:19:39   notice : [mariadbmon] Server [192.168.50.13]:3306 lost the master status.
2018-01-12 20:19:39   notice : Server changed state: prod_mariadb02[192.168.50.13:3306]: master_down. [Master, Running] -> [Down]
2018-01-12 20:19:39   warning: [mariadbmon] Master has failed. If master status does not change in 2 monitor passes, failover begins.
2018-01-12 20:19:39   error  : [mariadbmon] No Master can be determined. Last known was 192.168.50.13:3306
2018-01-12 20:19:41   notice : [mariadbmon] Performing automatic failover to replace failed master 'prod_mariadb02'.
2018-01-12 20:19:41   notice : [mariadbmon] Promoting server 'prod_mariadb01' to master.
2018-01-12 20:19:41   notice : [mariadbmon] Redirecting slaves to new master.
2018-01-12 20:19:42   warning: [mariadbmon] Setting standalone master, server 'prod_mariadb01' is now the master.
2018-01-12 20:19:42   notice : Server changed state: prod_mariadb01[192.168.50.12:3306]: new_master. [Slave, Running] -> [Master, Running]
#: checking the server's status
[root@box01 ~]# maxadmin list servers
Servers.
-------------------+-----------------+-------+-------------+--------------------
Server             | Address         | Port  | Connections | Status
-------------------+-----------------+-------+-------------+--------------------
prod_mariadb01     | 192.168.50.12   |  3306 |           0 | Master, Running
prod_mariadb02     | 192.168.50.13   |  3306 |           0 | Down
-------------------+-----------------+-------+-------------+--------------------

Automatic rejoin

When auto_rejoin is enabled, the monitor will rejoin any standalone database servers or any slaves replicating from a relay master to the main cluster. The typical use case for this feature is rejoining the old master after a failover. Should the master come back online after a slave was already promoted to its place, it would not be immediately replicating. Auto-rejoin will detect this and redirect the master. This is not certain to succeed as the master may have conflicting events. In this case the slave thread will end in an error.

Below is an example of a successful operation:

#: let’s test the auto_rejoin now as we will back up with

#: the server we put down on the failover exercise
[root@box01 ~]# maxadmin list servers
Servers.
-------------------+-----------------+-------+-------------+--------------------
Server             | Address         | Port  | Connections | Status
-------------------+-----------------+-------+-------------+--------------------
prod_mariadb01     | 192.168.50.12   |  3306 |           0 | Master, Running
prod_mariadb02     | 192.168.50.13   |  3306 |           0 | Down
-------------------+-----------------+-------+-------------+--------------------

#: what Maxscale logs says, default location /var/log/maxscale/maxscale.log
2018-01-12 20:22:43   notice : Server changed state: prod_mariadb02[192.168.50.13:3306]: server_up. [Down] -> [Running]
2018-01-12 20:22:43   notice : [mariadbmon] Directing standalone server 'prod_mariadb02' to replicate from 'prod_mariadb01'.
2018-01-12 20:22:43   notice : [mariadbmon] 1 server(s) redirected or rejoined the cluster.
2018-01-12 20:22:44   notice : Server changed state: prod_mariadb02[192.168.50.13:3306]: new_slave. [Running] -> [Slave, Running]

Above, the server backend prod_master02 has returned and was joined to the cluster as a slave of the current master.

#: checking the server's status
[root@box01 ~]# maxadmin list servers
Servers.
-------------------+-----------------+-------+-------------+--------------------
Server             | Address         | Port  | Connections | Status
-------------------+-----------------+-------+-------------+--------------------
prod_mariadb01     | 192.168.50.12   |  3306 |           0 | Master, Running
prod_mariadb02     | 192.168.50.13   |  3306 |           0 | Slave, Running
-------------------+-----------------+-------+-------------+--------------------

Additional Comments

  • If you omit the replication_user and the replication_password on the monitor configurations, the username and password used by the monitor to check the current state of the backends will be used instead. In this case the monitor user should have, in addition to its normal rights, the ability to connect among the backends as well. Usually the user for MariaDBMon is restricted to connections only from the MaxScale host.

  • If you use an encrypted password for the monitor user, the replication_password should be encrypted as well. Otherwise, the CHANGE MASTER TO query will fail.

  • MariaDB Servers forming a cluster should be configured with gtid_strict_mode enabled to make sure databases have the same binary log order among the instances.

MariaDB MaxScale 2.2 introduces failover, switchover and automatic rejoin for MariaDB Master/Slave replication clusters.

Login or Register to post comments

Percona Live 2018 Featured Talk – Scaling a High-Traffic Database: Moving Tables Across Clusters with Bryana Knight

$
0
0
Percona Live 2018 Featured Talk

Percona Live 2018 Featured TalkWelcome to the first interview blog for the upcoming Percona Live 2018. Each post in this series highlights a Percona Live 2018 featured talk that will be at the conference and gives a short preview of what attendees can expect to learn from the presenter.

This blog post highlights Bryana Knight, Platform Engineer at GitHub. Her talk is titled Scaling a High-Traffic Database: Moving Tables Across Clusters. Facing an immediate need to distribute load, GitHub came up with creative ways to move a significant amount of traffic off of their main MySQL cluster – with no user impact. In our conversation, we discussed how Bryana and GitHub solved some of these issues:

Percona: Who are you, and how did you get into databases? What was your path to your current responsibilities?

Bryana: I started at GitHub as a full-stack engineer working on a new business offering, and was then shortly offered the opportunity to transition to the database services team. Our priorities back then included reviewing every single database migration for GItHub.com. Having spent my whole career as a full-stack engineer, I had to level-up pretty quickly on MySQL, data modeling, data access patterns – basically everything databases. I spent the first few months learning our schema and setup through lots of reading, mentorship from other members of my team, reviewing migrations for most of our tables, and asking a million questions.

Originally, my team spent a lot of time addressing immediate performance concerns. Then we started partnering with product engineering teams to build out the backends for new features. Now we are focused on the longterm scalability and availability of our database, stemming from how we access it. I work right between our DBA’s and our product and API engineers.

Percona: Your talk is titled “Scaling a High-Traffic Database: Moving Tables Across Clusters”. What were the challenges GitHub faced that required redistributing your tables?

Bryana GitHubBryana: This biggest part of the GitHub codebase is an 8-year-old monolith. As a company, we’ve been fortunate enough to see a huge amount of user growth since the company started. User growth means data growth. The schema and setup that worked for GitHub early on, and very much allowed GitHub to get to where it is today with tons of features and an extremely robust API, is not necessarily the right schema and setup for the size GitHub is today. 

We were seeing that higher than “normal” load was starting to have a more noticeable effect. The monolith aspect of our database, organic growth, plus inefficiencies in our code base were putting a lot of pressure on the master of our primary database cluster, which held our most core tables (think users, repos, permissions). From the database perspective, this meant contention, locking, and replica lag. From the user’s perspective, this meant anything from longer page loads to delays in UI updates and notifications, to timeouts. 

Percona: What were some of the other options you looked at (if any)?

Bryana: Moving tables out of our main cluster was not the only action we took to alleviate some of the pressure in our database. However, it was the highest impact change we could make in the medium-term to give us the breathing room we needed and improve performance and availability. We also prioritized efforts around moving more reads to replicas and off the master, throttling more writes where possible, index improvements and query optimizations. Moving these tables gave us the opportunity to start thinking more long-term about how we can store and access our data differently to allow us to scale horizontally while maintaining our healthy pace of feature development.

Percona: What were the issues that needed to be worked out between the different teams you mention in your description? How did they impact the project?

Bryana: Moving tables out of our main database required collaboration between multiple teams. The team I’m on, database-services, was responsible for coming up with the strategy to move tables without user impact, writing the code to handle query isolation and routing, connection switching, backgrounding writes, and so on. Our database-infrastructure team determined where the tables we were moving should go (new cluster or existing), setup the clusters, and advised us on how to safely copy the data. In some cases, we were able to use MySQL replication. When that wasn’t possible, they weighed in on other options. 

We worked with production engineers to isolate data access to these tables and safely split JOINs with other tables. Everybody needed to be sure we weren’t affecting performance and user experience when doing this. We discussed with our support team the risk of what we were doing. Then we worked with them to determine if we should preemptively status yellow when there was a higher risk of user impact. During the actual cut-overs, representatives from all these groups would get on a war-room-like video call and “push the button”, and we always made sure to have a roll-out and roll-back plan. 

Percona: Why should people attend your talk? What do you hope people will take away from it?

Bryana: In terms of database performance, there are a lot of little things you can do immediately to try and make improvements: things like adding indexes, tweaking queries, and denormalizing data. There are also more drastic, architectural changes you can pursue, that many companies need to do when they get to certain scale. The topic of this talk is a valid strategy that fits between these two extremes. It relieved some ongoing performance problems and availability risk, while giving us some breathing room to think long term. I think other applications and databases might be in a similar situation and this could work for them. 

Percona: What are you looking forward to at Percona Live (besides your talk)?

This is actually the first time I’m attending a Percona Live conference. I’m hoping to learn from some of the talks around scaling a high traffic database and sharding. I’m also looking forward to seeing some talks from the wonderful folks on GitHub database-infrastructure team.

Want to find out more about this Percona Live 2018 featured talk, and Bryana and GitHub’s migration? Register for Percona Live 2018, and see her talk Scaling a High-Traffic Database: Moving Tables Across Clusters. Register now to get the best price!

Percona Live Open Source Database Conference 2018 is the premier open source event for the data performance ecosystem. It is the place to be for the open source community. Attendees include DBAs, sysadmins, developers, architects, CTOs, CEOs, and vendors from around the world.

The Percona Live Open Source Database Conference will be April 23-25, 2018 at the Hyatt Regency Santa Clara & The Santa Clara Convention Center.

How to Restore MySQL Logical Backup at Maximum Speed

$
0
0
Restore MySQL Logical Backup

Restore MySQL Logical BackupThe ability to restore MySQL logical backups is a significant part of disaster recovery procedures. It’s a last line of defense.

Even if you lost all data from a production server, physical backups (data files snapshot created with an offline copy or with Percona XtraBackup) could show the same internal database structure corruption as in production data. Backups in a simple plain text format allow you to avoid such corruptions and migrate between database formats (e.g., during a software upgrade and downgrade), or even help with migration from completely different database solution.

Unfortunately, the restore speed for logical backups is usually bad, and for a big database it could require days or even weeks to get data back. Thus it’s important to tune backups and MySQL for the fastest data restore and change settings back before production operations.

Disclaimer

All results are specific to my combination of hardware and dataset, but could be used as an illustration for MySQL database tuning procedures related to logical backup restore.

Benchmark

There is no general advice for tuning a MySQL database for a bulk logical backup load, and any parameter should be verified with a test on your hardware and database. In this article, we will explore some variables that help that process. To illustrate the tuning procedure, I’ve downloaded IMDB CSV files and created a MySQL database with pyimdb.

You may repeat the whole benchmark procedure, or just look at settings changed and resulting times.

Database:

  • 16GB – InnoDB database size
  • 6.6GB – uncompressed mysqldump sql
  • 5.8GB – uncompressed CSV + create table statements.

The simplest restore procedure for logical backups created by the mysqldump tool:

mysql -e 'create database imdb;'
time mysql imdb < imdb.sql
# real 129m51.389s

This requires slightly more than two hours to restore the backup into the MySQL instance started with default settings.

I’m using the Docker image percona:latest – it contains Percona Server 5.7.20-19 running on a laptop with 16GB RAM, Intel(R) Core(TM) i7-7700HQ CPU @ 2.80GHz, two disks: SSD KINGSTON RBU-SNS and HDD HGST HTS721010A9.

Let’s start with some “good” settings: buffer pool bigger than default, 2x1GB transaction log files, disable sync (because we are using slow HDD), and set big values for IO capacity,
the load should be faster with big batches thus use 1GB for max_allowed_packet.

Values were chosen to be bigger than the default MySQL parameters because I’m trying to see the difference between the usually suggested values (like 80% of RAM should belong to InnoDB buffer pool).

docker run --publish-all --name p57 -it -e MYSQL_ALLOW_EMPTY_PASSWORD=1 percona:5.7
  --innodb_buffer_pool_size=4GB
  --innodb_log_file_size=1G
  --skip-log-bin
  --innodb_flush_log_at_trx_commit=0
  --innodb_flush_method=nosync
  --innodb_io_capacity=2000
  --innodb_io_capacity_max=3000
  --max_allowed_packet=1G
  time (mysql --max_allowed_packet=1G imdb1 < imdb.sql )
  # real 59m34.252s

The load is IO bounded, and there is no reaction on set global foreign_key_checks=0 and unique_checks=0 because these variables are already disabled in the dump file.

How can we reduce IO?

Disable InnoDB double write: --innodb_doublewrite=0

time (mysql --max_allowed_packet=1G imdb1 < imdb.sql )
# real 44m49.963s

A huge improvement, but we still have an IO-bounded load.

We will not be able to improve load time significantly for IO bounded load. Let’s move to SSD:

time (mysql --max_allowed_packet=1G imdb1 < imdb.sql )
# real 33m36.975s

Is it vital to disable disk sync for the InnoDB transaction log?

sudo rm -rf mysql/*
docker rm p57
docker run -v /home/ihanick/Private/Src/tmp/data-movies/imdb.sql:/root/imdb.sql -v /home/ihanick/Private/Src/tmp/data-movies/mysql:/var/lib/mysql
--name p57 -it -e MYSQL_ALLOW_EMPTY_PASSWORD=1 percona:5.7
--innodb_buffer_pool_size=4GB
--innodb_log_file_size=1G
--skip-log-bin
--innodb_flush_log_at_trx_commit=0
--innodb_io_capacity=700
--innodb_io_capacity_max=1500
--max_allowed_packet=1G
--innodb_doublewrite=0
# real 33m49.724s

There is no significant difference.

By default, mysqldump produces SQL data, but it could also save data to CSV format:

cd /var/lib/mysql-files
mkdir imdb
chown mysql:mysql imdb/
time mysqldump --max_allowed_packet=128M --tab /var/lib/mysql-files/imdb imdb1
# real 1m45.983s
sudo rm -rf mysql/*
docker rm p57
docker run -v /srv/ihanick/tmp/imdb:/var/lib/mysql-files/imdb -v /home/ihanick/Private/Src/tmp/data-movies/mysql:/var/lib/mysql
--name p57 -it -e MYSQL_ALLOW_EMPTY_PASSWORD=1 percona:5.7
--innodb_buffer_pool_size=4GB
--innodb_log_file_size=1G
--skip-log-bin
--innodb_flush_log_at_trx_commit=0
--innodb_io_capacity=700
--innodb_io_capacity_max=1500
--max_allowed_packet=1G
--innodb_doublewrite=0
time (
mysql -e 'drop database imdb1;create database imdb1;set global FOREIGN_KEY_CHECKS=0;'
(echo "SET FOREIGN_KEY_CHECKS=0;";cat *.sql) | mysql imdb1 ;
for i in $PWD/*.txt ; do mysqlimport imdb1 $i ; done
)
# real 21m56.049s
1.5X faster, just because of changing the format from SQL to CSV!

We’re still using only one CPU core, let’s improve the load with the –use-threads=4 option:

time (
mysql -e 'drop database if exists imdb1;create database imdb1;set global FOREIGN_KEY_CHECKS=0;'
(echo "SET FOREIGN_KEY_CHECKS=0;";cat *.sql) | mysql imdb1
mysqlimport --use-threads=4 imdb1 $PWD/*.txt
)
# real 15m38.147s

In the end, the load is still not fully parallel due to a big table: all other tables are loaded, but one thread is still active.

Let’s split CSV files into smaller ones. For example, 100k rows in each file and load with GNU/parallel:

# /var/lib/mysql-files/imdb/test-restore.sh
apt-get update ; apt-get install -y parallel
cd /var/lib/mysql-files/imdb
time (
cd split1
for i in ../*.txt ; do echo $i ; split -a 6 -l 100000 -- $i `basename $i .txt`. ; done
for i in `ls *.*|sed 's/^[^.]+.//'|sort -u` ; do
mkdir ../split-$i
for j in *.$i ; do mv $j ../split-$i/${j/$i/txt} ; done
done
)
# real 2m26.566s
time (
mysql -e 'drop database if exists imdb1;create database imdb1;set global FOREIGN_KEY_CHECKS=0;'
(echo "SET FOREIGN_KEY_CHECKS=0;";cat *.sql) | mysql imdb1
parallel 'mysqlimport imdb1 /var/lib/mysql-files/imdb/{}/*.txt' ::: split-*
)
#real 16m50.314s

Split is not free, but you can split your dump files right after backup.

The load is parallel now, but the single big table strikes back with ‘setting auto-inc lock’ in SHOW ENGINE INNODB STATUSG

Using the --innodb_autoinc_lock_mode=2 option fixes this issue: 16m2.567s.

We got slightly better results with just mysqlimport --use-threads=4. Let’s check if hyperthreading helps and if the problem caused by “parallel” tool:

  • Using four parallel jobs for load: 17m3.662s
  • Using four parallel jobs for load and two threads: 16m4.218s

There is no difference between GNU/Parallel and --use-threads option of mysqlimport.

Why 100k rows? With 500k rows: 15m33.258s

Now we have performance better than for mysqlimport --use-threads=4.

How about 1M rows at once? Just 16m52.357s.

I see periodic flushing logs message with bigger transaction logs (2x4GB): 12m18.160s:

--innodb_buffer_pool_size=4GB --innodb_log_file_size=4G --skip-log-bin --innodb_flush_log_at_trx_commit=0 --innodb_io_capacity=700 --innodb_io_capacity_max=1500 --max_allowed_packet=1G --innodb_doublewrite=0 --innodb_autoinc_lock_mode=2 --performance-schema=0

Let’s compare the number with myloader 0.6.1 also running with four threads (myloader have only -d parameter, myloader execution time is under corresponding mydumper command):

# oversized statement size to get 0.5M rows in one statement, single statement per chunk file
mydumper -B imdb1 --no-locks --rows 500000 --statement-size 536870912 -o 500kRows512MBstatement
17m59.866s
mydumper -B imdb1 --no-locks -o default_options
17m15.175s
mydumper -B imdb1 --no-locks --chunk-filesize 128 -o chunk128MB
16m36.878s
mydumper -B imdb1 --no-locks --chunk-filesize 64 -o chunk64MB
18m15.266s

It will be great to test mydumper with CSV format, but unfortunately, it wasn’t implemented in the last 1.5 years: https://bugs.launchpad.net/mydumper/+bug/1640550.

Returning back to parallel CSV files load, even bigger transaction logs 2x8GB: 11m15.132s.

What about a bigger buffer pool: --innodb_buffer_pool_size=12G? 9m41.519s

Let’s check six-year-old server-grade hardware: Intel(R) Xeon(R) CPU E5-2430 with SAS raid (used only for single SQL file restore test) and NVMe (Intel Corporation PCIe Data Center SSD, used for all other tests).

I’m using similar options as for previous tests, with 100k rows split for CSV files load:

--innodb_buffer_pool_size=8GB --innodb_log_file_size=8G --skip-log-bin --innodb_flush_log_at_trx_commit=0 --innodb_io_capacity=700 --innodb_io_capacity_max=1500 --max_allowed_packet=1G --innodb_doublewrite=0 --innodb_autoinc_lock_mode=2

  • Single SQL file created by mysqldump loaded for 117m29.062s = 2x slower.
  • 24 parallel processes of mysqlimport: 11m51.718s
  • Again hyperthreading making a huge difference! 12 parallel jobs: 18m3.699s.
  • Due to higher concurrency, adaptive hash index is a reason for locking contention. After disabling it with --skip-innodb_adaptive_hash_index: 10m52.788s.
  • In many places, disable unique checks referred as a performance booster: 10m52.489s
    You can spend more time reading advice about unique_checks, but it might help for some databases with many unique indexes (in addition to primary one).
  • The buffer pool is smaller than the dataset, can you change old/new pages split to make insert faster? No: --innodb_old_blocks_pct=5 : 10m59.517s.
  • O_DIRECT is also recommended: --innodb_flush_method=O_DIRECT: 11m1.742s.
  • O_DIRECT is not able to improve performance by itself, but if you can use a bigger buffer pool: O_DIRECT + 30% bigger buffer pool: --innodb_buffeer_pool_size=11G: 10m46.716s.

Conclusions

  • There is no common solution to improve logical backup restore procedure.
  • If you have IO-bounded restore: disable InnoDB double write. It’s safe because even if the database crashes during restore, you can restart the operation.
  • Do not use SQL dumps for databases > 5-10GB. CSV files are much faster for mysqldump+mysql. Implement mysqldump --tabs+mysqlimport or use mydumper/myloader with appropriate chunk-filesize.
  • The number of rows per load data infile batch is important. Usually 100K-1M, use binary search (2-3 iterations) to find a good value for your dataset.
  • InnoDB log file size and buffer pool size are really important options for backup restore performance.
  • O_DIRECT reduces insert speed, but it’s good if you can increase the buffer pool size.
  • If you have enough RAM or SSD, the restore procedure is limited by CPU. Use a faster CPU (higher frequency, turboboost).
  • Hyperthreading also counts.
  • A powerful server could be slower than your laptop (12×2.4GHz vs. 4×2.8+turboboost).
  • Even with modern hardware, it’s hard to expect backup restore faster than 50MBps (for the final size of InnoDB database).
  • You can find a lot of different advice on how to improve backup load speed. Unfortunately, it’s not possible to implement improvements blindly, and you should know the limits of your system with general Unix performance tools like vmstat, iostat and various MySQL commands like SHOW ENGINE INNODB STATUS (all can be collected together with pt-stalk).
  • Percona Monitoring and Management (PMM) also provides good graphs, but you should be careful with QAN: full slow query log during logical database dump restore can cause significant processing load.
  • Default MySQL settings could cost you 10x backup restore slowdown
  • This benchmark is aimed at speeding up the restore procedure while the application is not running and the server is not used in production. Make sure that you have reverted all configuration parameters back to production values after load. For example, if you disable the InnoDB double write buffer during restore and left it enabled in production, you may have scary data corruption due to partial InnoDB pages writes.
  • If the application is running during restore, in most cases you will get an inconsistent database due to missing support for locking or correct transactions for restore methods (discussed above).

Updated: ClusterControl Tips & Tricks: MySQL Query Performance Tuning

$
0
0

Bad query performance is the most common problem DBA’s have to deal with. There are numerous ways to collect, process and analyze the data related to query performance - we’ve covered one of the most popular tools, pt-query-digest, in some of our previous blog posts:

Become a MySQL DBA blog series

When you use ClusterControl though, this is not always needed. You can use the data available in ClusterControl to solve your problem. In this blog post, we’ll look into how ClusterControl can help you solve problems related to query performance.

It may happen that a query cannot complete in a timely manner. The query may be stuck due to some locking issues, it may be not optimal or not indexed properly or it may be too heavy to complete in a reasonable amount of time. Keep in mind that a couple of not indexed joins can easily scan billions of rows if you have a large production database. Whatever happened, the query is probably using some of the resources - be it CPU or I/O for a non-optimized query or even just row locks. Those resources are required also for other queries and it may seriously slows things down. One of very simple yet important tasks would be to pinpoint the offending query and stop it.

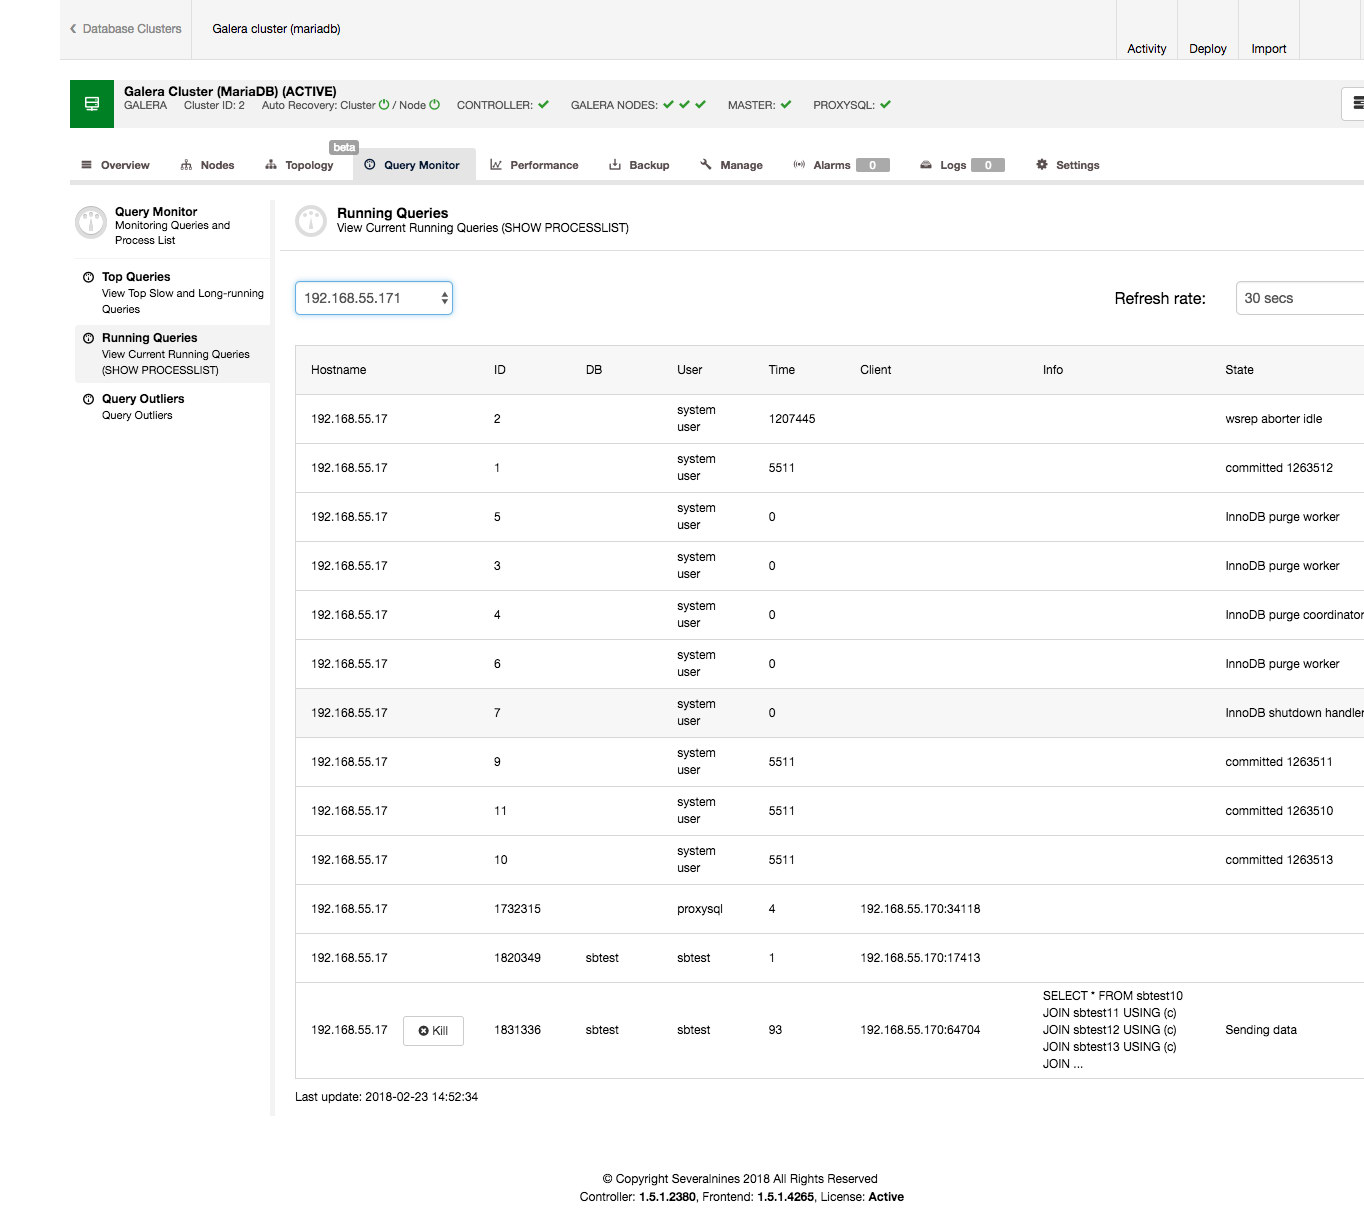
It is pretty easily done from the ClusterControl interface. Go to the Query Monitor tab -> Running Queries section - you should see an output similar to the screenshot below.

As you can see, we have a pile of queries stuck. Usually the offending query is the one which takes the long time, you might want to kill it. You may also want to investigate it further to make sure you pick the correct one. In our case, we clearly see a SELECT … FOR UPDATE which joins a couple of tables and which is in the ‘Sending data’ state meaning it is processing the data, for last 90 seconds.

Another type of question a DBA may need to answer is - which queries take most time to execute? This is a common question, as such queries may be a low hanging fruit - they may be optimizable, and the more execution time a given query is responsible for in a whole query mix, the larger is the gain from its optimization. It is a simple equation - if a query is responsible for 50% of total execution time, making it 10x faster will give much better result than optimizing a  query which is responsible for just 1% of the total execution time.

ClusterControl can help you answer such questions, but first we need to ensure the Query Monitor is enabled. You can toggle the Query Monitor to ON under the Query Monitor page. Furthermore you can configure the "Long Query Time" and "Log queries not using indexes" option under Settings to suit your workload:

The Query Monitor in ClusterControl works in two modes, depending on whether you have the Performance Schema available with the required data on the running queries or not. If it is available (and this is true by default in MySQL 5.6 and newer), Performance Schema will be used to collect query data, minimizing the impact on the system. Otherwise, the slow query log will be used and all of the settings visible in the above screenshot are used. Those are pretty well explained in the UI, so there’s no need to do it here. When the Query Monitor uses Performance Schema, those settings are not used (except for toggling ON/OFF the Query Monitor to enable/disable data collection).

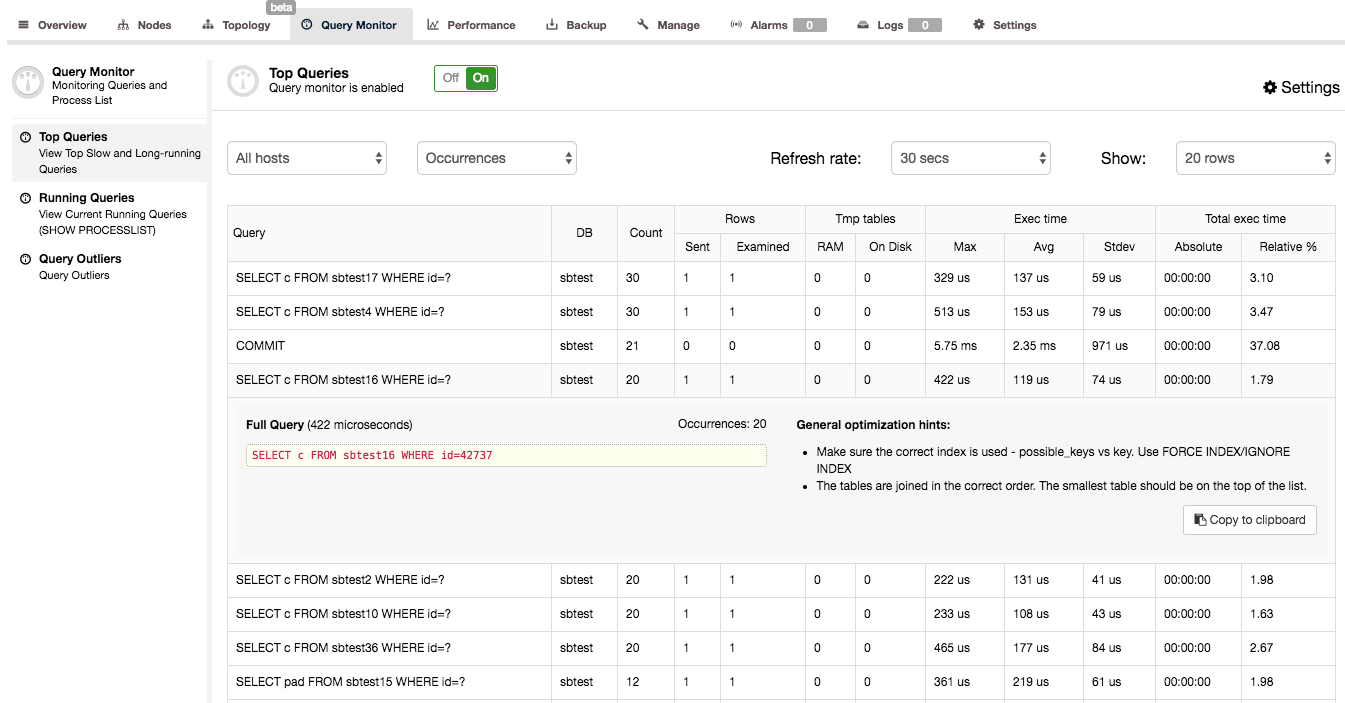
When you confirmed that the Query Monitor is enabled in ClusterControl, you can go to Query Monitor -> Top Queries, where you’ll be presented with a screen similar to the below:

What you can see here is a list of the most expensive queries (in terms of execution time) that hit our cluster. Each of them has some further details - how many times it was executed, how many rows were examined or sent to the client, how execution time varied, how much time the cluster spent on executing a given type of query. Queries are grouped by query type and schema.

You may be surprised to find out that the main place where execution time is spent is a ‘COMMIT’ query. Actually, this is fairly typical for quick OLTP queries executed on Galera cluster. Committing a transaction is an expensive process because certification has to happen. This leads to COMMIT being one of the most time-consuming queries in the query mix.

When you click on a query, you can see the full query, maximum execution time, number of occurrences, some general optimization hints and an EXPLAIN output for it - pretty useful to identify if something’s wrong with it. In our example we’ve checked a SELECT … FOR UPDATE with a high number of rows examined. As expected, this query is an example of terrible SQL - a JOIN which does not use any index. You can see on the EXPLAIN output that no index is used, not a single one was even considered possible to use. No wonder this query seriously impacted the performance of our cluster.

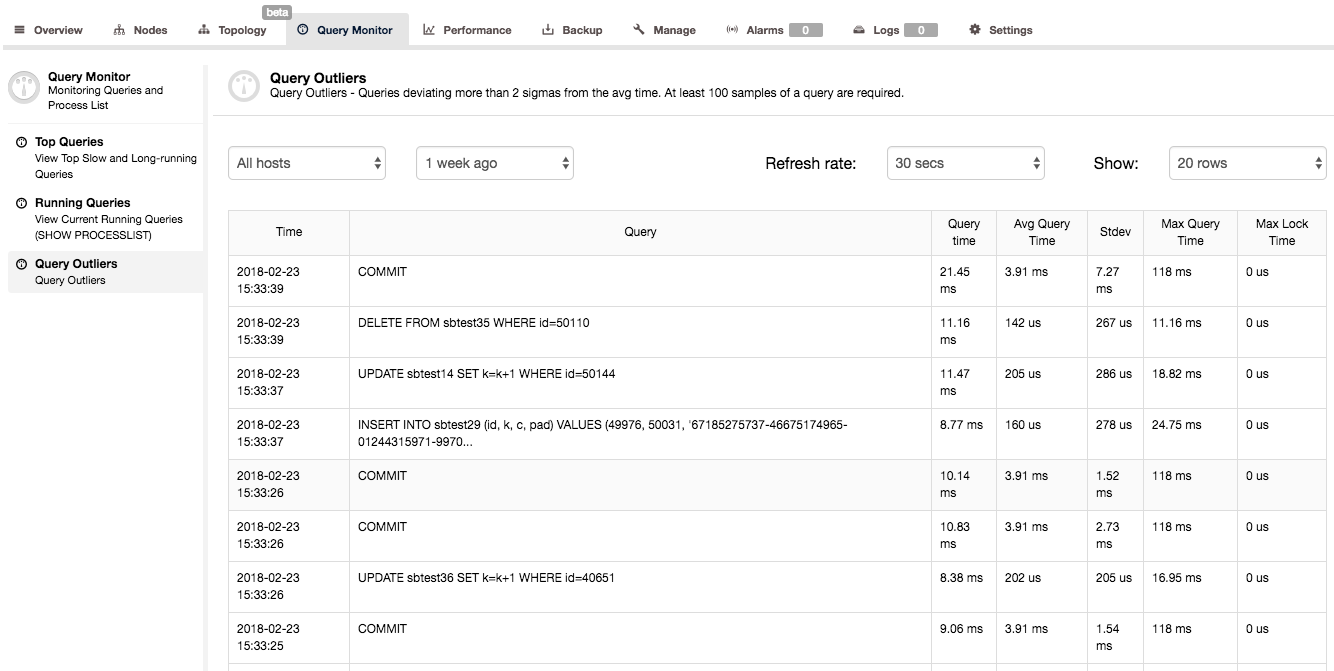
Another way to get some insight into query performance is to look at Query Monitor -> Query Outliers. This basically is a list of queries whose performance significantly differ from their average.

As you can see in the above screenshot, the second query took 0.01116s (time is shown in milliseconds) where average execution time for that query is much lower (0.000142s). We have also some additional statistical info on standard deviation and maximum query execution time. Such list of queries may seem to be not very useful - it’s not really true. When you see a query on this list, it means that something was different from the usual - query did not complete in regular time. It may be an indication of some performance issues on your system and a signal that you should investigate other metrics, and check if anything else happened at that time.

People tend to focus on achieving max performance, forgetting that it is not enough to have high throughput - it also has to be consistent. Users like performance to be stable - you may be able to squeeze more transactions per second from your system but if it means that some transactions will start to stall for seconds, that’s not worth it. Looking at the Query Histogram in ClusterControl helps you identify such consistency issues in your query mix.

Happy query monitoring!

PS.: To get started with ClusterControl, click here!

MariaDB version upgrade to 10.1.31 breaks Galera cluster

$
0
0

Recently we faced an issue where the config management software had automatically upgraded the mariadb-server-10.1 package to the latest 10.1.31 version. This upgrade broke the galera cluster setup for this installation.

I’ve started to recreate this issue in my local lab setup and I managed to reproduce this problem.

I have created a 3 node galera setup: galera1 (192.168.55.100), galera2 (192.168.55.101) and galera3 (192.168.55.102). All 3 servers run MariaDB-10.1.30. Galera replication is working fine.

This is the basic galera config:

# cat /etc/mysql/conf.d/cluster.cnf
#########################################################
# Galera config
#########################################################

[mysqld]
wsrep_on                                  = ON
wsrep_provider                            = /usr/lib/libgalera_smm.so
wsrep_provider_options                    =
wsrep_cluster_name                        = pxc_bootstrap
wsrep_cluster_address                     = gcomm://192.168.55.100,192.168.55.101,192.168.55.102
wsrep_node_address                        = 192.168.55.101
wsrep_log_conflicts                       = 1
wsrep_sst_method                          = xtrabackup-v2
wsrep_sst_auth                            = sstuser:sstpass

# Galera overrides
binlog_format                             = ROW
innodb_autoinc_lock_mode                  = 2

When I upgrade the galera2 node to 10.1.31 it will not rejoin the cluster:

2018-02-19 18:07:09 140541460941568 [Note] WSREP: State transfer required:
	Group state: ba08f7ac-1589-11e8-8944-27e143bb408f:285676
	Local state: ba08f7ac-1589-11e8-8944-27e143bb408f:273759
2018-02-19 18:07:09 140541460941568 [Note] WSREP: New cluster view: global state: ba08f7ac-1589-11e8-8944-27e143bb408f:285676, view# 33: Primary, number of nodes: 3, my index: 0, protocol version 3
2018-02-19 18:07:09 140541460941568 [Warning] WSREP: Gap in state sequence. Need state transfer.
2018-02-19 18:07:09 140541165565696 [Note] WSREP: Running: 'wsrep_sst_xtrabackup-v2 --role 'joiner' --address '192.168.55.101' --datadir '/var/lib/mysql/'   --parent '4754'  '' '
WSREP_SST: [INFO] Streaming with xbstream (20180219 18:07:09.327)
WSREP_SST: [INFO] Using socat as streamer (20180219 18:07:09.329)
WSREP_SST: [INFO] Stale sst_in_progress file: /var/lib/mysql//sst_in_progress (20180219 18:07:09.332)
WSREP_SST: [INFO] Evaluating timeout -k 110 100 socat -u TCP-LISTEN:4444,reuseaddr stdio | xbstream -x; RC=( ${PIPESTATUS[@]} ) (20180219 18:07:09.354)
2018-02-19 18:07:11 140541190731520 [Note] WSREP: (b2ffafb5, 'tcp://0.0.0.0:4567') connection to peer b2ffafb5 with addr tcp://192.168.55.101:4567 timed out, no messages seen in PT3S
2018-02-19 18:07:11 140541190731520 [Note] WSREP: (b2ffafb5, 'tcp://0.0.0.0:4567') turning message relay requesting off
WSREP_SST: [ERROR] Possible timeout in receving first data from donor in gtid stage (20180219 18:08:49.362)
WSREP_SST: [ERROR] Cleanup after exit with status:32 (20180219 18:08:49.364)
2018-02-19 18:08:49 140541165565696 [ERROR] WSREP: Failed to read 'ready <addr>' from: wsrep_sst_xtrabackup-v2 --role 'joiner' --address '192.168.55.101' --datadir '/var/lib/mysql/'   --parent '4754'  ''
	Read: '(null)'
2018-02-19 18:08:49 140541165565696 [ERROR] WSREP: Process completed with error: wsrep_sst_xtrabackup-v2 --role 'joiner' --address '192.168.55.101' --datadir '/var/lib/mysql/'   --parent '4754'  '' : 32 (Broken pipe)
2018-02-19 18:08:49 140541460941568 [ERROR] WSREP: Failed to prepare for 'xtrabackup-v2' SST. Unrecoverable.
2018-02-19 18:08:49 140541460941568 [ERROR] Aborting

The xtrabackup-script on the donor side is never executed:

2018-02-19 18:07:08 139902381455104 [Note] WSREP: Node b91cf7da state prim
2018-02-19 18:07:08 139902381455104 [Note] WSREP: view(view_id(PRIM,b2ffafb5,33) memb {
	b2ffafb5,0
	b91cf7da,0
	c9241678,0
} joined {
} left {
} partitioned {
})
2018-02-19 18:07:08 139902381455104 [Note] WSREP: save pc into disk
2018-02-19 18:07:08 139902373062400 [Note] WSREP: New COMPONENT: primary = yes, bootstrap = no, my_idx = 2, memb_num = 3
2018-02-19 18:07:08 139902373062400 [Note] WSREP: STATE EXCHANGE: Waiting for state UUID.
2018-02-19 18:07:09 139902373062400 [Note] WSREP: STATE EXCHANGE: sent state msg: b3995870-159f-11e8-8bdd-c675484f2591
2018-02-19 18:07:09 139902373062400 [Note] WSREP: STATE EXCHANGE: got state msg: b3995870-159f-11e8-8bdd-c675484f2591 from 0 (galera2)
2018-02-19 18:07:09 139902373062400 [Note] WSREP: STATE EXCHANGE: got state msg: b3995870-159f-11e8-8bdd-c675484f2591 from 1 (galera3)
2018-02-19 18:07:09 139902373062400 [Note] WSREP: STATE EXCHANGE: got state msg: b3995870-159f-11e8-8bdd-c675484f2591 from 2 (galera1)
2018-02-19 18:07:09 139902373062400 [Note] WSREP: Quorum results:
	version    = 4,
	component  = PRIMARY,
	conf_id    = 32,
	members    = 2/3 (joined/total),
	act_id     = 285676,
	last_appl. = 0,
	protocols  = 0/7/3 (gcs/repl/appl),
	group UUID = ba08f7ac-1589-11e8-8944-27e143bb408f
2018-02-19 18:07:09 139902373062400 [Note] WSREP: Flow-control interval: [28, 28]
2018-02-19 18:07:09 139902373062400 [Note] WSREP: Trying to continue unpaused monitor
2018-02-19 18:07:09 139902653332224 [Note] WSREP: New cluster view: global state: ba08f7ac-1589-11e8-8944-27e143bb408f:285676, view# 33: Primary, number of nodes: 3, my index: 2, protocol version 3
2018-02-19 18:07:09 139902653332224 [Note] WSREP: wsrep_notify_cmd is not defined, skipping notification.
2018-02-19 18:07:09 139902653332224 [Note] WSREP: REPL Protocols: 7 (3, 2)
2018-02-19 18:07:09 139902653332224 [Note] WSREP: Assign initial position for certification: 285676, protocol version: 3
2018-02-19 18:07:09 139902431176448 [Note] WSREP: Service thread queue flushed.
2018-02-19 18:07:11 139902381455104 [Note] WSREP: (c9241678, ‘tcp://0.0.0.0:4567’) turning message relay requesting off
2018-02-19 18:08:51 139902381455104 [Note] WSREP: declaring b91cf7da at tcp://192.168.55.102:4567 stable
2018-02-19 18:08:51 139902381455104 [Note] WSREP: forgetting b2ffafb5 (tcp://192.168.55.101:4567)
2018-02-19 18:08:51 139902381455104 [Note] WSREP: Node b91cf7da state prim
2018-02-19 18:08:51 139902381455104 [Note] WSREP: view(view_id(PRIM,b91cf7da,34) memb {
	b91cf7da,0
	c9241678,0
} joined {
} left {
} partitioned {
	b2ffafb5,0
})

After some digging into the wsrep_sst_xtrabackup-v2 script I traced back the problem to the function wait_for_listen. This function was rewritten for MariaDB 10.1.31 to be able to add support for FreeBSD. This rewrite seems to have somehow broken it for Linux.

I have created a bug report in the MariaDB Jira but if you’re using MariaDB with Galera cluster, I suggest you wait a while before upgrading your installation to 10.1.31.

This Week in Data with Colin Charles 29: Percona Live Full Schedule, MariaDB Events, and a Matter of Compatibility

$
0
0
Colin Charles

Colin CharlesJoin Percona Chief Evangelist Colin Charles as he covers happenings, gives pointers and provides musings on the open source database community.

I think the biggest news from Percona-land is that besides the tutorial grid, the schedule for day 1 and day 2 are live! Also notice the many “sub-themes”: a 101 track, using MySQL, MongoDB, cloud, MySQL database software, PostgreSQL, containers & automation, monitoring & ops, and misc. database stuff. Learn from 107 different experts (this number is likely to increase). So register now.

This coming week, Peter Zaitsev, Tom Basil, and I will be in New York. Some of us will be at the MariaDB 2018 Developers Unconference, and all of us will be attending M|18. We have a schedule for the Developers Unconference, and I hope you find time on Sunday to join us as I present MySQL features missing in MariaDB  between 12:15-13:00. Being an unconference, it shouldn’t just be a presentation, but also active discussion. I recall during the FOSDEM MySQL DevRoom, MariaDB Foundation developer Vicentiu Ciorbaru assigned to himself support for the super readonly feature (see tweet).

If you have thoughts of what you like in MySQL but are missing from MariaDB Server, please don’t hesitate to tweet at me @bytebot, or even drop me an email: colin.charles@percona.com. I will happily change and add to the slides until Sunday morning, Eastern Standard Time.

Why is this important? Quite simply, take a look at Todd Farmer’s blog post: Bitten by MariaDB 10.2 Incompatible Change. Here’s Cloudera Manager failing, on specific minor versions of software since the behavior changed (so this particular issue occurs in 10.2.8+ but not before!). I’d definitely spend some time reading the comments as well as the associated Jira. Maybe with 10.3/10.4, it’s time to stop calling it a “drop-in replacement” (an initial goal when I worked on MariaDB Server), and just call it something else. Maybe something for the new Chief Marketing Officer to think about?

Releases

Link List

Upcoming appearances

  • SCALE16x – Pasadena, California, USA – March 8-11 2018
  • FOSSASIA 2018 – Singapore – March 22-25 2018

Feedback

I look forward to feedback/tips via e-mail at colin.charles@percona.com or on Twitter @bytebot.

Webinar Tuesday February 27, 2018: Monitoring Amazon RDS with Percona Monitoring and Management (PMM)

$
0
0
Monitoring Amazon RDS

Monitoring Amazon RDSPlease join Percona’s Build / Release Engineer, Mykola Marzhan, as he presents Monitoring Amazon RDS with Percona Monitoring and Management on February 27, 2018, at 7:00 am PDT (UTC-8) / 10:00 am EDT (UTC-5).


Are you concerned about how you are monitoring your AWS environment? Keeping track of what is happening in your Amazon RDS deployment is key to guaranteeing the performance and availability of your database for your critical applications and services.

Did you know that Percona Monitoring and Management (PMM) ships with support for MySQL on Amazon RDS and Amazon Aurora out of the box? It does!

Percona Monitoring and Management (PMM) is a free and open-source platform for managing and monitoring MySQL, Percona Server for MySQL MariaDB, MongoDB, Percona Server for MongoDB performance both on-premise and in the cloud.

In this session we’ll discuss:

  • Configuring PMM (metrics and queries) against Amazon RDS MySQL and Amazon Aurora using an EC2 instance
  • Configuring PMM against CloudWatch metrics
  • Setting configuration parameters for AWS for maximum PMM visibility

Register for the webinar now.

mykolaMykola Marzhan, Release Engineer

Mykola joined Percona in 2016 as a release engineer. He has been developing monitoring systems since 2004, and has been working as Release Engineer/Release Manager/DevOps for ten years. Recently, Mykola achieved an AWS Certified Solutions Architect (Professional) authentication.


MariaDB Server 10.3 Release Candidate Now Available

$
0
0
MariaDB Server 10.3 Release Candidate Now Available RalfGebhardt Mon, 02/26/2018 - 10:07

Today, we are releasing MariaDB Server 10.3.5, which is our first Release Candidate for 10.3.

Now feature complete, our user and customer base can move from reviewing and testing new features to integrating MariaDB Server into their staging environment to prove it against existing applications and to enhance their applications with new use cases provided through the abundance of new and exciting features in MariaDB Server, like temporal data processing. Another strong focus of this version is database compatibility where we have added several new features. With MariaDB Server 10.3, it’s even easier to migrate from legacy database systems to open source MariaDB.

Try MariaDB Server 10.3.5 Release Candidate! There are significant features to test out in MariaDB Server 10.3, including:

  • Temporal Data Processing

  • Database Compatibility Enhancements

    • PL/SQL Compatibility for MariaDB Stored Functions: The server now understands a subset of Oracle's PL/SQL language instead of the traditional MariaDB syntax for stored routines

    • Packages for Stored Functions:  Grouping logically related stored functions, variables, cursors or subprogram

    • New option for CURSOR in stored routines: A CURSOR can now have parameters used by the associated query

    • New data types for stored routines: ROW data type, TYPE OF and ROW TYPE OF anchored data types

    • Generation of unique primary keys by SEQUENCES: As an alternative to AUTO INCREMENT It is now possible to define names sequence objects to create a sequence of numeric values

    • Operations over result sets with INTERSECT and EXCEPT: In addition to the already existing UNION an intersection and subtraction of result sets is now possible

    • Invisible Columns: Columns can now can be defined to be invisible.

    • Window Function Enhancement: percentile and median window functions have been added

  • User Flexibility

    • User Defined Aggregate Functions: In addition to creating SQL functions it is now also possible to create aggregate functions

    • Lifted limitations for updates and deletes: A DELETE statement can now delete from a table used in the WHERE clause. UPDATE can be the same for source and target

  • Performance/Storage Enhancements

  • Storage Engine Enhancements

    • Spider Storage Engine: The partitioning storage engine has been updated to the newest release of the Spider Storage engine to support new Spider features including direct join support, direct update and delete, direct aggregates

  • Proxy Layer Support for MariaDB Server: Client / Server authentication via a Proxy like MariaDB MaxScale using a Server Proxy Protocol Support

Download MariaDB Server 10.3 RC

Read MariaDB Server 10.3 Release Notes

Today, we are releasing MariaDB Server 10.3.5, which is our first Release Candidate for 10.3.

Login or Register to post comments

MariaDB 10.3.5 and MariaDB Connector/J 2.2.2 and 1.7.2 now available

$
0
0

The MariaDB project is pleased to announce the availability of MariaDB 10.3.5, the first release candidate in the MariaDB 10.3 series, as well as MariaDB Connector/J 2.2.2, the latest stable release in the MariaDB Connector/J 2.2 series, and MariaDB Connector/J 1.7.2, the latest stable release in the MariaDB Connector/J 1.7 series. See the release notes […]

The post MariaDB 10.3.5 and MariaDB Connector/J 2.2.2 and 1.7.2 now available appeared first on MariaDB.org.

MySQL Connector/C++ 8.0.7-rc has been released

$
0
0

Dear MySQL users,

MySQL Connector/C++ 8.0.7-rc is the release candidate (RC)
of the MySQL Connector/C++ 8.0 series.

Connector/C++ 8.0 can be used to access MySQL implementing Document
Store or in a traditional way, using SQL queries. It allows writing
both C++ applications using X DevAPI or plain C applications using
XAPI.

To learn more about how to write applications using X DevAPI, see
“X DevAPI User Guide”

https://dev.mysql.com/doc/x-devapi-userguide/en/

and “X DevAPI Reference” at

https://dev.mysql.com/doc/dev/connector-cpp/devapi_ref.html

For more information about using plain C XAPI see “XAPI Reference” at

https://dev.mysql.com/doc/dev/connector-cpp/xapi_ref.html

For generic information on using Connector/C++ 8.0, see

https://dev.mysql.com/doc/dev/connector-cpp/

Note

Connector/C++ 8.0 requires MySQL Server version 8.0 or higher with
X Plugin enabled. For general documentation about how to get started
using MySQL as a document store, see “Using MySQL as a Document Store”

https://dev.mysql.com/doc/refman/5.7/en/document-store.html

To download MySQL Connector/C++ 8.0.7-rc, see the “Development Releases”
tab at

https://dev.mysql.com/downloads/connector/cpp/


Changes in MySQL Connector/C++ 8.0.7 (2018-02-26, Release
Candidate)

In addition to the new APIs introduced in MySQL Connector/C++
8.0 (X DevAPI and XAPI), Connector/C++ now also supports the
legacy API based on JDBC4. Applications written against the
JDBC4-based API of Connector/C++ 1.1 can be also compiled
with Connector/C++ 8.0, which is backward compatible with the
earlier version. Such code does not require the X Plugin and
can communicate with older versions of the MySQL Server using
the legacy protocol. This contrasts with X DevAPI and XAPI
applications, which expect MySQL Server 8.0.

The legacy API is implemented as a separate library with base
name mysqlcppconn as opposed to mysqlcppconn8 library
implementing the new APIs. For information about using the
legacy API, refer to the documentation at
http://dev.mysql.com/doc/connector-cpp/en/connector-cpp-getting-started-examples.html.

* Deprecation and Removal Notes

* Security Notes

* X DevAPI and XAPI Notes

* Functionality Added or Changed

* Bugs Fixed

Deprecation and Removal Notes

* View and table DDL methods have been removed. It is
preferable that SQL statements be used for such
operations.
Removed X DevAPI methods:
Schema.createView()
Schema.alterView()
Schema.dropView()
Schema.dropTable()

Removed X DevAPI data types:
Algorithm
CheckOption
SQLSecurity

Removed XAPI functions:
mysqlx_view_create
mysqlx_view_create_new
mysqlx_view_modify
mysqlx_view_modify_new
mysqlx_view_replace
mysqlx_view_replace_new
mysqlx_view_drop
mysqlx_table_drop
mysqlx_set_view_algorithm
mysqlx_set_view_security
mysqlx_set_view_definer
mysqlx_set_view_check_option
mysqlx_set_view_columns

Removed XAPI enumerations:
mysqlx_view_algorithm_t
mysqlx_view_security_t
mysqlx_view_check_option_t

Removed XAPI macros:
VIEW_ALGORITHM()
VIEW_SECURITY()
VIEW_DEFINER()
VIEW_CHECK_OPTION()
VIEW_COLUMNS()
VIEW_OPTION_XXX

Security Notes

* MySQL Connector/C++ now supports the
caching_sha2_password authentication plugin introduced in
MySQL 8.0 (see Caching SHA-2 Pluggable Authentication
(http://dev.mysql.com/doc/refman/8.0/en/caching-sha2-pluggable-authentication.html)),
with these limitations:

+ For applications that use X DevAPI or XAPI, only
encrypted (SSL) connections can be used to connect
to cached_sha2_password accounts. For non-SSL
connections, it is not possible to use
cached_sha2_password accounts.

+ For applications that use the legacy protocol, it is
not possible to make connections to
cached_sha2_password accounts in the following
scenario:
o The connection is unencrypted (OPT_SSL_MODE is
set to SSL_MODE_DISABLED).
o The server public key is given using the
"rsaKey" option and no RSA key exchange is used
(OPT_GET_SERVER_PUBLIC_KEY is set to false).
If RSA key exchange is enabled, the connection
works.

X DevAPI and XAPI Notes

* It is now possible to use the Collection interface to
create and drop indexes on document collections.
X DevAPI example:
coll.createIndex("idx",
R"({
"fields": [
{ "field": "$.zip", "type": "TEXT(10)" },
{ "field": "$.count", "type": "INT UNSIGNED" }
]
})"
);

coll.createIndex("loc",
R"({
"type": "SPATIAL",
"fields": [ { "field": "$.coords", "type": "GEOJSON", "srid": 3128
7 } ]
})"
);

coll.dropIndex("idx");

XAPI example:
ret = mysqlx_collection_create_index(coll, "idx",
R"({
"fields": [
{ "field": "$.zip", "type": "TEXT(10)" },
{ "field": "$.count", "type": "INT UNSIGNED" }
]
})"
)

ret = mysqlx_collecton_create_index(coll, "loc",
R"({
"type": "SPATIAL",
"fields": [ { "field": "$.coords", "type": "GEOJSON", "srid": 3128
7 } ]
})"
);

mysqlx_collection_drop_index(coll, "idx");


* It is now possible to use the Session interface to create
savepoints inside transactions and roll back a
transaction to a given savepoint. This interface supports
the operations provided by the SAVEPOINT, ROLLBACK TO
SAVEPOINT, and RELEASE SAVEPOINT statements. For more
information about these statements, see SAVEPOINT,
ROLLBACK TO SAVEPOINT, and RELEASE SAVEPOINT Syntax
(http://dev.mysql.com/doc/refman/8.0/en/savepoint.html).
X DevAPI example:
sess.startTransaction();
string point1 = sess.setSavepoint();
sess.setSavepoint("point2");
sess.rollbackTo(point1);         // this also removes savepoint "point
2"
string point3 = sess.setSavepoint();
sess.releaseSavepoint(point3);  // explicitly remove savepoint
sess.commitTransaction();

XAPI example:
mysqlx_trasaction_begin(sess);
const char *point1 = mysqlx_savepoint_set(sess,NULL);
mysqlx_savepoint_set(sess,"point2");
mysqlx_rollback_to(sess,point1);
const char *point3 = mysqlx_savepoint_set(sess,NULL);
mysqlx_sevepoint_release(sess,point3);
mysqlx_transaction_commit(sess);

Functionality Added or Changed

* MySQL Connector/C++ now implements TLS connections using
the OpenSSL library. It is possible to build
Connector/C++ with OpenSSL or the bundled yaSSL
implementation of TLS. This is controlled by the WITH_SSL
CMake option, which takes these values: bundled (build
using bundled yaSSL code); system (build using system
OpenSSL library, with the location as detected by CMake);
path_name (build using OpenSSL library installed at the
named location). For more information, see
http://dev.mysql.com/doc/dev/connector-cpp/8.0/building.html

Bugs Fixed

* replaceOne() and similar methods did not correctly detect
document ID mismatches. (Bug #27246854)

* Calling bind() twice on the same parameter for complex
types resulted in empty values. (Bug #26962725)

On Behalf of the MySQL/Oracle Release Engineering Team,
Daniel Horecki

Percona XtraDB Cluster 5.6.39-26.25 Is Now Available

$
0
0
Percona XtraDB Cluster 5.7

Percona XtraDB Cluster 5.6Percona announces the release of Percona XtraDB Cluster 5.6.39-26.25 (PXC) on February 26, 2018. Binaries are available from the downloads section or our software repositories.

Percona XtraDB Cluster 5.6.39-26.25 is now the current release, based on the following:

Starting from this release, Percona XtraDB Cluster issue tracking system was moved from launchpad to JIRA. All Percona software is open-source and free.

Fixed Bugs

  • PXC-904: Replication filters were not working with account management statements like CREATE USER in case of Galera replication; as a result, such commands were blocked by the replication filters on async slave nodes but not on Galera ones.
  • PXC-2043: SST script was trying to use pv (the pipe viewer) for progress and rlimit options even on nodes with no pv installed, resulting in SST fail instead of just ignoring these options for inappropriate nodes.
  • PXC-911: When node’s own IP address was defined in the wsrep_cluster_address variable, the node was receiving “no messages seen in” warnings from its own IP address in the info log.

This release also contains fixes for the following CVE issues: CVE-2018-2562, CVE-2018-2573, CVE-2018-2583, CVE-2018-2590, CVE-2018-2591, CVE-2018-2612, CVE-2018-2622, CVE-2018-2640, CVE-2018-2645, CVE-2018-2647, CVE-2018-2665, CVE-2018-2668, CVE-2018-2696, CVE-2018-2703, CVE-2017-3737.

Help us improve our software quality by reporting any bugs you encounter using our bug tracking system. As always, thanks for your continued support of Percona!

Write Optimizations for Qualcomm Centriq 2400 in MariaDB 10.3.5 Release Candidate

$
0
0
Write Optimizations for Qualcomm Centriq 2400 in MariaDB 10.3.5 Release Candidate david_thompson_g Mon, 02/26/2018 - 22:27

MariaDB has been collaborating with Qualcomm Datacenter Technologies in pushing the performance envelop by leveraging innovative ARM-based hardware architecture with MariaDB’s unique database architecture.  As part of the Qualcomm Centriq™ 2400 product launch back in Nov 2017,  we demonstrated the strong read scalability of MariaDB on this chip.  Since then, MariaDB and Qualcomm engineering have been working to improve the scalability of write operations which we would like to share with the developer community today.

We are pleased to announce a number of performance improvements that are being made available in the recently shipped 10.3 release candidate 10.3.4.  By leveraging the highly parallelized 48-core Qualcomm Centriq 2400 processor running at 2.6GHz with 6 memory channels in a fully coherent ring architecture, our interest is to extract write performance optimization in a single row write use case for a highly threaded application. 

MariaDB uses the sysbench benchmark software to measure performance.  In this blog, we'll examine the following 2 benchmarks using sysbench 1.0:

  • Oltp_update_index : This simulates updating a single row value by primary key index where a secondary index must be updated as a result of the update.
  • Oltp_update_nonindex: This simulates updating a single row value by primary key index where there is no secondary index. This obviously requires less work than oltp_update_index.

What we see is that as the number of concurrent threads increase, the performance is up to 48% faster in 10.3 than 10.2 on the Centriq™ 2400:

chart.png


chart (1).png

The improvements made remove points of contention and optimize for the ARM64 chipset, specifically:

  • MDEV-15090 : Reduce the overhead of writing undo log records
  • MDEV-15132 : Avoid accessing the TRX_SYS page
  • MDEV-15019 : InnoDB: store ReadView on trx
  • MDEV-14756 : Remove trx_sys_t::rw_trx_list
  • MDEV-14482 : Cache line contention on ut_rnd_ulint_counter()
  • MDEV-15158 : On commit, do not write to the TRX_SYS page
  • MDEV-15104 : Remove trx_sys_t::rw_trx_ids and trx_sys_t::serialisation_list
  • MDEV-14638 : Replace trx_sys_t::rw_trx_set with LF_HASH
  • MDEV-14529 : InnoDB rw-locks: optimize memory barriers
  • MDEV-14374 : UT_DELAY code : Removing hardware barrier for arm64 bit platform
  • MDEV-14505 : Threads_running becomes scalability bottleneck

In summary what this means is that MariaDB will perform significantly better under high levels of concurrent updates improving response times in your applications at peak load.

The improvements will also provide benefits to other chip architectures but a much greater gain is seen on the Centriq™ 2400 due to its design capable of supporting much high thread count. By utilizing physical cores vs hyper-threading a lower number of cores the  Centriq™ 2400 demonstrates an additional 13% gain over a comparable reference Broadwell platform.

As Centriq™ 2400 systems come to market this year we are excited to see customer workloads taking advantage of the scalability combined with lower power consumption to run high scale database workloads.
 

MariaDB has been collaborating with Qualcomm Datacenter Technologies in pushing the performance envelop by leveraging innovative ARM-based hardware architecture with MariaDB’s unique database architecture.  As part of the Qualcomm Centriq™ 2400 product launch back in Nov 2017,  we demonstrated the strong read scalability of MariaDB on this chip.  Since then, MariaDB and Qualcomm engineering have been working to improve the scalability of write operations which we would like to share with the developer community today.

Login or Register to post comments

MySQL Single Table Point-In-Time Recovery

$
0
0
Point-In-Time Recovery

Point-In-Time RecoveryIn this blog post, I’ll look at how to execute a MySQL single table Point-In-Time Recovery.

I recently wrote a blog post describing a different way of doing Point-In-Time Recovery (PITR). If you want to know the step by step, please visit the mentioned blog post. Here is a quick summary of the approach:

  1. Restore the backup on the desired server
  2. Create a fake master
  3. Copy all relevant binlogs to the fake master
  4. Configure server from the first step as a slave from a fake master

In addition to the above steps, there is a similar approach that eliminates the usage of a fake master (check here). Both approaches allow us (among other things) to:

  • Resume the restore after a possible failure
  • Speed up restore using parallel replication

Furthermore, another benefit is that it allows us to selective restore events for a particular table (or tables). You can achieve this by adding replication filters on your slave server (replicate-do-db / replicate-wild-do-table / MySQL 5.7+ CHANGE REPLICATION FILTER).

As an example, if we only want to replay events from the world.city table, we can restore either the full backup or do a selective restore as described here. Edit my .cnf as follows:

[mysqld]
. . .
replicate-wild-do-table=world.city

From this point forward, we can start replication and only the events from the desired table are applied. There are a few caveats using replication filter, and they will vary depending on your binlog_format, make sure you understand them as described here.

Summary

While mysqlbinlog allows you to only filter out events on a per-database basis, you can easily configure replication filters to do a single table point-in-time recovery.

Keynote Highlights from MariaDB’s M|18 User Conference

$
0
0
Keynote Highlights from MariaDB’s M|18 User Conference MariaDB Team Mon, 02/26/2018 - 18:34

M|18, the second annual MariaDB user conference, is in full swing, with more than 330 companies represented. The action kicked off today with a trio of live-streamed keynotes with themes ranging from the power of change and community to truly massive scale and future-ready technology. Take a look at the highlights:


Dare to Be Different

Michael Howard | MariaDB

MariaDB’s CEO opened the show with the idea of global community as an agent of change – creating momentum, helping solve hard problems and making the future better. 

MichaelHoward.png

Howard touched on MariaDB’s aim to make it easier for global enterprises to change and migrate, and announced the release candidate of MariaDB 10.3, which offers Oracle compatibility and more to ensure portability in terms of skill sets, not just code

Howard recognized that community is a vital part of continual innovation, and the role that MariaDB partners such as Google, Facebook, Intel, ServiceNow and the Development Bank of Singapore are playing in MariaDB’s growth. He highlighted MariaDB’s focus for the future, including:

  • MariaDB cloud and DBaaS offering. The first product to support this endeavor is MariaDB Manager—a visual interface allowing management and deployment of MariaDB. 
  • MariaDB Labs, a new research division that brings together three key concepts: 
    • Machine learning to intelligently determine your needs for storage, compute power and more.
    • Distributed computing with seamless write scalability.
    • Use of new chips, persistent storage, and in-memory processing, thanks to work with Intel. Howard envisions this recharging the conversation with regard to price point on public and private clouds. 


Massive Scale with MariaDB

Tim Yim | ServiceNow

85,000 databases around the world. Inside those, 176 million InnoDB tables, accessed at rate of 25 billion queries per hour. That’s the scale of ServiceNow’s business with MariaDB.

Is this infrastructure multi-tenant or single-tenant? Neither! ServiceNow works with a new deployment model, “multi-instance deployment,” where each customer gets its own database and its own front-end app tier; there’s no commingling of data at all. This allows for “surgical failover” and scaling – one customer at a time.

Every customer instance is running on bare metal, with hardware shared across the app tier and the database tier, but processes are “containerized.” Every piece of gear is also duplicated across the country, as is every customer app node and database. And each one of those is backed up nightly. That’s a lot going on! How did they achieve this?

ServiceNow2.png

All of the server instances to power this system are on MariaDB, and ServiceNow aims for five 9s availability – with hospitals, factories and power stations among ServiceNow’s clients, high availability is critical. But it’s more than that; the stability they get from MariaDB TX is also vital. 


Corporate Banking and Future-Ready Technology

Ng Peng Khim and Joan Tay | Development Bank of Singapore (DBS Bank)

Khim and Tay covered the impressive results of DBS Bank’s journey in “forklifting out” Oracle Enterprise, and replacing their institutional, transaction environments with MariaDB. 

DBSBank.png

By moving to MariaDB, DBS Bank has realized a net savings of $4.1 million from replatforming by removing the need for DB2 and Oracle Enterprise. Here’s a rundown of the impressive achievements in just two years:

  • 700+ MariaDB instances put in place
  • 54% of critical applications running on MariaDB – $70-80 billion in transactions daily
  • 100% increase in automated app releases
  • 10x increase in testing capabilities
  • 7x performance improvement from moving PL/SQL capability from Oracle to MariaDB

In addition, MaxScale, MariaDB’s advanced database proxy, allows DBS Bank to do quick schema changes to handle master/slave data replication, then do live verification—reducing downtime significantly.


Keep up with all the M|18 action! Follow #MARIADBM18 on Twitter.
 

M|18, the second annual MariaDB user conference, kicked off today with a trio of live-streamed keynotes with themes ranging from the power of change and community to truly massive scale and future-ready technology. Take a look at the highlights.

Login or Register to post comments


How to safely upgrade to MySQL 8.0 ?

$
0
0

As for each previous version, to upgrade to MySQL 8.0 you must first read the upgrade section in the manual. It’s important to know that you should upgrade without skipping a major version, so upgrade from 5.6 to 8.0 is not supported neither recommended.

Please also note that upgrades from any MySQL 8.0 RC won’t work. We support upgrade process only from GA versions.

Then one of the most important section to be aware of, is the incompatibility changes brought with the new version.

Once you have read the upgrade section in the manual and the release note of the version you want to install, with MySQL 8.0 and its new MySQL Shell, we developed an utility that will perform the checks to verify if your dataset and current configuration are compatible with the new MySQL 8.0.

Let’s try it !

In this example we have MySQL 5.7.21 running, the following packages are installed:

[root@mysql2 ~]# rpm -qa | grep mysql
mysql57-community-release-el7-11.noarch
mysql-community-client-5.7.21-1.el7.x86_64
mysql-community-devel-5.7.21-1.el7.x86_64
mysql-community-libs-5.7.21-1.el7.x86_64
mysql-community-server-5.7.21-1.el7.x86_64
mysql-community-common-5.7.21-1.el7.x86_64
mysql-community-libs-compat-5.7.21-1.el7.x86_64

Nothing special… now my first step (after having read the manual of course 😉 ) is to download and install the new MySQL Shell 8.0.x:

[root@mysql2 ~]# rpm -ivh mysql-shell-8.0.4-0.1.rc.el7.x86_64.rpm

Now we can run the Shell and connect to our server:We are connected to our MySQL 5.7.21 and now we will use the util global object to verify if we can upgrade to 8.0.4 RC. For your information, MySQL Shell provides 5 global objects:

===== Global Objects =====
dba        Enables you to administer InnoDB clusters using the AdminAPI.
mysql      Used to work with classic MySQL sessions using SQL.
mysqlx     Used to work with X Protocol sessions using the MySQL X DevAPI.
shell      Gives access to general purpose functions and properties.
sys        Gives access to system specific parameters.
util       Global object that groups miscellaneous tools like upgrade checker.

So let’s use the util one:

OK, as we can see we have a problem with one table still using utf8mb3, which might be common in 5.7. This is not a fatal error and the charset will be converted to utf8 automatically during the upgrade process.

The upgrade on itself is easy, on this example, I’m still using rpms and the yum repository associated to my distro:

[root@mysql2 ~]# yum update --enablerepo=mysql80-community mysql-community-server

Et voilà ! Upgrade done successfully, don’t forget to run mysqld_upgrade 😉

Conclusion

When you plan to upgrade to MySQL 8.0, please read the related sections in the manual, read the release notes and since 8.0.4RC, use the MySQL Shell to verify that your upgrade is possible.

How To Buy Software 2018

$
0
0

Buying software solutions for your company is a skill just like any other business practice. To be effective at purchasing it is necessary to have a clear understanding of what you require and a plan on how to evaluate potential vendors. When time is also a factor a working knowledge of the internal buying processes and expectations of your employer are also important.

The wide variety of similar sounding products with hard to distinguish feature differentiators can be daunting. In order to get the right software at a competitive price within the desired timeframe there are 4 important things to consider.

Here’s the short list:

  • Define requirements by focusing on needs instead of features
  • Prepare your budget, know your buying process
  • Check provider quality and support
  • Make the most of your trial period


And here’s the longer one:

Understand Your Needs

Effective software purchasing starts with clearly defining your key needs. What are you trying to accomplish by acquiring the software and why? What event is driving you to make this acquisition and when are you hoping to have a solution in place?

Having answers to these questions will help focus your search and make it easier for vendors to understand if they are a match for your requirements. Many products have superficial similarities but take different approaches to solving a problem. Being clear and direct about your use case means a vendor can do a better job of explaining the exact way they can be of benefit. You will get better feedback to use in comparing competitors.

While it is beneficial to take time detailing the key requirements that your software must provide to meet your business goals, focusing narrowly on specific features can be counterproductive. Narrowing your focus to these needs will limit your evaluation to solutions that keep you  distracted with impressive looking side-features that sound nicer than they perform. Focus on the problem first and let a vendor show you how they have created a solution for it.

Finally don’t get distracted by secondary features or product roadmaps. While additional features might be nice they are never as important as making sure your core requirements are met. Future upgrades can also be tempting but buying software based on future promises often leads to disappointment.

Establish an Informed Budget

Value is relative; this is never more true than when buying software. If you have no burning problem to solve then the temptation may be to go with a very cheap or “free” open source solution. The reality is that no software is ever free; there are always costs involved in maintaining and using it. The most important consideration is how effective the software will be in solving or preventing your core problem. Is this software mission critical? Consider the costs you incur if an issue goes undiscovered or remains unfixable for a period of time; that should set a baseline for what you budget for a solution. Software can also have an impact on your bottom line by allowing you to use resources more efficiently and saving you money on hardware or services.

It is important to consider how your organization buys software before you begin your search. What are the budget limits? Who can grant approval at different levels of budget spend? Are there other parts of the organization who should be brought into an evaluation in order to increase the budget pool? Other procedural considerations like the need for NDA’s, security reviews or the involvement of a procurement team can call impact the timeline to acquire software. The more you know about your internal processes the better a vendor can work with you to make sure your project is delivered on time and within budget.

Ensure the Software is Well Supported

When looking at a piece of software that’s new to you, it’s a smart idea to look into the company who developed it.

Do they have a good reputation? Have they been in business long? Do they keep their products updated and well supported? These are all things you should investigate to be certain that the software you pick will perform capably, and if you run into trouble when using it you’ll be able to access the help you need.

Reading through customer reviews is a great way to get an impression of a company’s credibility and the quality of software they provide. If the vendor offers free support during a trial process, try it out. Ping the support team with a question about product usage or any feature ideas you have. If they are truly interested in being a good partner to their customers you will find that they offer a high level of support at all stages of the buying process.

VividCortex offers support for usage questions as well as technical issues. Our goal is to deliver an answer during business hours within 5 minutes of any question being asked email or Intercom chat built into the product. We also offer a premium tier license that includes 24/7 support at that same great level of attention.

Trial the Software Before Purchase

Many software vendors offer free trials for customers to see the performance of their product for themselves. These are excellent opportunities to test drive the software you’re considering before making any commitments.

Once you find a piece of software that appeals to you ask for a free a trial and try it in your environment. That way you’ll be able to rest assured that the software meets your business needs, functions properly and integrates well with your systems—or you’ll discover any issues before it becomes too late.

A common mistake is going into a trial unprepared or without sufficient time allocated to do a meaningful evaluation. Make a plan as to what team members will be involved in the evaluation and what everyone’s tasks and goals are. Don’t wait until the last day of the trial to login and review data; you will waste a great opportunity to gain more insight about a product you may purchase as well as insight about your own problems.

VividCortex does offers a free trial; the signup page can be found here: https://app.vividcortex.com/sign-up


In Conclusion

Purchasing the right software is critical to the health of a technology based organization. The right approach matters and preparation counts. The best way to ensure you get what you need at a price you can afford is to be open and honest about your priorities and budget.

If the solution you pick fails to meet expectation, then working with lackluster tools will become irritating fast. Even worse, switching software solutions once your business gets going is a costly and painful process that’s made harder by the knowledge it all could have been easily avoided in the first place.

Conducting strong research is the best defense against these problems, so be thorough when following the advice above, consider all your options carefully, and you’ll be sure to end up with software that’s perfect for you.


Catching Slow and Frequent Queries with ProxySQL

$
0
0
Slow and Frequent Queries with ProxySQL

Slow and Frequent Queries with ProxySQLIn this blog post,  I’ll look at how to catch slow and frequent queries with ProxySQL.

More and more people are using ProxySQL because it is a great tool and it can help DBAs a lot. But many people do not realize that it is more powerful than it looks. It has many features and possibilities. I am going to show you one of my favorite “tricks” / use cases.

There are plenty of blog posts explaining how ProxySQL works. I am not going to that again. Instead, let’s jump straight to the point. There is a table in ProxySQL called “stats.stats_mysql_query_digest”. It is one of my favorite tables because it basically records all the queries that were running against ProxySQL. Without collecting any queries on the MySQL server, I can find bad queries and much useful information just running a single select on ProxySQL.

Let’s see what the table looks like:

CREATE TABLE stats_mysql_query_digest (
hostgroup INT,
schemaname VARCHAR NOT NULL,
username VARCHAR NOT NULL,
digest VARCHAR NOT NULL,
digest_text VARCHAR NOT NULL,
count_star INTEGER NOT NULL,
first_seen INTEGER NOT NULL,
last_seen INTEGER NOT NULL,
sum_time INTEGER NOT NULL,
min_time INTEGER NOT NULL,
max_time INTEGER NOT NULL,
PRIMARY KEY(hostgroup, schemaname, username, digest))

What these fields are (copy/paste from the ProxySQL manual):

  • hostgroup – the hostgroup to which the query was sent. A value of -1 represent a query hitting the Query Cache
  • schemaname – the schema that is currently being queried
  • username – the username with which the MySQL client connected to ProxySQL
  • digest – a hexadecimal hash that uniquely represents a query with its parameters stripped
  • digest_text – the actual text with its parameters stripped
  • count_star – the total number of times the query has been executed (with different values for the parameters)
  • first_seen – Unix timestamp, the first moment when the query was routed through the proxy
  • last_seen – Unix timestamp, the last moment (so far) when the query was routed through the proxy
  • sum_time – the total time in microseconds spent executing queries of this type. This is particularly useful to figure out where the most time is spent in your application’s workload, and provides a good starting point for where to improve
  • min_time, max_time – the range of durations to expect when executing such a query. min_time is the minimal execution time seen so far, while max_time represents the maximal execution time, both in microseconds.

What can we see here?

We can easily tell which queries are running the most:

select hostgroup,username,count_star,
(count_star/(select Variable_Value from stats_mysql_global where Variable_Name='ProxySQL_Uptime')
)
as avg_per_sec, digest_text from stats_mysql_query_digest order by count_star desc limit 10;

The numbers are from a production server, but of course I can’t share the real queries. I just replaced them.

+-----------+----------+------------+-------------+---------------+
| hostgroup | username | count_star | avg_per_sec | digest_text   |
+-----------+----------+------------+-------------+---------------+
| 600       | dbuser   | 9043967    | 378         | SELECT Query1 |
| 600       | dbuser   | 4883013    | 204         | SELECT Query2 |
| 600       | dbuser   | 4398650    | 184         | UPDATE Query1 |
| 600       | dbuser   | 3842132    | 160         | SELECT Query3 |
| 600       | dbuser   | 2672437    | 111         | SELECT Query4 |
| 600       | dbuser   | 2564980    | 107         | UPDATE query2 |
| 600       | dbuser   | 1925037    | 80          | SELECT Query5 |
| 600       | dbuser   | 1841126    | 77          | SELECT Query6 |
| 600       | dbuser   | 1201574    | 50          | SET NAMES     |
| 600       | dbuser   | 1118819    | 46          | SELECT Query7 |
+-----------+----------+------------+-------------+---------------+

Why is this useful? You can make sure to optimize those queries well, as they are ones running most often. They could have a huge impact on general performance. You can see if a query is running hundreds or thousands times per second, maybe it is a good candidate for caching. Don’t forget ProxySQL also has a Query Cache.

You can even collect these metrics and graph your query distribution. You could see if an individual query is running more than usual or if you deploy a new app or release, you can see the query number changes.

Another use case: imagine that you have a customer, he says the MySQL server is very slow and running a query takes a long time, etc.

If the customer does not have a proper monitoring tool or the slow query log enabled (if long_query_time=2 you already missed a lot of queries), you first have to start collecting queries and metrics from the server.

But if the customer has ProxySQL, we have a field called “sum_time” which basically tells us how long it took a query from the application point of view, which is great.

I can just run the following query (queries that ran more than 100 times):

select count_star,sum_time,(sum_time/count_star)/1000 as average_time_ms,digest_text
from stats_mysql_query_digest
where count_star > 100 order by average_time_ms desc limit 10;

+------------+-----------+-----------------+---------------+
| count_star | sum_time  | average_time_ms | digest_text   |
+------------+-----------+-----------------+---------------+
| 225        | 4794304   | 21              | DELETE Query1 |
| 14727      | 195710625 | 13              | SELECT Query1 |
| 120        | 995417    | 8               | SELECT Query2 |
| 2671       | 20229373  | 7               | SELECT Query3 |
| 834        | 5567940   | 6               | INSERT Query1 |
| 1392       | 6418971   | 4               | DELETE Query2 |
| 702        | 3469138   | 4               | SELECT Query4 |
| 291        | 1006448   | 3               | SELECT Query5 |
| 14727      | 45984601  | 3               | SELECT Query6 |
| 2051       | 7779500   | 3               | DELETE Query3 |
+------------+-----------+-----------------+---------------+

I can immediately tell which query took the most time on average since restarting ProxySQL. Or I can tell the customer there weren’t any slow queries at all.

Of course, we can filter on queries that were running in the last 10 minutes, or were running more than 1000 times, or on an individual query. The point is ProxySQL already collects all of this information, it would be a waste to not use them.

Can we reset the counters?

Yes, we can. Example resetting the stats in “stats_mysql_query_digest” table we have to run the following query:

SELECT * FROM stats_mysql_query_digest_reset LIMIT 1;

Running a query against “stats_mysql_query_digest_reset” table truncates all the statistics from “stats_mysql_query_digest_reset” table.

Conclusion

Don’t forget to use all the ProxySQL’s features. There are other useful tables like “stats_mysql_query_rules” as well.

Oracle Open World Call for Papers is open !

$
0
0

Today the call for participation for Oracle Open World 2018 has started.

The 2018’s edition will take place in San Francisco as usual, from October 22nd to 25th.

As every year, MySQL will be present and if you want to participate, we encourage you to submit a session. We encourage the submission on the following topics:

  • case studies / user stories of your use of MySQL
  • lessons learned in running web scale MySQL
  • Production DBA/DevOps perspectives into Architecture, Performance, Replication, InnoDB, Security, etc

The call for paper is open until March 22nd, don’t miss the chance to be part of this amazing event ! Submit now() !

Installation of MySQL

$
0
0
My favorite way of MySQL installation is to go with tar ball.

It is easy, simple and manageable.

There is also other thoughts people would think the tarball has many limitations and restrictions in terms of package dependency and functional incompatibility with the OS. 

If certain functions are not available in generic tarball but they are available in rpm or package bundle, tarball may not be the choice.

The platform to go for is for those with the package repository (yum or apt_get) support.  

Steps for installation  (This is only my way!!!)
1.   Remove any MySQL package from the OS  
      There is a chance the OS may come with packages of MySQL installation from community.   To make sure we have a clean environment, it is good to remove all of them.

2.   Using OS's package installer (yum / apt_get) to install the proper MySQL package with the same version.   This is to ensure that any other package dependency can be resolved easily and automatically.   
 
3.  Remove the MySQL package but not any dependency packages.  This clean up MySQL installation and the OS has no more MySQL binary.

4.  Untar the tarball to MySQL binary folder (e.g. export MYSQL_BINARY=/opt/mysql
       cd $MYSQL_BINARY; tar -zxvf  <tarball>   

5.  link the /usr/local/mysql   as the latest to the MYSQL_BINARY
    ln -s $MYSQL_BINARY/<mysql version binary>  /usr/local/mysql

6.  Change ownership for /usr/local/mysql and the $MYSQL_BINARY/<mysql version binary>

Within the $MYSQL_BINARY folder, it may  contain more than one version of MySQL binary.   If the system supports multiple version of MySQL, it is doable.

In some cases, testing of upgrade from version to version, more than one version of MySQL binary installations is required.  There is also chance to recover data from old data backup which may require old version of MySQL.


Viewing all 18786 articles
Browse latest View live


<script src="https://jsc.adskeeper.com/r/s/rssing.com.1596347.js" async> </script>