![MySQL Tools]()
In this blog post, I want to go over some of the day-to-day MySQL tools and methods DBAs use to analyze queries and visualize “what is going on?” I won’t be going into the nitty-gritty details of each of these tools, I just want to introduce you to them and show you what they look like so you will know what types of information they provide.
This isn’t a comprehensive list by any means but consider it a primer for those starting with MySQL and wanting to know what a query is going to do or is doing.
The two sides of query analysis are examining a query BEFORE you run it, and then analyzing what actually happened AFTER you run it.
Let’s start with the tools you can use to predict a query’s future.
In the beginning, there was EXPLAIN. The venerable EXPLAIN command has been with us a long time as a built-in MySQL utility statement. Its purpose is to explain that what the optimizer predicts is the best “plan”, and describe that to us. It tells us where data is gathered from, how it is filtered, and how it is combined or aggregated and much more:
> EXPLAIN SELECT CONCAT(customer.last_name, ', ', customer.first_name) AS customer,     address.phone, film.title     FROM rental INNER JOIN customer ON rental.customer_id = customer.customer_id     INNER JOIN address ON customer.address_id = address.address_id     INNER JOIN inventory ON rental.inventory_id = inventory.inventory_id     INNER JOIN film ON inventory.film_id = film.film_id     WHERE rental.return_date IS NULL     AND rental_date + INTERVAL film.rental_duration DAY < CURRENT_DATE()     LIMIT 5G
*************************** 1. row ***************************
           id: 1
  select_type: SIMPLE
        table: film
         type: ALL
possible_keys: PRIMARY
          key: NULL
      key_len: NULL
          ref: NULL
         rows: 1000
        Extra: NULL
*************************** 2. row ***************************
           id: 1
  select_type: SIMPLE
        table: inventory
         type: ref
possible_keys: PRIMARY,idx_fk_film_id
          key: idx_fk_film_id
      key_len: 2
          ref: sakila.film.film_id
         rows: 1
        Extra: Using index
*************************** 3. row ***************************
           id: 1
  select_type: SIMPLE
        table: rental
         type: ref
possible_keys: idx_fk_inventory_id,idx_fk_customer_id
          key: idx_fk_inventory_id
      key_len: 3
          ref: sakila.inventory.inventory_id
         rows: 1
        Extra: Using where
*************************** 4. row ***************************
           id: 1
  select_type: SIMPLE
        table: customer
         type: eq_ref
possible_keys: PRIMARY,idx_fk_address_id
          key: PRIMARY
      key_len: 2
          ref: sakila.rental.customer_id
         rows: 1
        Extra: NULL
*************************** 5. row ***************************
           id: 1
  select_type: SIMPLE
        table: address
         type: eq_ref
possible_keys: PRIMARY
          key: PRIMARY
      key_len: 2
          ref: sakila.customer.address_id
         rows: 1
        Extra: NULL
Looks a little cryptic though, doesn’t it? Other people thought so as well. Other MySQL tools were designed to help us get a better handle on what exactly the optimizer is planning to do.
Percona released pt-visual-explain to help us have a better representation:
JOIN
+- Bookmark lookup
|  +- Table
|  |  table          address
|  |  possible_keys  PRIMARY
|  +- Unique index lookup
|     key            address->PRIMARY
|     possible_keys  PRIMARY
|     key_len        2
|     ref            sakila.customer.address_id
|     rows           1
+- JOIN
   +- Bookmark lookup
   |  +- Table
   |  |  table          customer
   |  |  possible_keys  PRIMARY,idx_fk_address_id
   |  +- Unique index lookup
   |     key            customer->PRIMARY
   |     possible_keys  PRIMARY,idx_fk_address_id
   |     key_len        2
   |     ref            sakila.rental.customer_id
   |     rows           1
   +- JOIN
      +- Filter with WHERE
      |  +- Bookmark lookup
      |     +- Table
      |     |  table          rental
      |     |  possible_keys  idx_fk_inventory_id,idx_fk_customer_id
      |     +- Index lookup
      |        key            rental->idx_fk_inventory_id
      |        possible_keys  idx_fk_inventory_id,idx_fk_customer_id
      |        key_len        3
      |        ref            sakila.inventory.inventory_id
      |        rows           1
      +- JOIN
         +- Index lookup
         |  key            inventory->idx_fk_film_id
         |  possible_keys  PRIMARY,idx_fk_film_id
         |  key_len        2
         |  ref            sakila.film.film_id
         |  rows           1
         +- Table scan
            rows           1000
            +- Table
               table          film
               possible_keys  PRIMARY
The output is justified as such:
pt-visual-explain reverse-engineers MySQL’s EXPLAIN output into a query execution plan, which it then formats as a left-deep tree – the same way the plan is represented inside MySQL. It is possible to do this by hand, or to read EXPLAIN’s output directly, but it requires patience and expertise. Many people find a tree representation more understandable.
The folks that develop MySQL Workbench tried to give an actual visual explanation in their tool. It creates graphics of the predicted workflow, and changes the colors of different steps to highlight expensive parts of the query:
![]()
And finally, MySQL itself can output extended EXPLAIN information and always does so if you use the JSON output format (introduced in MySQL 5.6):
> EXPLAIN format=JSON SELECT CONCAT(customer.last_name, ', ', customer.first_name) AS customer,     address.phone, film.title     FROM rental INNER JOIN customer ON rental.customer_id = customer.customer_id     INNER JOIN address ON customer.address_id = address.address_id     INNER JOIN inventory ON rental.inventory_id = inventory.inventory_id     INNER JOIN film ON inventory.film_id = film.film_id     WHERE rental.return_date IS NULL     AND rental_date + INTERVAL film.rental_duration DAY < CURRENT_DATE()     LIMIT 5G
*************************** 1. row ***************************
EXPLAIN: {
  "query_block": {
    "select_id": 1,
    "nested_loop": [
      {
        "table": {
          "table_name": "film",
          "access_type": "ALL",
          "possible_keys": [
            "PRIMARY"
          ],
          "rows": 1000,
          "filtered": 100
        }
      },
      {
        "table": {
          "table_name": "inventory",
          "access_type": "ref",
          "possible_keys": [
            "PRIMARY",
            "idx_fk_film_id"
          ],
          "key": "idx_fk_film_id",
          "used_key_parts": [
            "film_id"
          ],
          "key_length": "2",
          "ref": [
            "sakila.film.film_id"
          ],
          "rows": 1,
          "filtered": 100,
          "using_index": true
        }
      },
      {
        "table": {
          "table_name": "rental",
          "access_type": "ref",
          "possible_keys": [
            "idx_fk_inventory_id",
            "idx_fk_customer_id"
          ],
          "key": "idx_fk_inventory_id",
          "used_key_parts": [
            "inventory_id"
          ],
          "key_length": "3",
          "ref": [
            "sakila.inventory.inventory_id"
          ],
          "rows": 1,
          "filtered": 100,
          "attached_condition": "(isnull(`sakila`.`rental`.`return_date`) and ((`sakila`.`rental`.`rental_date` + interval `film`.`rental_duration` day) < <cache>(curdate())))"
        }
      },
      {
        "table": {
          "table_name": "customer",
          "access_type": "eq_ref",
          "possible_keys": [
            "PRIMARY",
            "idx_fk_address_id"
          ],
          "key": "PRIMARY",
          "used_key_parts": [
            "customer_id"
          ],
          "key_length": "2",
          "ref": [
            "sakila.rental.customer_id"
          ],
          "rows": 1,
          "filtered": 100
        }
      },
      {
        "table": {
          "table_name": "address",
          "access_type": "eq_ref",
          "possible_keys": [
            "PRIMARY"
          ],
          "key": "PRIMARY",
          "used_key_parts": [
            "address_id"
          ],
          "key_length": "2",
          "ref": [
            "sakila.customer.address_id"
          ],
          "rows": 1,
          "filtered": 100
        }
      }
    ]
  }
}
1 row in set, 1 warning (0.00 sec)
Don’t worry if EXPLAIN looks a little daunting. EXPLAIN can be hard to explain. Just know that it tells you what it thinks is going to happen and in what order. You can familiarize yourself with it as you go along.
Now let’s say you’ve executed your query and want to find out what actually happened. Or maybe you have a server that is running a lot of queries and you want to visualize what is going on with this server. It’s time to examine the tools we use to analyze AFTER running queries.
Similar to EXPLAIN, MySQL has tools built into it to help you understand what happened after a query was run. Query profiling tells us what the query spent its time doing. You can get a profile directly from the MySQL console:
> set profiling=1;
Query OK, 0 rows affected, 1 warning (0.00 sec)
> SELECT CONCAT(customer.last_name, ', ', customer.first_name) AS customer, address.phone, film.title FROM rental INNER JOIN customer ON rental.customer_id = customer.customer_id INNER JOIN address ON customer.address_id = address.address_id INNER JOIN inventory ON rental.inventory_id = inventory.inventory_id INNER JOIN film ON inventory.film_id = film.film_id WHERE rental.return_date IS NULL AND rental_date + INTERVAL film.rental_duration DAY < CURRENT_DATE() LIMIT 5;
+----------------+--------------+------------------+
| customer | phone | title |
+----------------+--------------+------------------+
| OLVERA, DWAYNE | 62127829280 | ACADEMY DINOSAUR |
| HUEY, BRANDON | 99883471275 | ACE GOLDFINGER |
| OWENS, CARMEN | 272234298332 | AFFAIR PREJUDICE |
| HANNON, SETH | 864392582257 | AFRICAN EGG |
| COLE, TRACY | 371490777743 | ALI FOREVER |
+----------------+--------------+------------------+
5 rows in set (0.00 sec)
> show profile;
+----------------------+----------+
| Status | Duration |
+----------------------+----------+
| starting | 0.000122 |
| checking permissions | 0.000006 |
| checking permissions | 0.000004 |
| checking permissions | 0.000003 |
| checking permissions | 0.000003 |
| checking permissions | 0.000005 |
| Opening tables | 0.000026 |
| init | 0.000044 |
| System lock | 0.000013 |
| optimizing | 0.000020 |
| statistics | 0.000058 |
| preparing | 0.000024 |
| executing | 0.000004 |
| Sending data | 0.001262 |
| end | 0.000008 |
| query end | 0.000006 |
| closing tables | 0.000010 |
| freeing items | 0.000021 |
| cleaning up | 0.000014 |
+----------------------+----------+
19 rows in set, 1 warning (0.00 sec)
Or using performance_schema:
mysql> UPDATE performance_schema.threads SET INSTRUMENTED = 'NO'
WHERE TYPE='FOREGROUND' AND PROCESSLIST_USER NOT LIKE 'test_user';
mysql> UPDATE performance_schema.setup_instruments SET ENABLED = 'YES', TIMED = 'YES'
WHERE NAME LIKE '%statement/%';
mysql> UPDATE performance_schema.setup_instruments SET ENABLED = 'YES', TIMED = 'YES'
WHERE NAME LIKE '%stage/%';
mysql> UPDATE performance_schema.setup_consumers SET ENABLED = 'YES'
WHERE NAME LIKE '%events_statements_%';
mysql> UPDATE performance_schema.setup_consumers SET ENABLED = 'YES'
WHERE NAME LIKE '%events_stages_%';
> SELECT CONCAT(customer.last_name, ', ', customer.first_name) AS customer, address.phone, film.title FROM rental INNER JOIN customer ON rental.customer_id = customer.customer_id INNER JOIN address ON customer.address_id = address.address_id INNER JOIN inventory ON rental.inventory_id = inventory.inventory_id INNER JOIN film ON inventory.film_id = film.film_id WHERE rental.return_date IS NULL AND rental_date + INTERVAL film.rental_duration DAY < CURRENT_DATE() LIMIT 5;
+----------------+--------------+------------------+
| customer | phone | title |
+----------------+--------------+------------------+
| OLVERA, DWAYNE | 62127829280 | ACADEMY DINOSAUR |
| HUEY, BRANDON | 99883471275 | ACE GOLDFINGER |
| OWENS, CARMEN | 272234298332 | AFFAIR PREJUDICE |
| HANNON, SETH | 864392582257 | AFRICAN EGG |
| COLE, TRACY | 371490777743 | ALI FOREVER |
+----------------+--------------+------------------+
5 rows in set (0.00 sec)
mysql> SELECT EVENT_ID, TRUNCATE(TIMER_WAIT/1000000000000,6) as Duration, SUBSTRING(SQL_TEXT,1,25) as sql_text
FROM performance_schema.events_statements_history_long WHERE SQL_TEXT like '%rental%';
+----------+----------+--------------------------------------------------------+
| event_id | duration | sql_text |
+----------+----------+--------------------------------------------------------+
| 31 | 0.028302 | SELECT CONCAT(customer.la |
+----------+----------+--------------------------------------------------------+
mysql> SELECT event_name AS Stage, TRUNCATE(TIMER_WAIT/1000000000000,6) AS Duration
FROM performance_schema.events_stages_history_long WHERE NESTING_EVENT_ID=31;
+--------------------------------+----------+
| Stage | Duration |
+--------------------------------+----------+
| stage/sql/starting | 0.000080 |
| stage/sql/checking permissions | 0.000005 |
| stage/sql/Opening tables | 0.027759 |
| stage/sql/init | 0.000052 |
| stage/sql/System lock | 0.000009 |
| stage/sql/optimizing | 0.000006 |
| stage/sql/statistics | 0.000082 |
| stage/sql/preparing | 0.000008 |
| stage/sql/executing | 0.000000 |
| stage/sql/Sending data | 0.000017 |
| stage/sql/end | 0.000001 |
| stage/sql/query end | 0.000004 |
| stage/sql/closing tables | 0.000006 |
| stage/sql/freeing items | 0.000272 |
| stage/sql/cleaning up | 0.000001 |
+--------------------------------+----------+
This can be helpful if a query plan looks “good” but things are taking too long. You can find out if your query is spending time locked or compiling statistics, etc.
You can also find out “how much” of something was going on for a given query by looking at the handler statistics:
> FLUSH STATUS;
Query OK, 0 rows affected (0.00 sec)
> SELECT CONCAT(customer.last_name, ', ', customer.first_name) AS customer, address.phone, film.title FROM rental INNER JOIN customer ON rental.customer_id = customer.customer_id INNER JOIN address ON customer.address_id = address.address_id INNER JOIN inventory ON rental.inventory_id = inventory.inventory_id INNER JOIN film ON inventory.film_id = film.film_id WHERE rental.return_date IS NULL AND rental_date + INTERVAL film.rental_duration DAY < CURRENT_DATE() LIMIT 5;
+----------------+--------------+------------------+
| customer | phone | title |
+----------------+--------------+------------------+
| OLVERA, DWAYNE | 62127829280 | ACADEMY DINOSAUR |
| HUEY, BRANDON | 99883471275 | ACE GOLDFINGER |
| OWENS, CARMEN | 272234298332 | AFFAIR PREJUDICE |
| HANNON, SETH | 864392582257 | AFRICAN EGG |
| COLE, TRACY | 371490777743 | ALI FOREVER |
+----------------+--------------+------------------+
5 rows in set (0.00 sec)
> show status like 'Handler%';
+----------------------------+-------+
| Variable_name | Value |
+----------------------------+-------+
| Handler_commit | 1 |
| Handler_delete | 0 |
| Handler_discover | 0 |
| Handler_external_lock | 10 |
| Handler_mrr_init | 0 |
| Handler_prepare | 0 |
| Handler_read_first | 1 |
| Handler_read_key | 94 |
| Handler_read_last | 0 |
| Handler_read_next | 293 |
| Handler_read_prev | 0 |
| Handler_read_rnd | 0 |
| Handler_read_rnd_next | 33 |
| Handler_rollback | 0 |
| Handler_savepoint | 0 |
| Handler_savepoint_rollback | 0 |
| Handler_update | 0 |
| Handler_write | 19 |
+----------------------------+-------+
18 rows in set (0.00 sec)
This allows us a glimpse of how many times MySQL had to do certain things while running a query. For instance “Handler_read_rnd_next” was used 33 times. We can look up what this means in the documents and gain insight into what is happening.
These tools allow us to have a better understanding of what happened when a query was executed. But again they only help us analyze a single query. If you really want to see a bigger picture of an overall server workload and what queries are doing in production, you need to bring out the big guns.
Percona toolkit offers pt-query-digest. This tool ingests a slow query log from the server and analyzes it to your specifications. Its output has some visualization (tabulation) that gives you a better idea of what a server is spending its time doing, and offers a break down of the individual queries and real-world examples.
A top-level overview:
# 8.1s user time, 60ms system time, 26.23M rss, 62.49M vsz
# Current date: Thu Dec 29 07:09:32 2011
# Hostname: somehost.net
# Files: slow-query.log.1
# Overall: 20.08k total, 167 unique, 16.04 QPS, 0.01x concurrency ________
# Time range: 2011-12-28 18:42:47 to 19:03:39
# Attribute          total     min     max     avg     95%  stddev  median
# ============     ======= ======= ======= ======= ======= ======= =======
# Exec time             8s     1us    44ms   403us   541us     2ms    98us
# Lock time          968ms       0    11ms    48us   119us   134us    36us
# Rows sent        105.76k       0    1000    5.39    9.83   32.69       0
# Rows examine     539.46k       0  15.65k   27.52   34.95  312.56       0
# Rows affecte       1.34k       0      65    0.07       0    1.35       0
# Rows read        105.76k       0    1000    5.39    9.83   32.69       0
# Bytes sent        46.63M      11 191.38k   2.38k   6.63k  11.24k  202.40
# Merge passes           0       0       0       0       0       0       0
# Tmp tables         1.37k       0      61    0.07       0    0.91       0
# Tmp disk tbl         490       0      10    0.02       0    0.20       0
# Tmp tbl size      72.52M       0 496.09k   3.70k       0  34.01k       0
# Query size         3.50M      13   2.00k  182.86  346.17  154.34   84.10
# InnoDB:
# IO r bytes        96.00k       0  32.00k   20.86       0  816.04       0
# IO r ops               6       0       2    0.00       0    0.05       0
# IO r wait           64ms       0    26ms    13us       0   530us       0
# pages distin      28.96k       0      48    6.29   38.53   10.74    1.96
# queue wait             0       0       0       0       0       0       0
# rec lock wai           0       0       0       0       0       0       0
# Boolean:
# Filesort       4% yes,  95% no
# Filesort on    0% yes,  99% no
# Full scan      4% yes,  95% no
# QC Hit         0% yes,  99% no
# Tmp table      4% yes,  95% no
# Tmp table on   2% yes,  97% no
An individual query overview:
# Query 1: 0.26 QPS, 0.00x concurrency, ID 0x92F3B1B361FB0E5B at byte 14081299
# This item is included in the report because it matches --limit.
# Scores: Apdex = 1.00 [1.0], V/M = 0.00
# Query_time sparkline: |   _^   |
# Time range: 2011-12-28 18:42:47 to 19:03:10
# Attribute    pct   total     min     max     avg     95%  stddev  median
# ============ === ======= ======= ======= ======= ======= ======= =======
# Count          1     312
# Exec time     50      4s     5ms    25ms    13ms    20ms     4ms    12ms
# Lock time      3    32ms    43us   163us   103us   131us    19us    98us
# Rows sent     59  62.41k     203     231  204.82  202.40    3.99  202.40
# Rows examine  13  73.63k     238     296  241.67  246.02   10.15  234.30
# Rows affecte   0       0       0       0       0       0       0       0
# Rows read     59  62.41k     203     231  204.82  202.40    3.99  202.40
# Bytes sent    53  24.85M  46.52k  84.36k  81.56k  83.83k   7.31k  79.83k
# Merge passes   0       0       0       0       0       0       0       0
# Tmp tables     0       0       0       0       0       0       0       0
# Tmp disk tbl   0       0       0       0       0       0       0       0
# Tmp tbl size   0       0       0       0       0       0       0       0
# Query size     0  21.63k      71      71      71      71       0      71
# InnoDB:
# IO r bytes     0       0       0       0       0       0       0       0
# IO r ops       0       0       0       0       0       0       0       0
# IO r wait      0       0       0       0       0       0       0       0
# pages distin  40  11.77k      34      44   38.62   38.53    1.87   38.53
# queue wait     0       0       0       0       0       0       0       0
# rec lock wai   0       0       0       0       0       0       0       0
# Boolean:
# Full scan    100% yes,   0% no
# String:
# Databases    wp_blog_one (264/84%), wp_blog_tw… (36/11%)... 1 more
# Hosts
# InnoDB trxID 86B40B (1/0%), 86B430 (1/0%), 86B44A (1/0%)... 309 more
# Last errno   0
# Users        wp_blog_one (264/84%), wp_blog_two (36/11%)... 1 more
# Query_time distribution
#   1us
#  10us
# 100us
#   1ms  #################
#  10ms  ################################################################
# 100ms
#    1s
#  10s+
# Tables
#    SHOW TABLE STATUS FROM `wp_blog_one ` LIKE 'wp_options'G
#    SHOW CREATE TABLE `wp_blog_one `.`wp_options`G
# EXPLAIN /*!50100 PARTITIONS*/
SELECT option_name, option_value FROM wp_options WHERE autoload = 'yes'G
Use it if you have a representative example of a server’s workload and you’re trying to understand what queries are the most poorly performing or executed most often. You can look for outliers that cause problems on occasion and more.
Finally, in the modern world, we want all this data aggregated together, visualized and easily accessible. Everything from explains to statistics to profiles to digests, and we want it all compiled in a nice neat package. Enter Percona Monitoring and Management (PMM) Query Analytics. (Screenshots are from PMM v1.7, other versions may look different.)
After setup and configuration, this tool offers us a comprehensive visual representation of the things we’ve discussed and much more.
PMM QAN is able to offer us a big picture look at the queries a server is executing, when they’re being run, what is taking up a lot of time, and what the variance is for a user defined time frame. It does this all at a glance by offering sparkline graphs (timelines) and variance represented graphically:
![]()
Remember when I spoke about Handlers and Profiling? PMM also offers us an aggregated picture of similar information server wide with human-readable terminology:
![]()
By selecting a single query, you can “drill down” and get lots of details about that specific query being run on your server:
![]()
Along with immediate access to Schema infomation and explain plans:
![]()
![]()
You can see PMM QAN in action (along with the rest of PMM’s features) at the demo site:
https://pmmdemo.percona.com/
As you can see there are many ways we can use MySQL tools to help us visualize what MySQL is doing with a query. Knowing what tools are available and what they can show you about your query can be helpful. Some of these are very quick and easy to use, such as the built-in MySQL utility statements. Others like pt-toolkit or Workbench require installed software, and pt-query-digest usually needs a representative query log. PMM requires installation and configuration, but it provides the most detail and visualization.
MySQL tools we discussed:
-
EXPLAIN
-
pt-visual-explain
-
MySQL Workbench
-
Query Profiling
-
Handler Statistics
-
pt-query-digest
-
PMM Query Analytics


 )
)


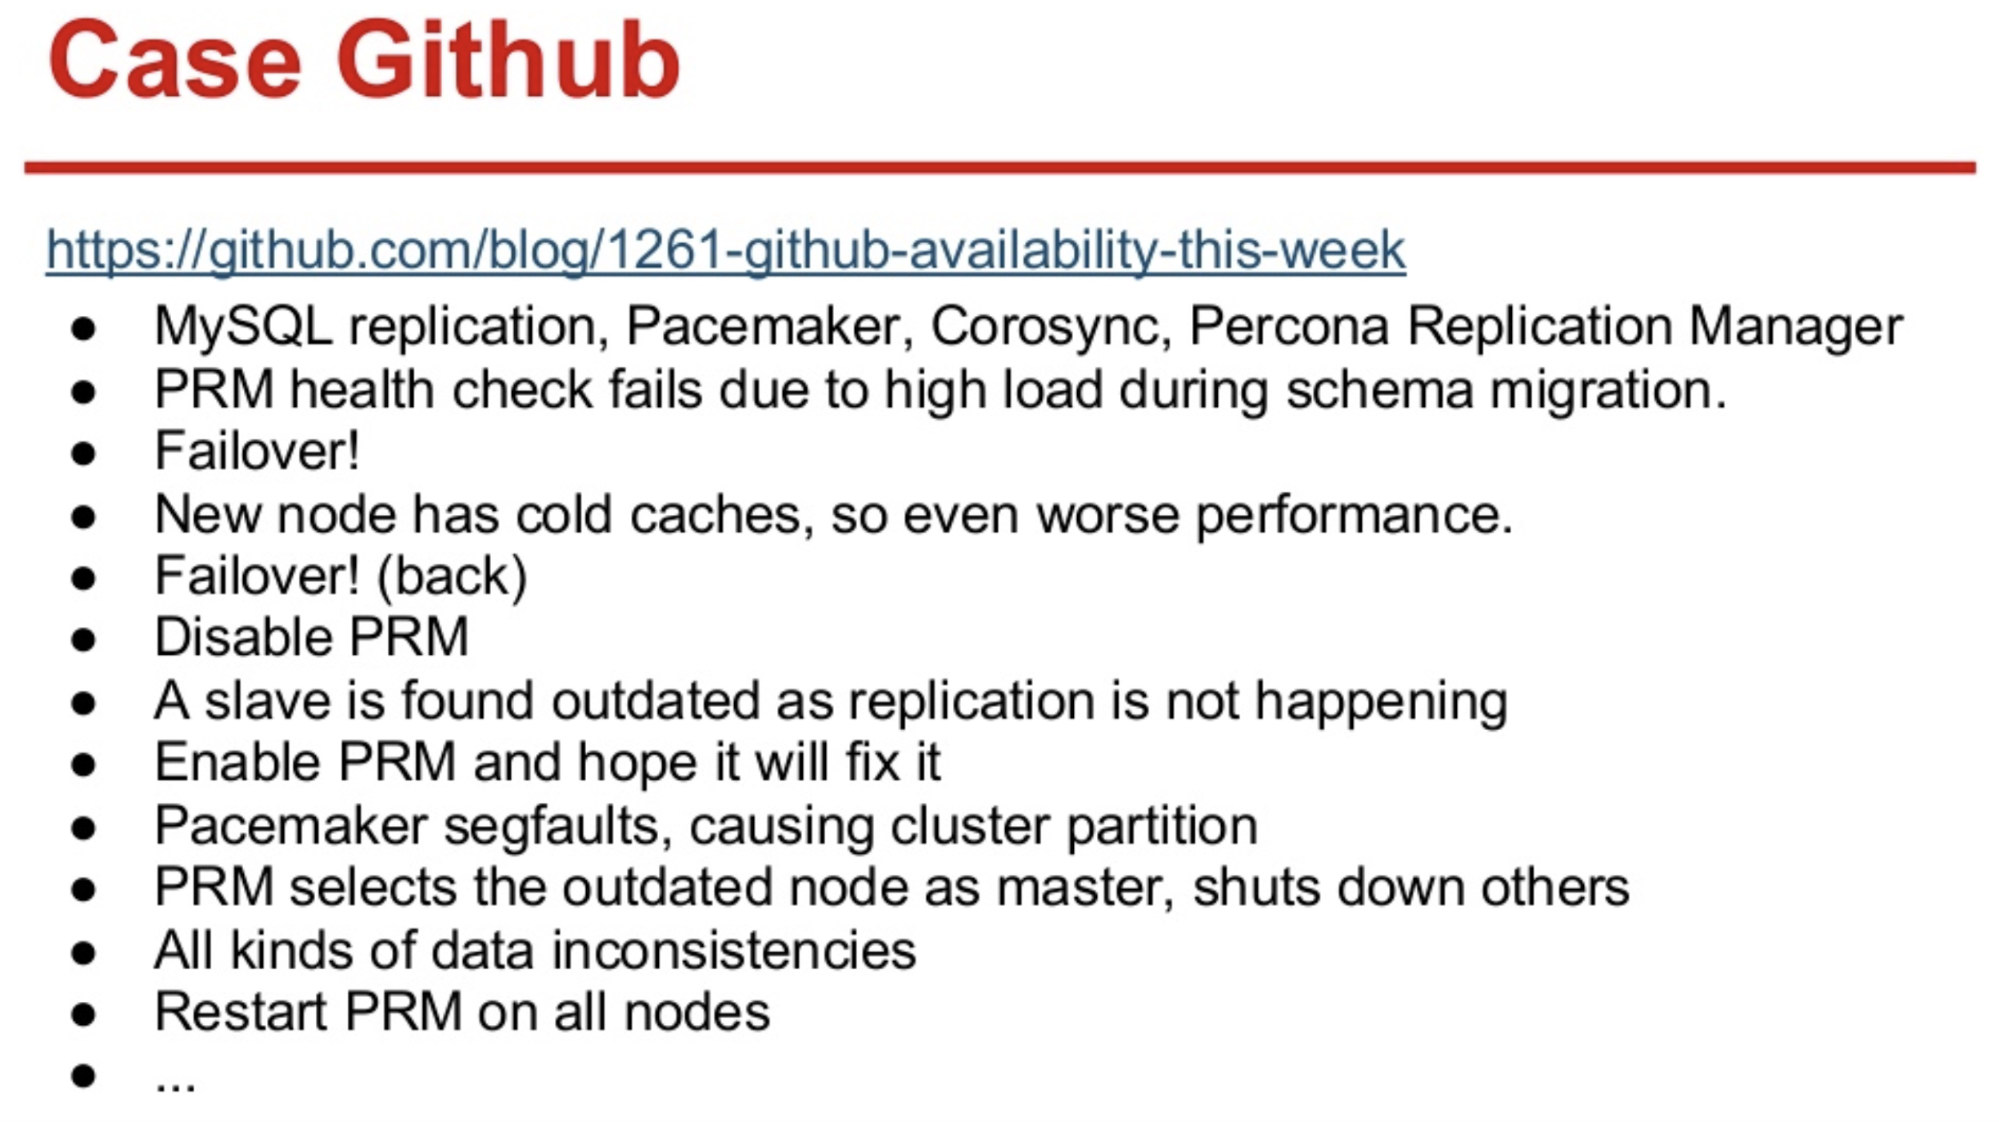
 Percona announces the release of


 I promised to do a pricing post on the Amazon RDS Aurora MySQL pricing, so here we go. All pricing is noted in USD (we’ll explain why)
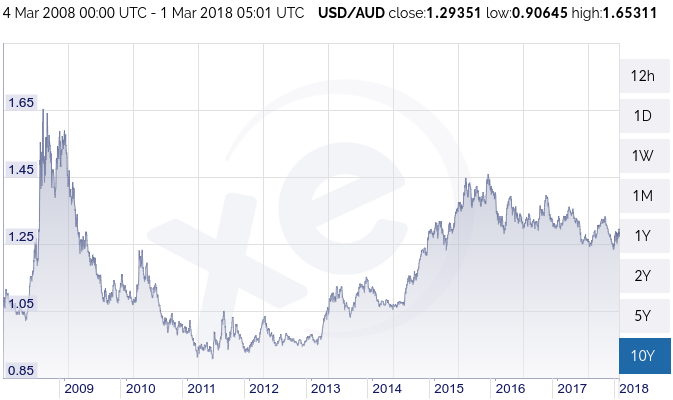


 Join Percona Chief Evangelist Colin Charles as he covers happenings, gives pointers and provides musings on the open source database community.