Windowing Functions are new to MySQL with Version 8. I have been very lucky in the past few days to find two excellent resources that I want to share with you. Both are worth the time and effort to study.
At the Southern California Linux Expo last week, Bruce Momjian of EnterpriseDB and PostgreSQL fame gave an amazing tutorial on Common Table Expressions and Windowing Functions (slides for both at https://momjian.us/main/presentations/sql.html). Bruce is an amazing presenter and I highly recommend going to his sessions at conferences. So, what can a MySQL-er learn from a Postrgrestian?
Plenty.
In this case the two databases are using SQL and the features that turn that language from descriptive to imperative. But showing how these features is very hard. Bruce said it took him six years to finish the Windowing Function presentation. And the results are impressive.
You will have to make some changes to the presented code as MySQL does not have sequences -- create a table named x, with a single int column named x, and fill it with the numbers one through 10 for the first windowing function examples. The big item to study is the various partitioning terminology which can get confusing but is spelled out explicitly in this tutorial.
His examples include calculating revenue growth, running totals, dealing with duplicated data, finding the top N rows, and examining repeat customer purchases.
Doing these two tutorials will not turn you into a windowing function expert. But you will have a better understanding of how they work and that will make you a better SQL programmer
Did you see Percona at SCaLE 16x? I spent a couple of days there learning about open source software, databases, and other interesting topics. You can get even more open source database information at Percona Live 2018.
SCaLE is the largest community-run open-source and free software conference in North America. It is held annually in the greater Los Angeles area. This year’s event took place on March 8-11, 2018, at the Pasadena Convention Center. SCaLE 16X hosted 150 exhibitors this year, along with nearly 130 sessions, tutorials and special events.
Percona has been attending now for a number of years, and this year was no exception. Besides our booth in the Exhibit Hall, we had two speakers giving three different talks:
In modern data architectures, we’re increasingly moving from single node design systems to distributed architectures using multiple nodes – often spread across multiple databases and multiple continents. Such architectures bring many benefits (such as scalability and resiliency), but can also bring a lot of pain if not correctly architected.
In this presentation, we looked into how we can use MySQL to engineer such systems. Firstly, we looked into the application data requirements that can shape which distributed architectures will work for an application, and what are their benefits and tradeoffs. Then we looked into how to implement the architectures with MySQL, using conventional and proven options such as MySQL Replication, as well as newer options such as:
MySQL Multi-Source Replication
MySQL Group Replication
Percona XtraDB Cluster and Galera
Application-driven replication using Kafka
Finally, since a common cause of production problems is a misunderstanding of how distributed systems are designed to behave during failure, we examined what can commonly happen to cause architecture scenarios to fail.
There are many great new features in MySQL 8.0, but how exactly can they help your applications? This session took a practical look at MySQL 8.0 features and improvements. We looked at the bugs, issues and limitations of previous MySQL versions and how MySQL 8.0 addresses them. It also covered what you can do with MySQL 8.0 that you couldn’t before.
Imagine a ticket sales website that does normal events like an M2M concert, but also occasionally sells tickets to the very popular play Harry Potter and the Cursed Child. This is a perfect capacity planning example. Selling tickets requires that you never sell more tickets than you actually have. You want to load-balance your queries, to shard your data stores and split reads and writes. You need to determine where the system bottlenecks, so you need a baseline for your regular traffic. The website must be able to handle the increased load for extremely popular performances, but you don’t want to buy servers that aren’t doing anything for much of the time. (This is also why the cloud is so popular today.)
Colin Charles explored storage capacity planning for OLTP and data warehousing uses and explains how metrics collection helps you plan your requirements. Coupled with the elastic nature of clouds, you should never have an error establishing database connection. Along the way, Colin also covered tools such as Box Anemometer, innotop, the slow query log, Percona Toolkit (pt-query-digest), vmstat, Facebook’s Prophet, and Percona Monitoring and Management (PMM).
Join the open source database community in Santa Clara, California, to learn about the core topics in MySQL, MongoDB and other open source databases. Get briefed on the hottest topics, learn about building and maintaining high-performing deployments and listen to technical experts and top industry leaders. The Percona Live 2018 – Open Source Database Conference is a great event for users of any level exploring open source database technologies.
Some of these speakers and companies attending include:
Join Percona Chief Evangelist Colin Charles as he covers happenings, gives pointers and provides musings on the open source database community.
SCALE16x is over. Percona had a large showing — both Peter Zaitsev & myself had talks, and the booth in the expo hall saw Rick Golba, Marc Sherwood, and Dave Avery also pop by. The lead scanner suggests we had several hundred conversations — read Dave Avery’s summary. My talk went well, though during Q&A the number of questions I got about MariaDB Server was quite interesting (considering it wasn’t part of my talk!). It is clear people are concerned about compatibility (because I spent close to 45 minutes after my talk answering Q&A outside too).
I got to catch up with Dave Stokes and asked him why there were version numbers being skipped in MySQL 8 (as noted in last week’s column). Now there’s a blog post explaining it: MySQL 8.0: It Goes to 11!. It has to do with version number alignment across the product line.
This week we saw something cool come out of Stack Overflow: their Developer Survey Results 2018. There were over 100,000 developers participating in this survey, a marked increase from 2017 when they only had 64,000.
About 66,264 respondents answered the question about what databases they use. MySQL is by far the most popular with 58.7% of the respondents saying they use it. This is followed by PostgreSQL getting 32.9%, MongoDB getting 25.9%, and MariaDB 13.4%. I’m surprised that Amazon RDS/Aurora got 5.1%. In 2017, the first year they introduced the database component, only 29,452 respondents participated, with 55.6% using MySQL, 26.5% using PostgreSQL, and 21% using MongoDB (MariaDB was not broken out last year).
When it came to the most “loved/dread/wanted” databases, apparently 62% of respondents loved PostgreSQL, with 58.8% loving Amazon RDS/Aurora, 55.1% MongoDB, 53.3% MariaDB Server, and 48.7% only loving MySQL. In terms of dread, 51.3% dread MySQL, while only 46.7% dread MariaDB; MongoDB has 44.9% dreading it, and PostgreSQL only 38%. As for the most wanted databases? 18.6% for MongoDB, 11.4% for PostgreSQL, 7.5% for MySQL, and 3.4% for MariaDB Server. It’s clear MongoDB topping the list ensures they have a lot to celebrate, as evidenced by this: Stack Overflow Research of 100,000 Developers Finds MongoDB is the Most Wanted Database. (In 2017, 60.8% loved PostgreSQL, 55% MongoDB, and 49.6% for MySQL; MySQL was the 3rd most dreaded database with 50.4%, followed by 45% for MongoDB, and 39.2% for PostgreSQL; as for the most wanted, MongoDB won with 20.8%, PostgreSQL got second at 11.5%, and MySQL 8.5%).
So if Stack Overflow surveys are an indication of usage, MySQL is still way more popular than anything else, including MariaDB Server regardless of its current distribution. Speaking of MariaDB, the MariaDB Foundation now accepts donations in cryptocurrencies.
MongoDB Evolved is something you should totally check out. I wish something like this exists for MySQL, since tonnes of people ask questions, e.g. “Does MySQL support transactions?”, etc.
Percona Toolkit is a collection of advanced open source command-line tools, developed and used by the Percona technical staff, that are engineered to perform a variety of MySQL®, MongoDB® and system tasks that are too difficult or complex to perform manually. With over 1,000,000 downloads, Percona Toolkit supports Percona Server for MySQL, MySQL, MariaDB®, Percona Server for MongoDB and MongoDB.
PT-1500: Added the --output=secure-slowlog option to pt-query-digestto replace queries in the output by their fingerprints. This provides the ability to santize a slow log in order to adhere to GDPR as the slow query log has the potential to leak sensitive information since query WHERE clauses are included.
As an example of how the fingerprint anonymizes queries we’ll show this using an UPDATE statement: UPDATE sbtest12 SET k='abc' WHERE id=12345
after fingerprinting, it becomes: UPDATE sbtest? SET k=k? WHERE id=?
Bug Fixes:
PT-1492: pt-kill in version 3.0.7 ignores the value of the --busy-time option
PT-1503: The post-install script fails on VM due to improper UUID file detection
Help us improve our software quality by reporting any bugs you encounter using our bug tracking system.
I just read an article called Low-Overhead Asynchronous Checkpointing in Main-Memory Database Systems. It was mentioned in a course in Database Systems at Carnegie-Mellon University, see here.
In MySQL Cluster 7.6.4 we released a new variant of our checkpointing designed for modern HW with TBytes of main memory. I think studying this implementation will be very worthwhile both for users of NDB, but also for researchers in DBMS implementations. It implements a new class of checkpoint algorithms that is currently a research topic in the database research community.
It was interesting to compare our approach that I called Partial LCP with approaches taken by other commercial in-memory databases and with the approach presented in the paper.
LCP is Local CheckPoint which is the name we use for our checkpoint protocol in NDB.
The course presents a number of ideal properties of a checkpoint implementation.
The first property is that doesn't slow down regular transaction processing.
In the case of NDB we execute checkpoints at a steady pace which consumes around 5-10% of the available CPU resources. This will decrease even more with the implementation in 7.6.
The second is that it doesn't introduce any latency spikes.
NDB checkpointing both new and old executes in steps of at most 10-20 microseconds. So there will be extremely small impact on latency of transactions due to checkpointing.
The third property is that it doesn't require excessive memory overhead.
NDB checkpointing consumes a configurable buffer in each database thread. The ideal size of this is around 1 MByte. In addition we have a REDO log buffer that is usually a bit bigger than that. That is all there is to it. There is no extra memory space needed for checkpointing rows. The checkpointing performs a normal scan of the rows and copies the memory content to the buffer and as soon as the buffer is full it writes it to disk using sequential disk writes.
It is fair to say that NDB does a good job in handling those ideal properties.
The course presents two variants called fuzzy checkpoints and consistent checkpoints. The course defines fuzzy checkpoints as a checkpoint that can write uncommitted data. I would normally use the term fuzzy checkpoint to mean that the checkpoint is not consistent at a database level, but can still be consistent on a row basis.
Actually NDB is a mix of the definition provided in the course material. It is a consistent checkpoint for each row. But different rows can be consistent at very different points in time. So on a row basis NDB is consistent, but at the database level the checkpoint is fuzzy. Thus to perform recovery one needs to install the checkpoint and then apply the REDO log to get a consistent checkpoint restored.
Next the course presents two variants called Complete Checkpoints and Delta Checkpoints. Complete Checkpoint means that the entire database is written in each checkpoint. Delta Checkpoint means that only changes are written in a checkpoint.
This is where MySQL Cluster 7.6 differs from 7.5. 7.5 uses a Complete Checkpoint scheme. 7.6 uses a Partial Checkpoint scheme.
In my view the NDB variant is a third variant which is not complete and not a Delta Checkpoint. Partial means that it writes the Delta, that is it writes all changes since the last checkpoint. But it does also write a Complete Checkpoint for a part of the database, thus the name Partial Checkpoint. Thus it is similar to an incremental backup scheme.
NDB can divide the database up in up to 2048 parts, each checkpoint can write 0 parts (only if no changes occurred in the table partition since last checkpoint). It can write 1 part if the number of writes is very small, it can write all 2048 parts if almost all rows have been updated and it can write anywhere between 1 and 2048 based on how many rows were updated since last checkpoint.
Almost all commercial In-Memory DBMSs still use a complete checkpoint scheme. As we move towards TBytes of memory this is no longer a plausible approach.
The NDB approach means that we can perform a checkpoint in a few minutes even in a system with 16 TBytes of memory where we need to write about 8 GBytes plus the changes since the last checkpoint.
Thus NDB takes the step into a new world of massively large In-Memory DBMSs with the introduction of MySQL Cluster 7.6 and its new Partial LCP implementation.
My new book "MySQL Cluster 7.5 inside and out" describes the LCP implementation in 7.5, the description of the Partial LCP can be found in my blogs and also some very detailed descriptions in the source code itself. Among other things a 10-page proof of that the algorithm actually works :)
The nice thing with the Partial LCP approach in NDB is that it requires no more work after writing the checkpoint. There is no need of merging checkpoints. This happens automatically at recovery. There is some amount of overhead in that the checkpoints can have some rows in multiple checkpoints and thus there is some amount of overhead at recovery. We calculate the number of parts to use based on the amount of changes. We even implemented a LCP simulator that calculates the overhead while inserting and deleting large amounts of row and has been used to find the proper configurable parameters for the algorithm.
One of the main objectives of the new Partial LCP algorithm in MySQL Cluster 7.6 is to keep up with the development of modern HW.
I have already described in previous blogs how Partial LCP can handle nicely even database sizes of 10 TBytes of memory with a very modest load on the disk devices.
Now modern HW has shifted from using hard drives to using SSDs.
The original approach in NDB is assuming that the checkpoints and REDO logs are stored on hard drives. In MySQL Cluster 7.5 the disk space required for the REDO log is that it is a bit larger than the DataMemory size. The reason is that we want to survive also when loading massive amounts of data.
In MySQL Cluster 7.5 we cannot remove any checkpoint files until a checkpoint is fully completed. This means that we require around 4x the memory size of disk space for REDO logs and checkpoints.
With hard drives this is not a problem at all. As an example my development box has 32 GBytes of memory with 2 TByte of disk space. Thus 64x more disk space compared to the memory space.
With modern servers this size difference between memory and disks is decreasing. For example many cloud VMs only have a bit more than 2x the disk size compared to the memory size.
So one goal of MySQL Cluster 7.6 is to fit in much less disk space.
The aim is to solve this with a three-thronged approach.
1) Partial LCP means that we can execute the checkpoints much faster. Since REDO logs only need to be kept for around two checkpoints this means a significant decrease of size requirements for REDO logs. The aim is to only need around 10% of the disk space of memory for the REDO logs. This work is not completed in 7.6.4. As usual there are no guarantees when this work will be completed.
2) Using Partial LCP we can throw away old LCP files as soon as we have created a new recoverable LCP for the table partition. Thus it is no longer necessary to store 2 LCPs on disk. At the same time there is some overhead related to Partial LCPs. By default setting this overhead is 50% plus a bit more. Thus we should always fit within about 1.6x times the memory size.
It is possible to set EnablePartialLcp to false, in this case all checkpoints will be Complete Checkpoints. This means more writes to disk for checkpoints, but it will decrease the storage space to around the same as the memory size.
3) Using CompressedLCP set to 1 we can decrease LCP storage by another factor of 2-3x (usually around 2.7x). This feature has existed for a long time in NDB.
Thus it should be possible to significantly decrease the requirements on storage space when running NDB using MySQL Cluster 7.6.
In MySQL Cluster 7.5 we use Complete Checkpoints. In MySQL Cluster 7.6 we implement an approach where we only checkpoint a part of the database in each checkpoint.
A special case is a checkpoint of a table partition where no changes at all have happened since the last checkpoint. In this case we implemented a special optimisation such that it is not necessary to checkpoint anything at all for this table partition. It is only necessary to write a new LCP control file which is 4 kBytes in size for each table partition (can grow to 8 kBytes if the recovery will require more than 980 checkpoints to recover.
This means that if your database contains a large set of read-only tables, there will be no need to checkpoint those tables at all. This feature is used also when setting EnablePartialLcp to false.
One important problem that requires a solution is to decide whether a row has been updated since the last checkpoint or not.
Most implementations use some kind of mechanism that requires extra memory resources and/or CPU resources to handle this.
NDB uses the fact that each row is already stamped with a timestamp. The timestamp is what we call a global checkpoint id. A new global checkpoint is created about once every 2 seconds (can be faster or slower by configuration).
Thus we will overestimate the number of rows written since last checkpoint with a little bit, but with checkpoints taking a few minutes, the extra overhead of this is only around 1%.
Thus when we scan rows we check the global checkpoint id of the row, if it is bigger than the global checkpoint that the last checkpoint had fully covered we will write the row as changed since last checkpoint. Actually we also have the same information on the page level, thus we can check the page header and very quickly scan past an entire page if it hasn't been updated since last checkpoint.
The same type of scanning is used also to bring a restarting node up to synch with the live node. This algorithm has been present in NDB since MySQL 5.1.
NDB is mainly an In-memory database. We have however also the possibility to store non-indexed columns on disk. This data uses a page cache as any other normal disk-based DBMS.
Interestingly with the increases of memory sizes one could think that disk data becomes less important for MySQL Cluster. The answer is actually the opposite.
The reason is again the HW development. NDB is designed with predictable latency as a very basic requirement. In the past disks meant hard drives. Access time to a hard disk was several milliseconds at best. Given that our requirement was to handle complex transactions within 10 milliseconds disk data storage was out of the question.
Modern HW is completely different, they use SSD devices, first attached through the SATA interface that enabled up to around 500 MByte per second and a few thousand IO operations per second (IOPS). The second step was the introduction of SSD devices on the PCI bus. This lifted the performance up to more than 1 GByte per second. These devices are extremely small and still very powerful. I have an Intel NUC at home that has two of those devices.
Thus the performance difference between disk storage and RAM has decreased.
The next step on the way was to change the storage protocol and introduce NVMe devices. These still use the same HW, but use a new standard that is designed for the new type of storage devices. Given those devices we have now the ability to execute millions of IOPS on a standard server box with access times of a few tens of microseconds.
For NDB this means that this HW fits very well into the NDB architecture. The work we did on developing the Partial LCP algorithm did also a lot of work on improving our disk data implementation. We see more and more people that use disk data columns in NDB.
The next step is even more interesting, this will bring storage into the memory bus and access times of around one microsecond. For NDB this disk storage can be treated as memory to start with, thus making it possible to soon have multiple TBytes of memory in standard boxes.
Thus HW development is making the NDB engine more and more interesting to use.
One notable example that uses disk data columns in NDB is HopsFS. They use the disk data columns to store small files in the meta data server of the HopsFS implementation of the Hadoop HDFS Name Server. This means much faster access to small files. The tests they did showed that they could handled hundreds of thousands of file reads and writes per second even using fairly standard SSD disks on the servers.
The implementation of disk data in NDB is done such that each row can have three parts. The fixed memory part that is accessed quickly using a row id. The variable sized part that is accessed through a pointer from the fixed size part.
The disk columns are also accessed through a reference in the fixed size part. This reference is an 8-bit value that refers to the page id and page index of the disk columns.
Before we can access those pages we go through a page cache. The page cache was implemented on caching techniques that was state of the art a few years ago.
The idea is quite simple. The page cache uses a normal hot page queue. Pages are brought up in this queue when they are accessed. A single access will bring it up, but to be more permanent in the page cache a page has to be accessed several times.
Now each page is represented in those queues by a page state record. The basis of the page cache algorithm is that a page can be represented in a page state record even if the page is not in the page cache.
NDB has a configuration variable called DiskPageBufferEntries, by default this is set to 10. It is the multiplication factor of how many more pages we have page state records compared to the amount of pages we have in the page cache.
So for example if we have set DiskPageBufferMemory to 10 GByte and we have set DiskPageBufferEntries we will have page state records that holds pages of 100 GBytes in the queues. Thus even when a page is paged out we keep it in the list and thus we can see patterns of reuse that are longer than the page cache we have access to. The factor of 10 means that the page state records are of about 3% of the size of the page cache itself. Thus the benefits of the extra knowledge about page usage patterns comes at a fairly low cost. The factor 10 is configurable.
Many cloud servers comes equipped with hundreds of GBytes (some even TBytes) and can also store a number of TBytes on NVMe devices. NDB is well suited for those modern machines and MySQL Cluster 7.6 have been designed to be suitable for this new generation of HW.
MySQL is again a part of the FOSSASIA - Free Open Source Summit Asia 2018 which will be hold on March 22-25, 2018 in Singapore. Do not miss to come to our booth in exhibition area as well as do not miss MySQL related talks in Database track... See some of them below and at Fossasia schedule:
Saturday, March 24, 2018:
10:00-11:00 MySQL Community Gathering - come to join to the MySQL meetup or other community! Come to Lounge area of the Summit to meet Ricky Setyawan.
11:30-11:55 Database Lightning Talk by Ricky Setyawan, the Principal Sales Consultant
17:00-17:25 Breaking through with MySQL 8.0, by Ricky Setyawan, the Principal Sales Consultant
Sunday, March 25, 2018:
10:00-10:25 Atomic DDL in MySQL 8.0 by Shipra Jain, the Principal Software Engineer
10:30-10:55 MySQL for Distributed transaction and Usage of JSON as a fusion between SQL & NOSQL by Ajo Robert, the Principal Member Technical Staff
11:00-11:25 Histograms and the way we use it in MySQL 8.0 by Amit Bhattacharya, the Senior SW Development Manager
13:00-13:25 What's new in MySQL Optimizer 8.0 by Chaithra M G the Principal MySQL SW Developer
13:30-13:55 MySQL : Improving Connection Security by Harin Nalin Vadodara the Principal MTS
14:00-14:25 New Replication Features in MySQL 8.0 by Venkatesh Duggirala the Senior Principal Member of Technical Staff
14:30-14:55 Improved Error Logging in MySQL 8.0 by Praveenkumar Hulakund the SW Developer
15:00-15:25 The State of the Art on MySQL Group Replication by Hemant Dangi the Senior Technical Staff
15:30-15:55 Enhanced XA Support for Replication in MySQL-5.7 by Nisha Gopalakrishnan the Principal Member of Technical Staff
16:00-16:25 MySQL Performance Schema - A great insight of running MySQL Server by Manyank Prasad the Principal Member of Technical Staff
We are looking forward to talking to you at our booth in expo area or at the Training room 2-1 where the Database track is hold.
ProxySQL is a lightweight yet complex protocol-aware proxy that sits between the MySQL clients and servers. It is a gate, which basically separates clients from databases, and is therefore an entry point used to access all the database servers.
In this new update we’ve…
Updated the information about how to best deploy ProxySQL via ClusterControl
Revamped the section “Getting Started with ProxySQL”
Added a new section on Data Masking
Added new frequently asked questions (FAQs)
Load balancing and high availability go hand-in-hand. ClusterControl makes it easy to deploy and configure several different load balancing technologies for MySQL and MariaDB with a point-and-click graphical interface, allowing you to easily try them out and see which ones work best for your unique needs.
ClusterControl
Single Console for Your Entire Database Infrastructure
Included in ClusterControl Advanced and Enterprise, ProxySQL enables MySQL, MariaDB and Percona XtraDB database systems to easily manage intense, high-traffic database applications without losing availability. ClusterControl offers advanced, point-and-click configuration management features for the load balancing technologies we support. We know the issues regularly faced and make it easy to customize and configure the load balancer for your unique application needs.
We know load balancing and support many different technologies. ClusterControl has many things preconfigured to get you started with a couple of clicks. If you run into challenged we also provide resources and on-the-spot support to help ensure your configurations are running at peak performance.
ClusterControl delivers on an array of features to help deploy and manage ProxySQL
Advanced Graphical Interface - ClusterControl provides the only GUI on the market for the easy deployment, configuration and management of ProxySQL.
Point and Click deployment - With ClusterControl you’re able to apply point and click deployments to MySQL, MySQL replication, MySQL Cluster, Galera Cluster, MariaDB, MariaDB Galera Cluster, and Percona XtraDB technologies, as well the top related load balancers with HAProxy, MaxScale and ProxySQL.
Suite of monitoring graphs - With comprehensive reports you have a clear view of data points like connections, queries, data transfer and utilization, and more.
Configuration Management - Easily configure and manage your ProxySQL deployments with a simple UI. With ClusterControl you can create servers, re-orientate your setup, create users, set rules, manage query routing, and enable variable configurations.
From time to time I see pattern matching queries with conditions that look like this: “where fieldname like ‘%something%’ “. MySQL cannot use indexes for these kinds of queries, which means it has to do a table scan every single time.
(That’s really only half true — there are the FullText indexes. In another blog post I will cover FullText indexes as well.)
I recently was trying to find a solution, and my friend Charles Nagy reminded me of Trigrams. Let me show you the Trigram of the name Daniel:
daniel:
dan
ani
nie
iel
But how is this useful?
Let me show you an example. You have the following email schema:
As we can see, there is an index called “trigram“.
The plan is to create a trigram for every single email addresses. I wrote the following trigger:
create trigger insert_trigram after insert ON test.email FOR EACH ROW
BEGIN
DECLARE email_length int;
declare x int ;
declare i int ;
SELECT CHAR_LENGTH(SUBSTRING_INDEX(email,'@',1)) into email_length from test.email where email=NEW.email and id=NEW.id;
set i=1;
set x=3;
	while email_length >= 3 do
	INSERT INTO email_trigram (email_id,trigram) values (NEW.id,substring(NEW.email from i for x));
	set email_length=email_length-1;
	set i=i+1;
	end while ;
END
When there is an insert, it creates and inserts the trigrams into the email_trigram table. Trigrams for anderson.pierre:
mysql> select trigram from email_trigram where email_id=90587;
+---------+
| trigram |
+---------+
| and     |
| nde     |
| der     |
| ers     |
| rso     |
| son     |
| on.     |
| n.p     |
| .pi     |
| pie     |
| ier     |
| err     |
| rre     |
+---------+
With the following query, we can find all the email addresses with n.pierre:
SELECT e.email
FROM email AS e
INNER JOIN
( SELECT tr.email_id
FROM email_trigram AS tr
WHERE tr.trigram IN ("n.p",".pi","pie","ier","err","rre")
GROUP BY tr.email_id HAVING count(*) =6) AS ti ON ti.email_id=e.id;
*************************** 1. row ***************************
           id: 1
  select_type: PRIMARY
        table: <derived2>
   partitions: NULL
         type: ALL
possible_keys: NULL
          key: NULL
      key_len: NULL
          ref: NULL
         rows: 8214
     filtered: 100.00
        Extra: NULL
*************************** 2. row ***************************
           id: 1
  select_type: PRIMARY
        table: e
   partitions: NULL
         type: eq_ref
possible_keys: PRIMARY
          key: PRIMARY
      key_len: 4
          ref: ti.email_id
         rows: 1
     filtered: 100.00
        Extra: NULL
*************************** 3. row ***************************
           id: 2
  select_type: DERIVED
        table: tr
   partitions: NULL
         type: range
possible_keys: idx_email_id,idx_trigram
          key: idx_trigram
      key_len: 9
          ref: NULL
         rows: 8214
     filtered: 100.00
        Extra: Using index condition; Using temporary; Using filesort
3 rows in set, 1 warning (0.00 sec)
It does not have to read the whole table, but still needs to read a lot of rows and even using filesort. I did not want to create trigrams manually, so I wrote the following procedure:
create procedure select_email(IN email_address varchar(255))
begin
DECLARE email_length int;
declare x int ;
declare i int ;
declare trigram varchar(255) ;
declare trigram_list varchar(255) ;
SELECT CHAR_LENGTH(SUBSTRING_INDEX(email_address,'@',1)) into email_length;
set i=1;
set x=3;
	while email_length >= 3 do
	select substring(SUBSTRING_INDEX(email_address,'@',1) from i for x) into trigram;
	set trigram_list=concat_ws('","',trigram_list,trigram);
	set email_length=email_length-1;
	set i=i+1;
	end while ;
set trigram_list=concat('"',trigram_list,'"');
set @final= concat( " SELECT e.email
FROM email AS e
INNER JOIN
( SELECT tr.email_id
	FROM email_trigram AS tr
	WHERE tr.trigram IN (" , trigram_list , ")
	GROUP BY tr.email_id HAVING count(*) =" , i-1 , ") AS ti ON ti.email_id=e.id" );
PREPARE stmt FROM @final;
EXECUTE stmt;
DEALLOCATE PREPARE stmt;
end
Since with trigrams we are looking for parts of the words (like err or ier), there can be many matches. If we are using a longer condition like derson.pierre, the procedure needed to read 65722 rows. This is also a lot.
Let’s have a look at the selectivity a bit:
mysql> select trigram,count(*) as c from email_trigram group by trigram order by c desc limit 10;
+---------+-------+
| trigram | c     |
+---------+-------+
| er.     | 12919 |
| ann     | 12726 |
| man     | 12462 |
| ell     | 12257 |
| ber     | 12225 |
| sch     | 11753 |
| son     | 10983 |
| ill     |  9443 |
| mar     |  9294 |
| ert     |  8839 |
+---------+-------+
10 rows in set (1.59 sec)
There are parts that give back many rows. As I mentioned, more parts mean more rows.
I was hoping for a bigger improvement, so I wondered what else we could do. MySQL cannot use an index because of the leading %. How can we avoid that? Let’s save all the possible versions of the email address that we could be looking for.
(I don’t know if there is any official name of this method — if someone knows it, please write a comment.)
Shorting method
anderson.pierre@example.org:
anderson.pierre
nderson.pierre
derson.pierre
erson.pierre
rson.pierre
son.pierre
on.pierre
n.pierre
.pierre
pierre
ierre
erre
rre
Hmm.. could this work? Let’s test it. I created the following table and trigger:
CREATE TABLE `email_tib` (
  `id` int(10) unsigned NOT NULL AUTO_INCREMENT,
  `email_id` int(10) unsigned NOT NULL,
  `email_parts` varchar(120) COLLATE utf8_unicode_ci NOT NULL DEFAULT '',
  PRIMARY KEY (`id`),
  KEY `idx_email_id` (`email_id`),
  KEY `idx_trigram` (`email_parts`)
) ENGINE=InnoDB AUTO_INCREMENT=2749001 DEFAULT CHARSET=utf8 COLLATE=utf8_unicode_ci
create trigger insert_tib after insert ON test.email FOR EACH ROW
BEGIN
DECLARE email_length int;
declare x int ;
declare i int ;
SELECT CHAR_LENGTH(SUBSTRING_INDEX(email,'@',1)) into email_length from test.email where email=NEW.email and id=NEW.id;
set i=-3;
	while email_length >= 3 do
	INSERT INTO email_tib (email_id,email_parts) values (NEW.id,substring((SUBSTRING_INDEX(NEW.email,'@',1)),i));
	set email_length=email_length-1;
	set i=i-1;
	end while ;
END
Let’s find the email addresses that contain n.pierre:
Wow, that is much better than the previous one! It is more than 100 times faster! Now you can have a beer because you deserve it.
Selectivity
mysql> select email_parts,count(*) as c
from email_tib group by email_parts
order by c desc limit 10;
+-------------+------+
| email_parts | c    |
+-------------+------+
| son         | 6228 |
| ler         | 3863 |
| ner         | 3635 |
| ann         | 3590 |
| mann        | 3464 |
| man         | 3387 |
| ski         | 3331 |
| ton         | 2659 |
| ell         | 2482 |
| ger         | 2437 |
+-------------+------+
10 rows in set (1.61 sec)
There are parts that result in many readings as well, but it helps a lot now that we are using a longer pattern:
mysql> select email_parts,count(*) as c
from email_tib where length(email_parts) > 5
group by email_parts order by c desc limit 10;
+-------------+-----+
| email_parts | c   |
+-------------+-----+
| reilly      | 704 |
| walter      | 684 |
| kowski      | 676 |
| onnelly     | 662 |
| nnelly      | 662 |
| kinson      | 641 |
| tenberg     | 626 |
| enberg      | 626 |
| hermann     | 417 |
| ermann      | 417 |
+-------------+-----+
10 rows in set (1.59 sec)
Using more than six characters gives us a much better selectivity.
Table statistics
select count(*) from email;
+----------+
| count(*) |
+----------+
|   318458 |
+----------+
1 row in set (0.04 sec)
select count(*) from email_trigram;
+----------+
| count(*) |
+----------+
|  2749000 |
+----------+
1 row in set (0.44 sec)
select count(*) from email_tib;
+----------+
| count(*) |
+----------+
|  2749000 |
+----------+
1 row in set (0.45 sec)
In this test, I used 318458 random email addresses, and both methods created 2749000 additional rows.
As we expected they will use more space than the original table.
Cons
Both solutions require an extra table
That table contains millions of short rows, and it could use a few gigs of space
Requires three triggers (insert, update and delete, which could affect the write performance on the table) or the application has to keep that table up-to-date
Pros
Finding an email address is going to be much faster and require fewer reads.
Users will be much more satisfied.
Conclusion
If there is no built in solution or index in MySQL that can help or solve your problem, do not give up. Many times, with small modifications, you can create your own index table or use other tricks.
In this specific case, if you are willing to sacrifice some additional disk space you can speed up your queries a lot with the right method. Trigram was not the best option, but I can see use cases where it could be better.
This is just one possible solution, there could be an even better one. If you know one, please let me know.
Recently, I’ve been looking into issues with the interactions between MySQL asynchronous replication and Galera replication. In this blog post, I’d like to share what I’ve learned.
MySQL asynchronous replication and Galera replication interactions are complicated due to the number of factors involved (Galera replication vs. asynchronous replication, replication filters, and row-based vs. statement-based replication). So as a start, I’ll look at an issue that came up with setting up an asynchronous replication channel between two Percona XtraDB Cluster (PXC) clusters.
Here’s a view of the desired topology:
The Problem
We want to set up an asynchronous replication channel between two PXC clusters. We also set log-slave-updates on the async slave (PXC node 2a in the topology diagram).
This is an interesting configuration and results in unexpected behavior as the replication depends on the node where the operation was performed. Let’s use CREATE TABLE as an example.
Run CREATE TABLE on Node 1a. The table replicates to Node 1b, but not to the nodes in cluster 2.
Run CREATE TABLE on Node 1b. The table replicates to all nodes (both cluster 1 and cluster 2).
Some background information
Understanding the problem requires some knowledge of MySQL threads. However, as a simplification, I’ll group the threads into three groups:
Main MySQL Client Thread: This thread handles the requests for the client connection (here the client is an external entity).
Async Replication Threads: There are multiple threads in use here, some handle I/O, and some apply the updates, but we will view them as a single entity for simplicity.
Galera Threads: There are also multiple threads here, similar to the Async Replication Threads. (The name Galera here refers to the underlying replication technology used by PXC.)
In the first case (CREATE TABLE executed on Node1a)
The table is replicated from Node1a -> Node 1b via Galera replication.
The table is not replicated because the async replication threads are not picking up the changes.
In the second case (CREATE TABLE executed on Node 1b)
The table is replicated from Node1b -> Node 1a via Galera replication.
The table is replicated from Node1b -> Node 2a via async replication. This differs from the first case because the statement is executed on the Main MySQL client thread. The async replication threads pick up the changes and send them to Node 2a.
The table is replicated from Node 2a -> Node 2b via Galera replication because log-slave-updates has been enabled on Node2a.
That last part is the important bit. We can view the Galera replication threads as another set of asynchronous replication threads. So if data is coming in via async replication, they have to be made visible to Galera by log-slave-updates. This is true in the other direction also: log-slave-updates must be enabled for Galera to supply data to async replication.
In this scenario, the answer is to set log-slave-updates on Node 1b (the async master) and on Node 2a (the async slave).
We set log-slave-updates on node 1b to allow the async threads to pickup the changes from the Galera threads.
We set log-slave-updates on node 2a to allow the Galera threads to pickup the changes from the async threads. Starting with PXC 5.7.17, calling START SLAVE on a PXC node will return an error unless log-slave-updates is enabled.
You must enable log-slave-updates on the node for data to be transferred between Galera and asynchronous replication.
Recommendations/Best Practices
If you plan to use MySQL asynchronous replication with Percona XtraDB Cluster (either as async master or slave), we recommend that you enable log-slave-updates on all nodes within the cluster. This to (1) to ensure that any async replication connections to/from the cluster work correctly and (2) to ensure that all the nodes within a cluster share the same configuration and behavior.
Recommended configuration diagram for the clusters:
ProxySQL is a service designed to scale and handle traffic in very large setups.
In the past we already showed examples of how ProxySQL can handle thousands of MySQL servers, and millions (yes, millions!) of distinct users.
Although, recently a new challenge raised: can ProxySQL perform routing based on MySQL schemaname for a vary large number of schemas?
We know that in production setups ProxySQL is already performing routing to MySQL servers based on schemaname for few hundreds schemas, but can it handle thousands or more?
Technically there is no limit on how many shards ProxySQL can handle, as long as there are rules for them.
Tibor Korocz already pointed in a blog post that more query rules can affect performance.
In case of query routing based on schemaname no regular expressions are involved (therefore each rule is not expensive), but the same principle applies: the more rules need to be evaluated, longer it takes to make a decision (in this case to perform the routing).
Scope of this blog post is to understand the performance implication of performing routing based on the number of rules.
To simplify the setup to run some benchmark, we used only 1 MySQL server as backend, and we created 50000 schemas:
for i in `seq 10001 60000` ; do
echo "CREATE DATABASE IF NOT EXISTS shard_$i;"
done | mysql -u root
To run the benchmark we used a various number of rules.
For every test, we configured ProxySQL setting the right number of rules: for 100 schemas we created 100 rules, for 1000 schema 1000 rules, etc.
For example, for 200 rules we used this configuration:
(
echo "DELETE FROM mysql_query_rules; INSERT INTO mysql_query_rules (active,username,cache_ttl) VALUES (1,\"sbtest\",120000);"
for i in `seq 10001 10200` ; do
echo "INSERT INTO mysql_query_rules (active,username,schemaname,destination_hostgroup,apply) VALUES (1,\"sbtest\",\"shard_$i\",1,1);"
done
echo "LOAD MYSQL QUERY RULES TO RUNTIME;"
) | mysql -u admin -padmin -h 127.0.0.1 -P6032
We then ran queries as the following:
for j in `seq 1 50000` ; do
echo "USE shard_$(($RANDOM%200+10001))" ; echo "SELECT 1;"
done | mysql -u sbtest -psbtest -h 127.0.0.1 -P6033 --ssl-mode=disabled -NB > /dev/null
It is relevant to note that we aren’t interested in the total execution time (this is why we used this simple one-liner to generate traffic), but in the time spent inside the Query Processor.
Because the execution time of the queries is not relevant, we also configured the query cache.
To compute the time spent in the Query Processor we set variable mysql-stats_time_query_processor='true' and computed the value of status variable Query_Processor_time_nsec. This status variable measures the time spent inside the Query Processor, in nanoseconds.
As we expected, the more query rules ProxySQL needs to evaluate, the longer it takes to compute the destination hostgroup for that schemaname. This results in latency before executing the query:
The graph above shows that for 10 rules the average latency is around 1us (microsecond), for 100 rules the average latency is 2us , and that it gradually grows to 6us for 500 rules and 256us for 20000 rules.
6us average latency for 500 rules doesn’t seem to be an issue, but 256us (0.256ms) average latency for 20000 does seem like an issue.
What is also important to note is that these values are the average values for all the shards. Routing decision for some shards are faster than others, depending in which order the rules are written.
In fact, with 20000 rules the average latency for shard_10001 is 0.89us , while the average latency for shard_30000 is 581.1us !
Surely, this doesn’t seem a scalable solution.
MySQL Query Rules Fast Routing
ProxySQL 1.4.7 introduces a new routing capability that enhances what already configurable in mysql_query_rules.
The new capability is configurable using table mysql_query_rules_fast_routing. This table is simpler compared to mysql_query_rules, and its purpose is simple: given username, schemaname and flagIN, finds the destination_hostgroup.
For reference, this is the table definition of mysql_query_rules_fast_routing:
CREATE TABLE mysql_query_rules_fast_routing (
    username VARCHAR NOT NULL,
    schemaname VARCHAR NOT NULL,
    flagIN INT NOT NULL DEFAULT 0,
    destination_hostgroup INT CHECK (destination_hostgroup >= 0) NOT NULL,
    comment VARCHAR NOT NULL,
    PRIMARY KEY (username, schemaname, flagIN) )
Table mysql_query_rules_fast_routing should be considered as an extension of mysql_query_rules. After processing the rules in mysql_query_rules, the rules in mysql_query_rules_fast_routing will be evaluated, unless the last matching rule defined in mysql_query_rules sets apply=1.
Because of the nature of the rules in mysql_query_rules_fast_routing, one and only one rule will be evaluated.
The rules defined in mysql_query_rules_fast_routing are loaded in a hash table, where the key is username, schemaname and FlagIN , and the value is the destination_hostgroup .
New routing algorithm in action
This is the command we used to configure mysql_query_rules_fast_routing with a different number of rules, up to 50000 rules in this example:
(
echo "DELETE FROM mysql_query_rules; DELETE FROM mysql_query_rules_fast_routing;"
echo "INSERT INTO mysql_query_rules (active,username,cache_ttl) VALUES (1,\"sbtest\",120000);"
for i in `seq 10001 60000` ; do
echo "INSERT INTO mysql_query_rules_fast_routing (username,schemaname,flagIN,destination_hostgroup,comment) VALUES (\"sbtest\",\"shard_$i\",0,1,\"\");"
done
echo "LOAD MYSQL QUERY RULES TO RUNTIME;"
) | mysql -u admin -padmin -h 127.0.0.1 -P6032
The results are really interesting:
In other words:
between 10 rules to 10k rules, the average latency is between 1.7us to 1.9us
at 20k rules the average latency is 2.2us
at 50k rules the average latency is 2.4us
What is really interesting is that this new routing algorithm allows ProxySQL to perform schema routing for up to 10000 shards introducing less latency the old routing algorithm was introducing for 100 shards, and it scales very well to 50k rules wth very small overhead compared to 100 shards in the old routing algorithm.
Disabling mysql-stats_time_query_processor by default
In ProxySQL 1.4.4 the new variable mysql-stats_time_query_processor was introduced to dynamically enable or disable measuring the time spent in the Query Processor. Although timing is very important to understand the impact of having too many rules, measuring time elapse with good precision has some performance impact.
In fact, on this same server where we ran these benchmark, measuring time elapse with very good precision has a cost (latency) of 0.3us , mostly spent in kernel space (system calls).
That also means that from the metrics above you should remove 0.3us to determine the latency when measuring time is not enabled. For example, "at 50k rules the average latency is 2.4us" should become "at 50k rules the average latency is 2.1us" .
For this reason, since ProxySQL 1.4.4 , mysql-stats_time_query_processor is disabled by default.
Why flagIN is relevant?
The new routing algorithm performs routing based on username, schemaname, and flagIN .
I think some are asking why flagIN is relevant. flagIN in mysql_query_rules_fast_routing allows to set flagOUT in mysql_query_rules based on other criteria later relevant for routing.
For example, assume that you don’t want to only perform routing based on username+schemaname, but also read/write split.
You can use mysql_query_rules to:
set flagOUT = 1 for all queries to be sent to the server that is the master, no matter in which cluster
set flagOUT = 2 for all queries to be sent to the server that is the slave, no matter in which cluster
The value of flagOUT resulting from mysql_query_rules will become the flagIN in mysql_query_rules_fast_routing. This will allow to combine read/write split to routing based on username+schemaname.
For benchmark purpose, let's create 200.000 rules:
(
echo "DELETE FROM mysql_query_rules; DELETE FROM mysql_query_rules_fast_routing; INSERT INTO mysql_query_rules (active,username,cache_ttl) VALUES (1,\"sbtest\",120000);"
for i in `seq 10001 60000` ; do
echo "INSERT INTO mysql_query_rules_fast_routing (username,schemaname,flagIN,destination_hostgroup,comment) VALUES (\"sbtest\",\"shard_$i\",0,1,\"\");"
done
echo "INSERT INTO mysql_query_rules_fast_routing SELECT username, schemaname, FlagIN+1, destination_hostgroup, comment FROM mysql_query_rules_fast_routing;"
echo "INSERT INTO mysql_query_rules_fast_routing SELECT username, schemaname, FlagIN+2, destination_hostgroup, comment FROM mysql_query_rules_fast_routing;"
echo "LOAD MYSQL QUERY RULES TO RUNTIME;"
) | mysql -u admin -padmin -h 127.0.0.1 -P6032
Updating the graph after testing routing based on 200k rules:
As you can see from the graph above, ProxySQL is now able to perform routing decision based on 200k rules with almost no extra impact compared to 100 rules in the lagacy algorithm.
Drawback of the new algorithm
This new routing algorithm seems to have a minimum overhead of 1.7us (or 1.4us with mysql-stats_time_query_processor disabled).
The minimum overhead is not present in the old/legacy algorithm, therefore it makes sense to use the new routing algorithm only if you have more than 100 routing rules.
Furthermore, ProxySQL Cluster capability doesn't support mysql_query_rules_fast_routing yet.
Memory usage
To reduce contention between worker threads in ProxSQL, threads maintain their own copy of query rules. This means that the more rules you have and the more threads you have configured, the more memory is needed. In this example, loading 200k rules and using 4 threads lead to a memory usage of 280MB.
In future we plan to make configurable if, for query processing, ProxySQL should use more memory and be lock free, or use less memory and not be lock free, or a mix of the two options:
mysql_query_rules to be lock free
mysql_query_rules_fast_routing to be shared between threads
These are implementation details we will be looking into when planning to optimize ProxySQL even further.
Conclusion
ProxySQL 1.4.7 introduces a new routing algorithm that doesn’t replace the legacy algorithm, but enhances it.
Thank to the new routing algorithm, now ProxySQL can easily handle routing based on hundreds of thousands of schemas/shards with almost no impact (few microseconds).
MySQL Package Management Options In this blog we will explore some interesting ways to install MySQL Community and Enterprise Edition binaries using your associated Linux package manager. In this case we’ll look mostly at the Yum package manager on Oracle Linux. The benefit of these package managers is that you can install software packages easily,… Read More »
There are various ways to retain high availability with databases. You can use Virtual IPs (VRRP) to manage host availability, you can use resource managers like Zookeeper and Etcd to (re)configure your applications or use load balancers/proxies to distribute the workload over all available hosts.
The Virtual IPs need either an application to manage them (MHA, Orchestrator), some scripting (Keepalived, Pacemaker/Corosync) or an engineer to manually fail over and the decision making in the process can become complex. The Virtual IP failover is a straightforward and simple process by removing the IP address from one host, assigning it to another and use arping to send a gratuitous ARP response. In theory a Virtual IP can be moved in a second but it will take a few seconds before the failover management application is sure the host has failed and acts accordingly. In reality this should be somewhere between 10 and 30 seconds. Another limitation of Virtual IPs is that some cloud providers do not allow you to manage your own Virtual IPs or assign them at all. E.g., Google does not allow you to do that on their compute nodes.
Resource managers like Zookeeper and Etcd can monitor your databases and (re)configure your applications once a host fails or a slave gets promoted to master. In general this is a good idea but implementing your checks with Zookeeper and Etcd is a complex task.
A load balancer or proxy will sit in between the application and the database host and work transparently as if the client would connect to the database host directly. Just like with the Virtual IP and resource managers, the load balancers and proxies also need to monitor the hosts and redirect the traffic if one host is down. ClusterControl supports two proxies: HAProxy and ProxySQL and both are supported for MySQL master-slave replication and Galera cluster. HAProxy and ProxySQL both have their own use cases, we will describe them in this post as well.
Why do you need a load balancer?
In theory you don’t need a load balancer but in practice you will prefer one. We’ll explain why.
If you have virtual IPs setup, all you have to do is point your application to the correct (virtual) IP address and everything should be fine connection wise. But suppose you have scaled out the number of read replicas, you might want to provide virtual IPs for each of those read replicas as well because of maintenance or availability reasons. This might become a very large pool of virtual IPs that you have to manage. If one of those read replicas had a failure, you need to re-assign the virtual IP to another host or else your application will connect to either a host that is down or in worst case, a lagging server with stale data. Keeping the replication state to the application managing the virtual IPs is therefore necessary.
Also for Galera there is a similar challenge: you can in theory add as many hosts as you’d like to your application config and pick one at random. The same problem arises when this host is down: you might end up connecting to an unavailable host. Also using all hosts for both reads and writes might also cause rollbacks due to the optimistic locking in Galera. If two connections try to write to the same row at the same time, one of them will receive a roll back. In case your workload has such concurrent updates, it is advised to only use one node in Galera to write to. Therefore you want a manager that keeps track of the internal state of your database cluster.
Both HAProxy and ProxySQL will offer you the functionality to monitor the MySQL/MariaDB database hosts and keep state of your cluster and its topology. For replication setups, in case a slave replica is down, both HAProxy and ProxySQL can redistribute the connections to another host. But if a replication master is down, HAProxy will deny the connection and ProxySQL will give back a proper error to the client. For Galera setups, both load balancers can elect a master node from the Galera cluster and only send the write operations to that specific node.
On the surface HAProxy and ProxySQL may seem to be similar solutions, but they differ a lot in features and the way they distribute connections and queries. HAProxy supports a number of balancing algorithms like least connections, source, random and round-robin while ProxySQL distributes connections using the weight-based round-robin algorithm (equal weight means equal distribution). Since ProxySQL is an intelligent proxy, it is database aware and is also able to analyze your queries. ProxySQL is able to do read/write splitting based on query rules where you can forward the queries to the designated slaves or master in your cluster. ProxySQL includes additional functionality like query rewriting, caching and query firewall with real-time, in-depth statistics generation about the workload.
That should be enough background information on this topic, so let’s see how you can deploy both load balancers for MySQL replication and Galera topologies.
Deploying HAProxy
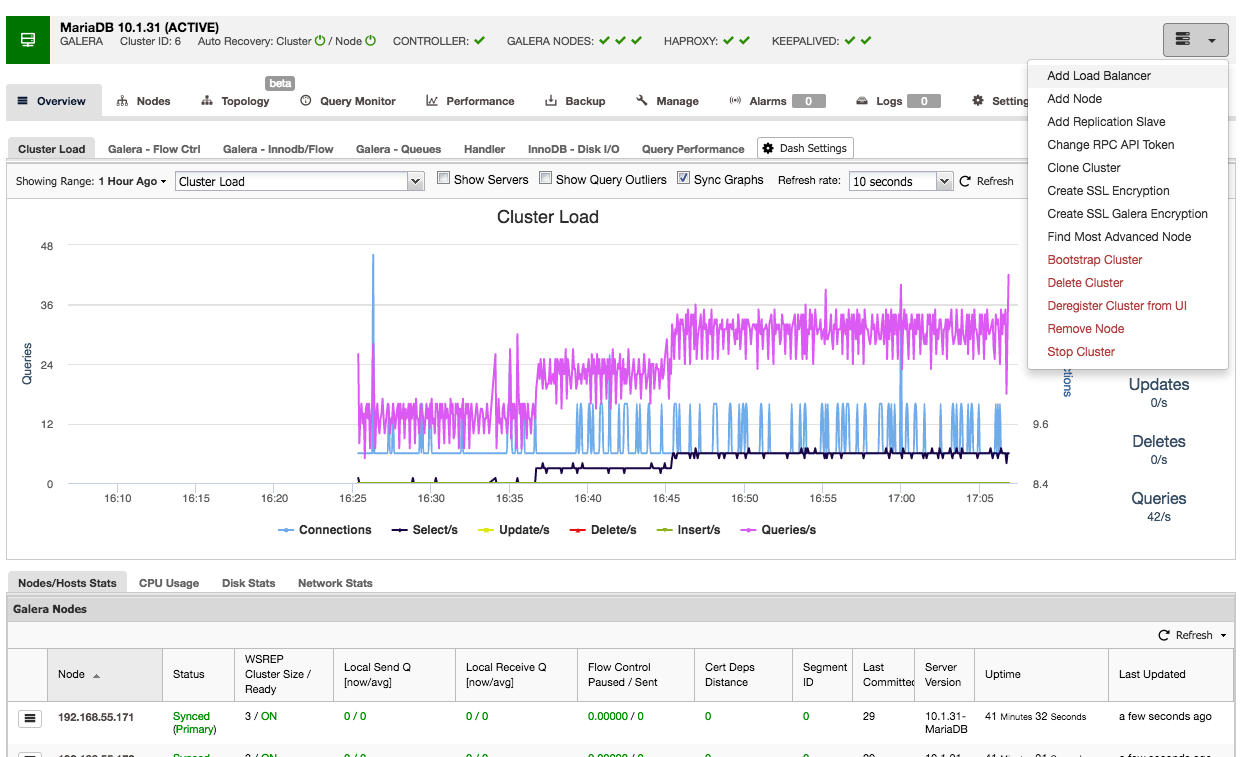
Using ClusterControl to deploy HAProxy on a Galera cluster is easy: go to the relevant cluster and select “Add Load Balancer”:
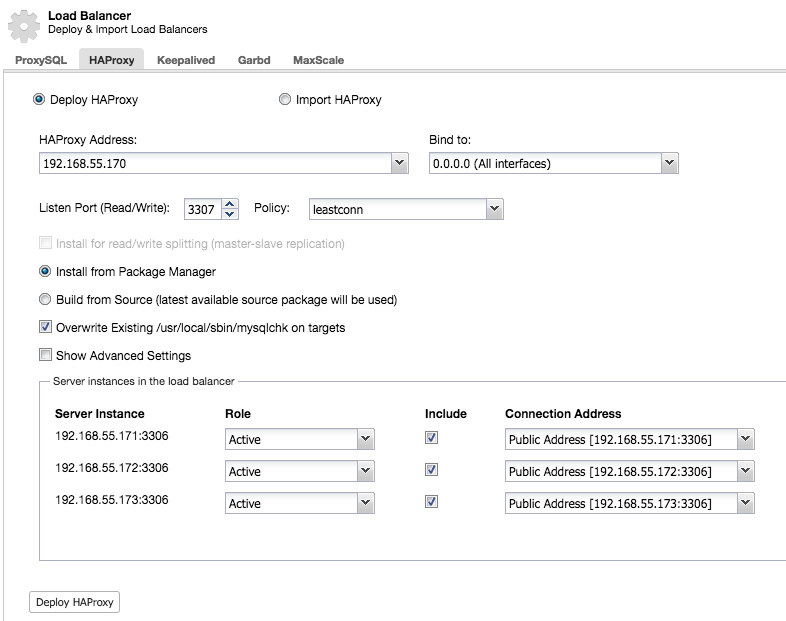
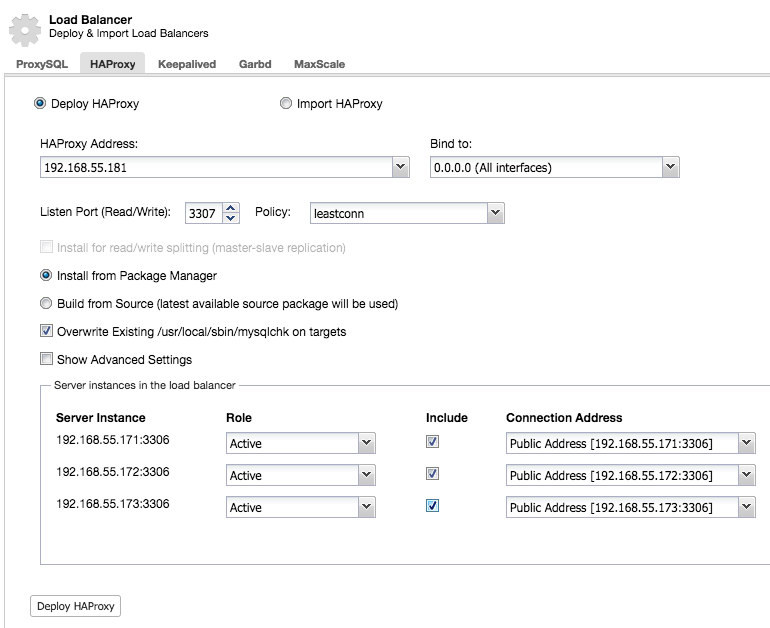
And you will be able to deploy an HAProxy instance by adding the host address and selecting the server instances you wish to include in the configuration:
By default the HAProxy instance will be configured to send connections to the server instances receiving the least number of connections, but you can change that policy to either round robin or source.
Under advanced settings you can set timeouts, maximum amount of connections and even secure the proxy by whitelisting an IP range for the connections.
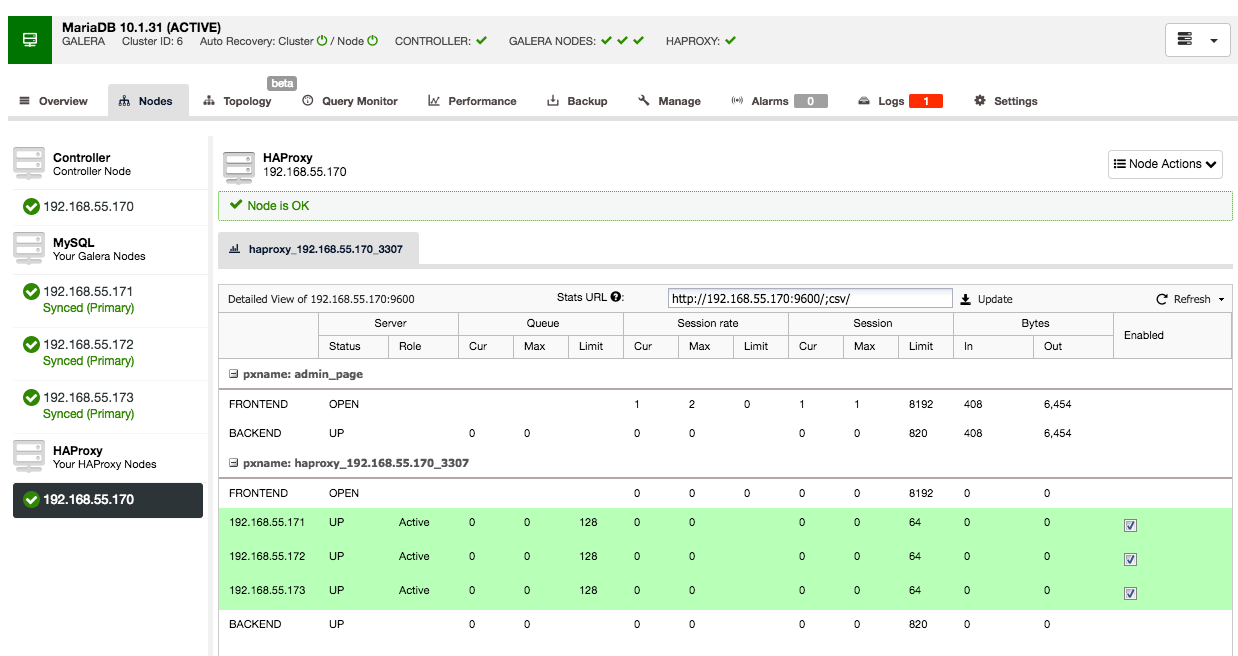
Under the nodes tab of that cluster, the HAProxy node will appear:
Now your Galera cluster is also available via the newly deployed HAProxy node on port 3307. Don’t forget to GRANT your application access from the HAProxy IP, as now the traffic will be incoming from the proxy instead of the application hosts. Also, remember to point your application connection to the HAProxy node.
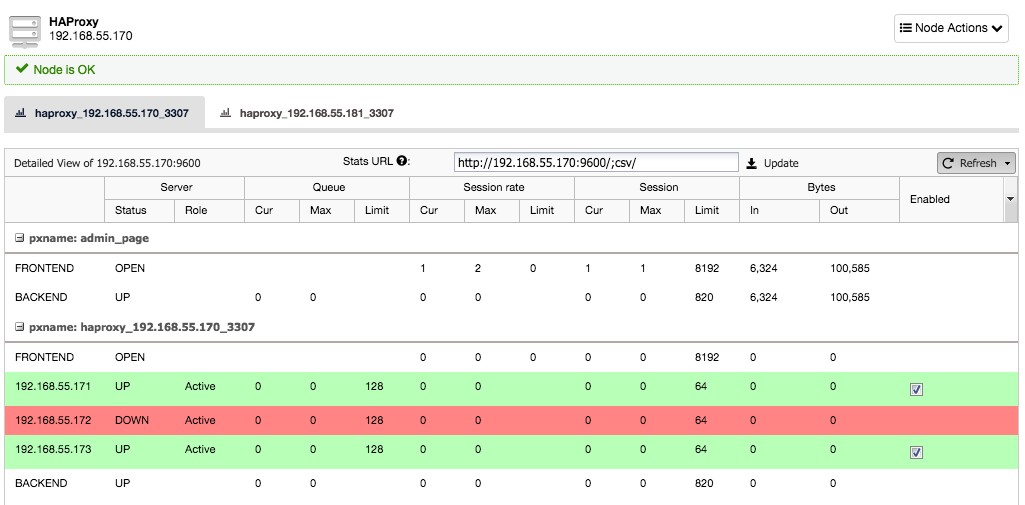
Now suppose the one server instance would go down, HAProxy will notice this within a few seconds and stop sending traffic to this instance:
The two other nodes are still fine and will keep receiving traffic. This retains the cluster highly available without the client even noticing the difference.
Deploying a secondary HAProxy node
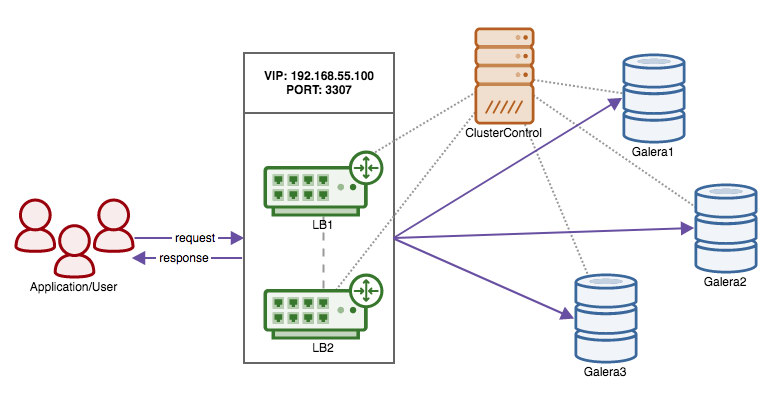
Now that we have moved the responsibility of retaining high availability over the database connections from the client to HAProxy, what if the proxy node dies? The answer is to create another HAProxy instance and use a virtual IP controlled by Keepalived as shown in this diagram:
The benefit compared to using virtual IPs on the database nodes is that the logic for MySQL is at the proxy level and the failover for the proxies is simple.
So let’s deploy a secondary HAProxy node:
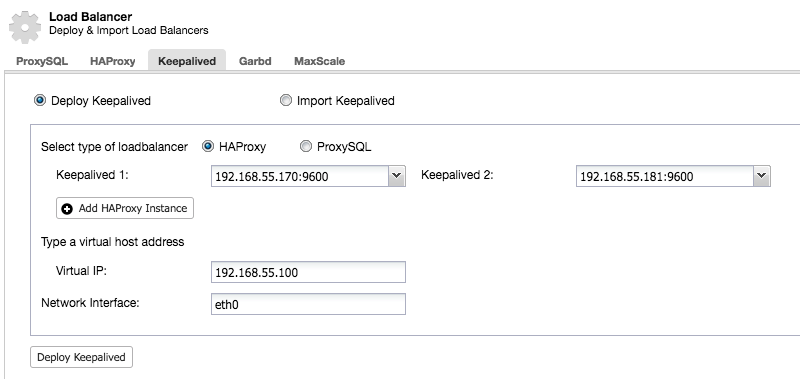
After we have deployed a secondary HAProxy node, we need to add Keepalived:
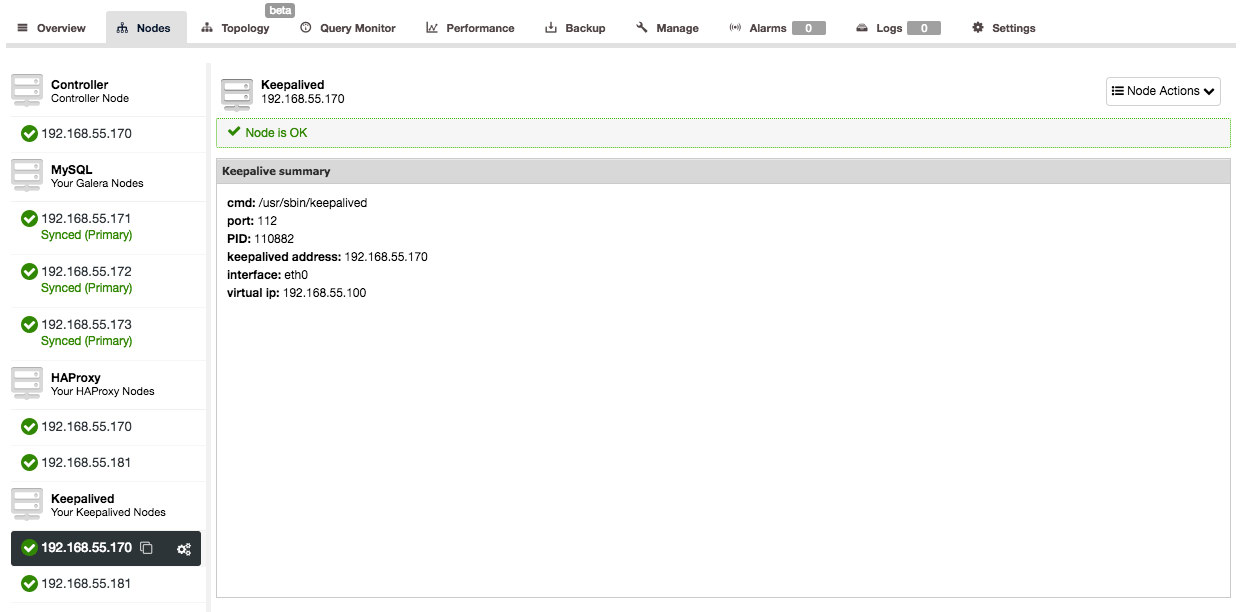
And after Keepalived has been added, your nodes overview will look like this:
So now instead of pointing your application connections to the HAProxy node directly you have to point them to the virtual IP instead.
In the example here, we used separate hosts to run HAProxy on, but you could easily add them to existing server instances as well. HAProxy does not bring much overhead, although you should keep in mind that in case of a server failure, you will lose both the database node and the proxy.
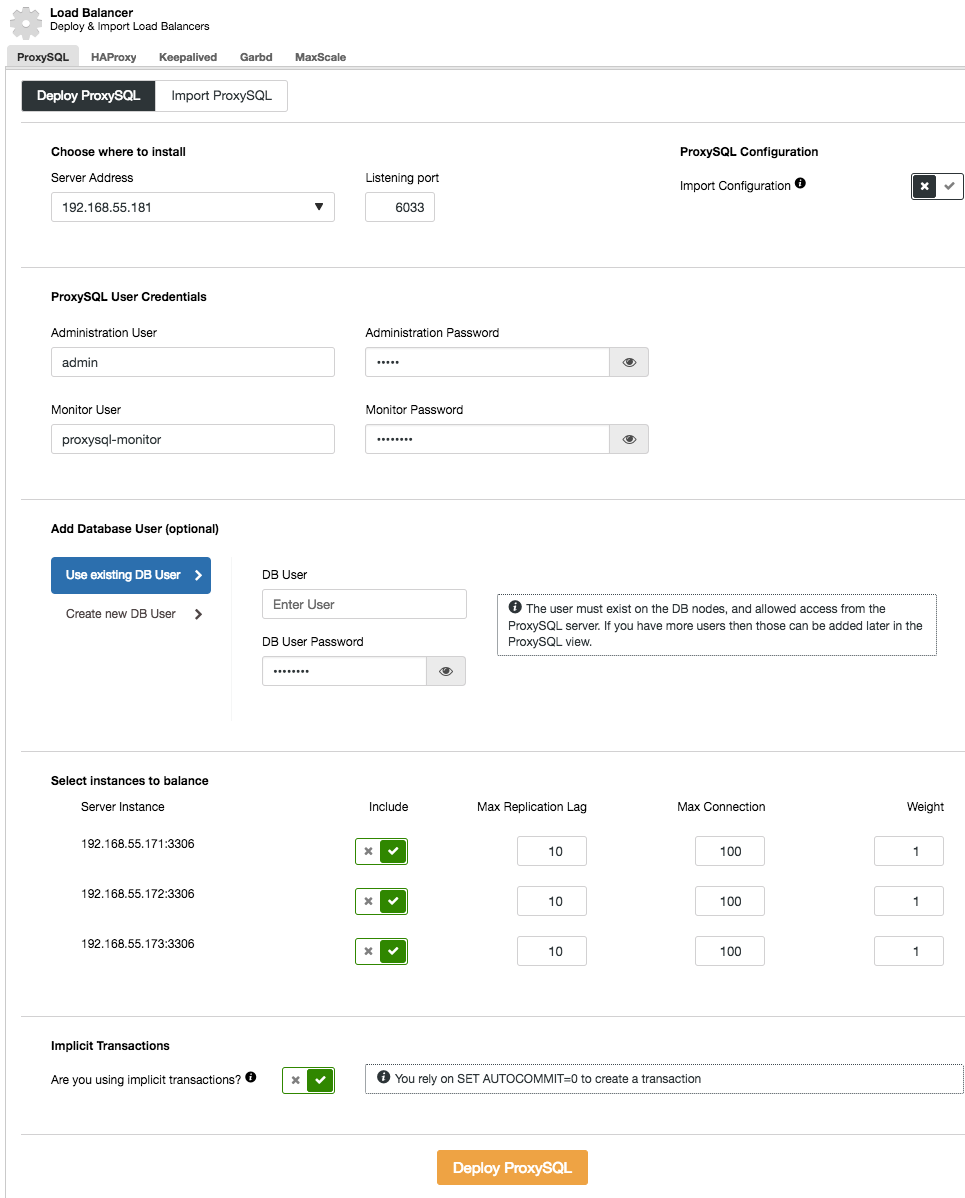
Deploying ProxySQL
Deploying ProxySQL to your cluster is done in a similar way to HAProxy: "Add Load Balancer" in the cluster list under ProxySQL tab.
In the deployment wizard, specify where ProxySQL will be installed, the administration user/password, the monitoring user/password to connect to the MySQL backends. From ClusterControl, you can either create a new user to be used by the application (the user will be created on both MySQL and ProxySQL) or use the existing database users (the user will be created on ProxySQL only). Set whether are you are using implicit transactions or not. Basically, if you don’t use SET autocommit=0 to create new transaction, ClusterControl will configure read/write split.
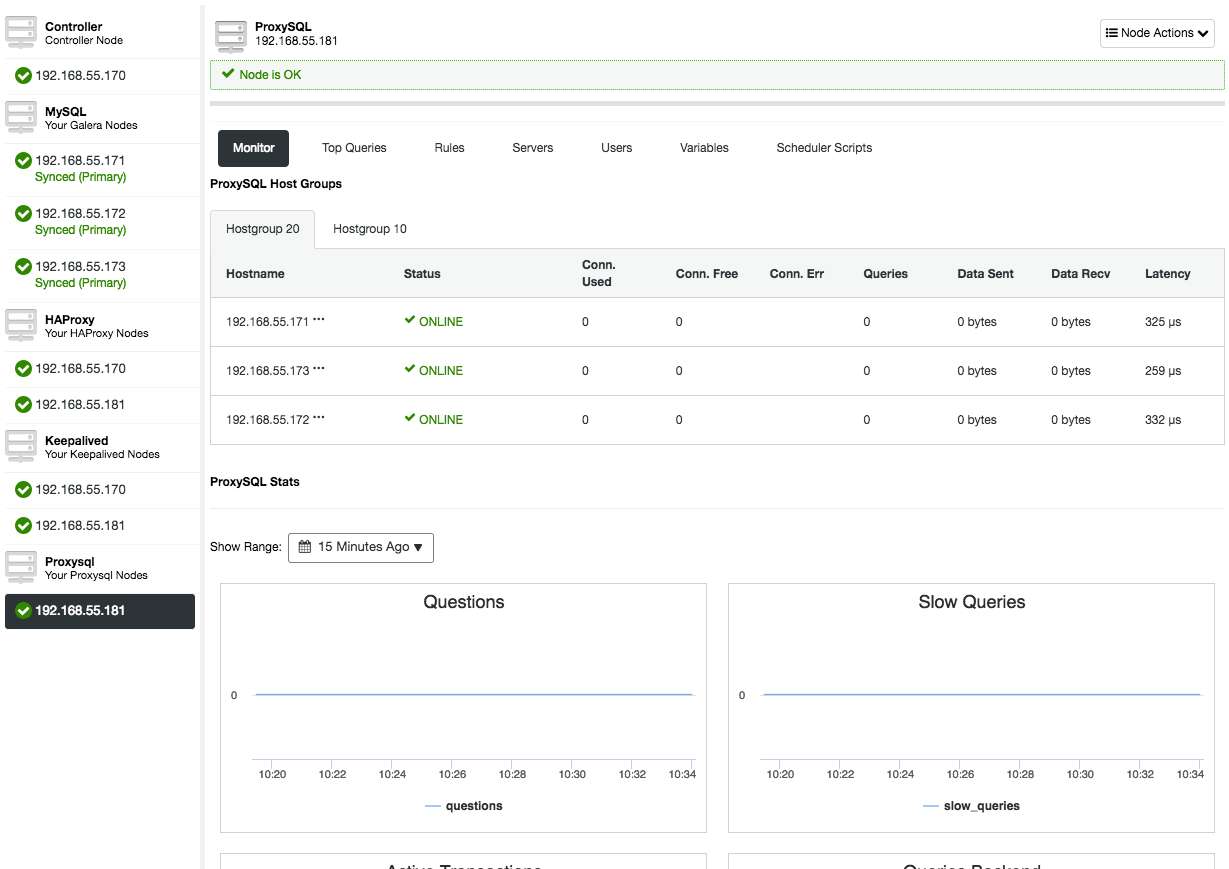
After ProxySQL has been deployed, it will be available under the Nodes tab:
Opening the ProxySQL node overview will present you the ProxySQL monitoring and management interface, so there is no reason to log into ProxySQL on the node anymore. ClusterControl covers most of the ProxySQL important stats like memory utilization, query cache, query processor and so on, as well as other metrics like hostgroups, backend servers, query rule hits, top queries and ProxySQL variables. In the ProxySQL management aspect, you can manage the query rules, backend servers, users, configuration and scheduler right from the UI.
Check out our ProxySQL tutorial page which covers extensively on how to perform database Load Balancing for MySQL and MariaDB with ProxySQL.
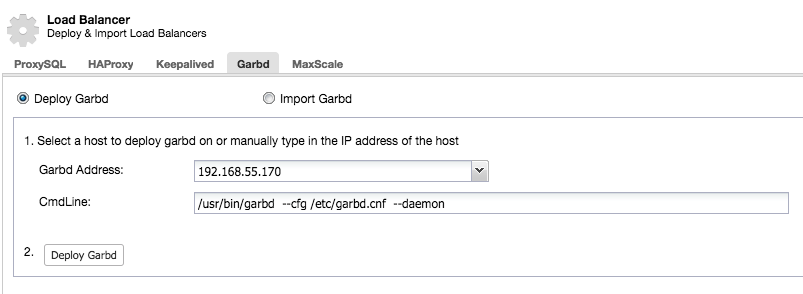
Deploying Garbd
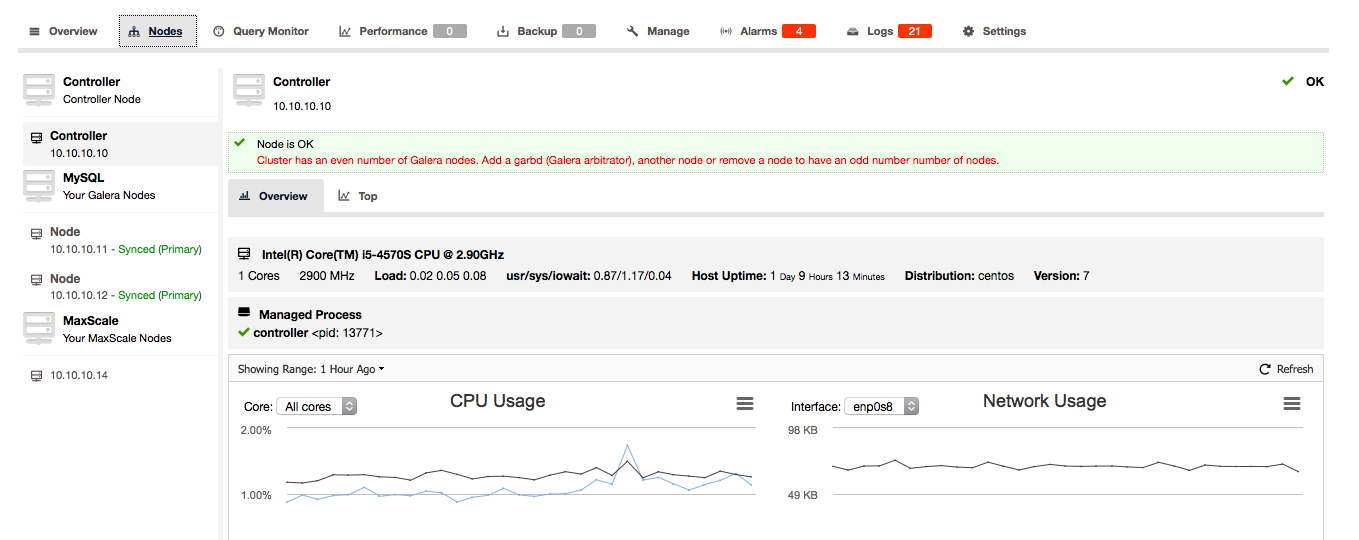
Galera implements a quorum-based algorithm to select a primary component through which it enforces consistency. The primary component needs to have a majority of votes (50% + 1 node), so in a 2 node system, there would be no majority resulting in split brain. Fortunately, it is possible to add a garbd (Galera Arbitrator Daemon), which is a lightweight stateless daemon that can act as the odd node. The added benefit by adding the Galera Arbitrator is that you can now do with only two nodes in your cluster.
If ClusterControl detects that your Galera cluster consists of an even number of nodes, you will be given the warning/advice by ClusterControl to extend the cluster to an odd number of nodes:
Choose wisely the host to deploy garbd on, as it will receive all replicated data. Make sure the network can handle the traffic and is secure enough. You could choose one of the HAProxy or ProxySQL hosts to deploy garbd on, like in the example below:
Take note that starting from ClusterControl 1.5.1, garbd cannot be installed on the same host as ClusterControl due to risk of package conflicts.
After installing garbd, you will see it appear next to your two Galera nodes:
We showed you how to make your MySQL master-slave and Galera cluster setups more robust and retain high availability using HAProxy and ProxySQL. Also garbd is a nice daemon that can save the extra third node in your Galera cluster.
This finalizes the deployment side of ClusterControl. In our next blog, we will show you how to integrate ClusterControl within your organization by using groups and assigning certain roles to users.
Percona has developed Percona XtraDB Cluster (based on Galera Cluster) and integrated it with ProxySQL to address MySQL high availability and clustering. These two products working together provide a great out-of-the-box synchronous replication setup.
In this webinar, we’ll look at why this is a great solution, and what types of deployments you should consider using it in.
Krunal is Percona XtraDB Cluster lead at Percona. He is responsible for day-to-day Percona XtraDB Cluster development, what goes into Percona XtraDB Cluster, bug fixes, releases, etc. Before joining Percona, he worked as part of InnoDB team at MySQL/Oracle. He authored most of the temporary table revamp work, undo log truncate, atomic truncate and a lot of other features. In the past, he was associated with Yahoo! Labs researching big data problems, and a database startup that is now part of Teradata. His interests mainly include data-management at any scale and he has been practicing it for more than decade.
Ramesh joined the Percona QA Team in March 2014. Prior to joining Percona, he provided MySQL database support to various service- and product-based Internet companies. Ramesh’s professional interests include writing shell/Perl scripts to automate routine tasks, and new technology. Ramesh lives in Kerala, the southern part of India, close to his family.
So first of all, if you are using an old connector or a connector (like the one for Go) not yet supporting caching_sha2_passwordas authentication plugin, you are still able to use the oldone. If you have created a new user for your application not supporting the new authentication method, you just have to run the following command (please use the right user account):
ALTER USER 'username'@'hostname' IDENTIFIED WITH 'mysql_native_password' BY 'password';
Let’s got back to the blog post now.
Situation
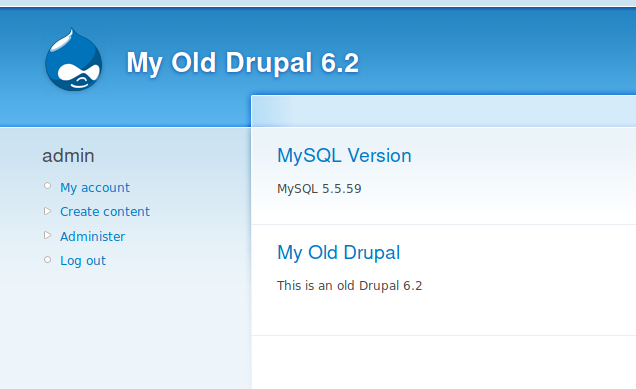
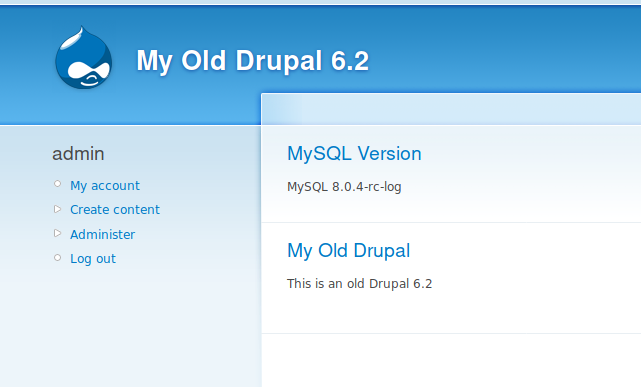
The exercise of this blog consists in the migration of the MySQL server 5.5.59 used by Druapl 6.2 to MySQL 8.0 without migrating to the latest Drupal version.
This is what we have now:
So far so good
MySQL Upgrade
In the MySQL Manual, we propose 2 different strategies:
The logical method consists of making a logical dump and I restore it, I won’t cover it here. The in-place method is as far as I know the most common one. However, there is something very important that people tend to forget: “Upgrade that skips versions is not supported. For example, upgrading directly from MySQL 5.6 to 8.0 is not supported.”
So know that this is clarified again, let’s continue with our plan.
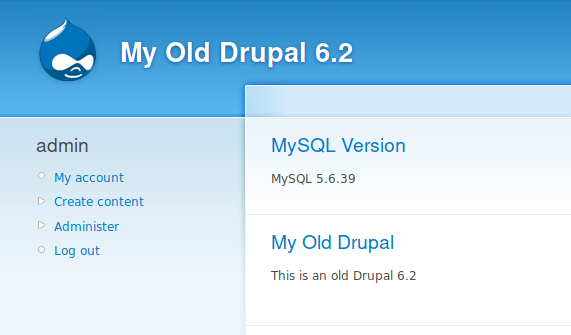
As we are using 5.5.59, the latest 5.5 version, we don’t need to upgrade the binaries to the latest 5.5, if we would use a older version of 5.5, I would have recommended to upgrade first to the latest version of the same major version too. Our first step is then to put our site in maintenance and then upgrade to the latest 5.6.
OH! We have a problem it seems… Did my user’s authentication method changed and my old PHP connector doesn’t support it ?
Let’s verify:
mysql> select Host, User, plugin from mysql.user where User like 'drup%';
+------+---------+-----------------------+
| Host | User | plugin |
+------+---------+-----------------------+
| % | drupal | mysql_native_password |
+------+---------+-----------------------+
1 rows in set (0.00 sec)
So that’s not the problem. As I said before, users authentication method is not changed. So this new default doesn’t break old applications…. but my site is still not working…
What’s wrong then ?
In fact, this old Drupal, uses a table name that is now part of the reserved keywords. It’s always advised to verify what are the new keywords reserved for MySQL itself. New features can also mean new keywords sometimes.
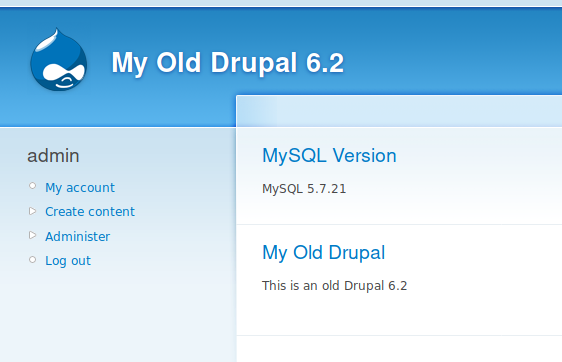
I searched in the code and I replaced all the calls to system table by `system` and now the result:
Conclusion
If you are using an old application, no the new authentication plugin doesn’t break your application, until you don’t create a new user for it and not specify an authentication method compatible with your connector. But of course other things, like reserved keywords in this case, can be problematic. This is why an major release upgrade always need to be tested in advance. Not only for schema and syntax compatibility but also for performance as the query execution plan might not be the one you expect event if in most cases the MySQL Optimizer becomes smarter and smarter with the releases and has the support of new features like the histograms.
And don’t forget that the new MySQL Shell includes a new utility checking your current environment to identify possible issues like the one covered in this article.
In this blog post, we’ll see how to use different mount points on PMM Docker deployments (Percona Monitoring and Management). This is useful if you want to use other mount points for the different directories, or even if you want to use a custom path that is not bound to Docker’s volumes directory (which is /var/lib/docker/volumes/ by default) within the same mount point.
There are two ways in which you can achieve this:
using symlinks after the pmm-data container is created
modifying the docker create command to use different directories
In the following examples, /pmm/ is used as the new base directory. One can, of course, choose different directories for each if needed. Also, remember to be aware of any SELinux or AppArmor policies you may have in place.
Using symlinks
For this, we need to follow these steps:
Create the needed directories
Create the pmm-data container
Move contents from default Docker paths to the desired paths
Create symlinks that point to the moved directories
Let’s see this with some commands and outputs. In this example, we will use /pmm/ as if it were the new mount point:
After this, we can start the pmm-server container (see below).
Running pmm-server container
After following either of the steps mentioned above, we can run the pmm-server container with the exact same commands as shown in the online documentation:
In this blog post, We will be explaining about the timeouts in SST on systemd implementation which we faced recently in Percona XtraDB Cluster during our Consulting with a client. State Snapshot Transfers (SST) refers to complete data sync from one of the nodes from the cluster to the joining node.
SST will happen for one or more reasons listed below.
Initial sync to join a node to cluster.
Node is out of cluster and lost its ability to join back due to data corruption or inconsistencies and also when the node went far behind the node, Starting point of recovery from gcache (Where recovery logs are written) is purged or rotated.
It’s very important to understand the timeout related to SST as in a large size cluster implementation, Where it’s going to take hours to complete the SST. If it fails on timeout in mid it can ruin your day.
We will be looking for SST timeouts on two large scale galera cluster implementations, Percona XtraDB Cluster and MariaDB Cluster with the systemd startup process.
Percona XtraDB Cluster (PXC):
PXC Version: 5.6.38
Systemd Service Script: /usr/lib/systemd/system/mysql.service
[Service]ExecStartPre=/usr/bin/mysql-systemd start-pre
# pre check script to check if an instance of mysql is already running and exit if it found one.ExecStart=/usr/bin/mysqld_safe --basedir=/usr
# when it passes pre check it goes and starts MySQLExecStartPost=/usr/bin/mysql-systemd start-post $MAINPID
# post check script to verify the pid is created and server is running.# startup will complete when the post script returns success.
When the nodes goes for SST, Startup script will be waiting on ExecStartPost to give OK.
We can see, post check script calls /usr/bin/mysql-systemd with argument start-post, It goes through the below switch case call.
"start-post")
wait_for_pid created"$pid_path"; ret=$?
if [[ $ret -eq 1 ]];then
log_failure_msg "MySQL (Percona XtraDB Cluster) server startup failed!"
elif [[ $ret -eq 2 ]];then
log_info_msg "MySQL (Percona XtraDB Cluster) server startup failed! State transfer still in progress"
fi
exit $ret
;;
Inside start-post,wait_for_pid function is invoked with argument created and pid path. Script will then be looping through wait_for_pid function until the SST completes.
Just pasting the code related to this discussion from the function wait_for_pid.
i=0
while [[ $i -lt $service_startup_timeout ]]; do
    if [[ $verb = 'created' ]];then
        if ([[ -e $sst_progress_file ]] || grep -q -- '--wsrep-new-cluster' <<< "$env_args" ) \
        && [[ $startup_sleep -ne 10 ]]; then
            echo "State transfer in progress, setting sleep higher"
            startup_sleep=10
        fi
    fi
    i=$(( i+1 ))
    sleep $startup_sleep
done
This while loop tries for service_startup_timeout number of times, Each time it waits for startup_sleep of 10 sec, The value for service_startup_timeout is hardcoded in the script as 900.
service_startup_timeout=900
So, SST will only wait for only 900 * 10 = 9000 Seconds = 2 hrs 30 min to complete on systemd implementation and It timeout after that.
For a cluster of huge size, Its’ a bottleneck, For a bigger data set SST can take more time, Failing in middle is very bad thing that can happen. Error it throws when such event happens is misleading and it’s not clear.
Testing:
In our testing with PXC Version: 5.6.38 and OS: Centos 7 of data set 1.5 TB, SST timed out in middle when almost 700G copied in approx. 2 hrs 30 min.
Error Logs:
Joiner:
2018-03-14 19:13:04 16392 [Note] WSREP: Member 2.0 (node4) requested state transfer from 'node3'. Selected 1.0 (node3)(SYNCED) as donor.
WSREP_SST: [INFO] Waiting for SST streaming to complete! (20180314 19:13:05.350)
WSREP_SST: [ERROR] Removing /data/mysql//.sst/xtrabackup_galera_info file due to signal (20180314 21:42:44.532)
WSREP_SST: [ERROR] Cleanup after exit with status:143 (20180314 21:42:44.535)
2018-03-14 21:42:44 16392 [ERROR] WSREP: SST failed: 2 (No such file or directory)
SST Duration: 19:13:04 – 21:42:44 ~ Timeout In 2 hrs 30 min
Solutions:
Method 1:
Edit /usr/bin/mysql-systemd file and set service_startup_timeout from 900 to a much higher value. In our case, We have set it to 8 hours (2880). (2880*10)/60/60 = 8 hrs
# sed -i ‘s/service_startup_timeout=900/service_startup_timeout=2880/g’ /usr/bin/mysql-systemd
Method 2:
On /usr/bin/mysql-systemd, We can see it is also reading this variable from mysqld_safe tag
On Linux distributions that use #systemd# you man need to increase the service startup timeout as the default timeout of 20 minutes may not be sufficient if a SST becomes necessary
create a file /etc/systemd/system/mariadb.service.d/timeout.conf with the following data. [Service] TimeoutSec=infinity
If you are using a systemd version older than version 229 you have to replace infinity with 0
Execute # systemctl daemon-reload after the change for the new timeout setting to take effect.
It’s also very interesting that, It has provided with very good documentation on the systemd startup script and variable details. you can read at the following link.
mariadb-service-convert script to generate the systemd startup script variables from /etc/my.cnf is just fascinating. I m not going into much details on that as it’s out of the scope for this blog. I really admire the fact, the documentation is very clear.


 Join Percona Chief Evangelist Colin Charles as he covers happenings, gives pointers and provides musings on the open source database community.
 — read
 Percona announces the release of