Quantcast
Channel: Planet MySQL
Viewing all 18816 articles
Browse latest View live

MySQL Cheat Sheet

$
0
0
So first I have posted in sometime as felt I should be. I have been very busy still working with MySQL and all related forks and failed to put out blogs as I felt I should. So I will work on that.

Now That being said I recalled the other day a website I used to love because it was a common VI cheat sheet list. The syntax you know , you know you need it, but type it 3 times until it right. When it does get entered right you look at it dumbfounded , I thought I wrote that already.

So I figured why not a simple list of common MySQL commands that we all either type 50 times a month or should know like the back of our hand but forget when the client is looking over our shoulder.
For starters..
We set up a new MySQL 5.7.6+ server and log in..
Need to change password before we can do anything. But it is Alter user not Set pass.
We want to know how to read the password still as it is in clear text.

ALTER USER
ALTER USER 'root'@'localhost' IDENTIFIED BY 'MyNewPass';
Set Password is
SET PASSWORD FOR 'bob''@'localhost' = PASSWORD('cleartext password');

Purge Binary Logs
PURGE BINARY LOGS TO 'mysql-bin.010';
PURGE BINARY LOGS BEFORE '2008-04-02 00:00:00
PURGE BINARY LOGS BEFORE NOW() - interval 3 DAY;


MySQL Dump
# COMPACT WILL REMOVE DROP STATEMENTS
mysqldump --events --master-data=2 --routines --triggers --compact --all-databases > db.sql
mysqldump --events --master-data=2 --routines --triggers --all-databases > NAME.sql
mysqldump --opt --routines --triggers dbname > dbname.sql
mysqldump --opt --routines --triggers --no-create-info joomla jforms > dataonly.sql

Turn off Foreign Keys for a moment
SET GLOBAL foreign_key_checks=0;


Skip Grants
/usr/bin/mysqld_safe --defaults-file=/etc/mysql/my.cnf --skip-grant-tables
vi /etc/mysql/my.cnf
[mysqld]
skip-grant-tables


BinLog reviews
--base64-output=DECODE-ROWS & --verbose
mysqlbinlog --defaults-file=/home/anothermysqldba/.my.cnf --base64-output=DECODE-ROWS --verbose binlog.005862 > 005862.sql


MYSQL SECURE CLIENT
mysql_config_editor print --all
mysql_config_editor set --user=mysql --password --login-path=localhost --host=localhost
mysql --login-path=localhost -e 'SELECT NOW()';


Swap
sudo swapoff -a
To set the new value to 10: echo 10 | sudo tee /proc/sys/vm/swappiness
sudo swapon -a

IF INFORMATION SCHEMA IS SLOW
set global innodb_stats_on_metadata=0;

AWS Variables
CALL mysql.rds_show_configuration;
> call mysql.rds_set_configuration('binlog retention hours', 24);
> call mysql.rds_set_configuration('slow_launch_time', 2);


Find what table a column name is in
SELECT TABLE_SCHEMA , TABLE_NAME , COLUMN_NAME FROM information_schema.COLUMNS WHERE COLUMN_NAME = 'fieldname' ;
Client says it is in TableA but they have 50 databases.. What schema has TableA
SELECT TABLE_SCHEMA , TABLE_NAME FROM information_schema.TABLES WHERE TABLE_NAME = 'TableA' ;

Adjust Slave workers
Select @@slave_parallel_workers;
Stop Slave; Set GLOBAL  slave_parallel_workers=5; Start Slave;


MySQL Multi
5.6>
To start both : mysqld_multi start 1,2
To check on status of both: mysqld_multi report 1,2
To check on status or other options you can use just one

5.7<
[mysqld1] BECOMES [mysqld@mysqld1]
systemctl start mysqld@mysqld1
systemctl start mysqld@mysqld2
systemctl start mysqld@mysqld3
systemctl start mysqld@mysqld4
MySQL Upgrade System tables only
mysql_upgrade --defaults-file=/home/anothermysqldba/.my.cnf --upgrade-system-tables

SKIP REPLICATION ERROR
STOP SLAVE; SET GLOBAL sql_slave_skip_counter =1; START SLAVE; SELECT SLEEP(1); SHOW SLAVE STATUS\G

MySQL 8.0.4rc

$
0
0
MySQL 8.0.4rc was just released as "Pre-General Availability Draft: 2018-03-19".

I decided to take a quick peek and note my impressions here.  Some of this is old news for many as this release has been talked about for awhile but I added my thoughts anyway.. 

First thing I noticed was a simple issue of using the updated mysql client. My older version was still in my path that resulted in 

ERROR 2059 (HY000): Authentication plugin 'caching_sha2_password' cannot be loaded
So simple fix and make sure you are using the valid updated mysql client. Of course other options existed like changing the authentication plugin back to  mysql_native_password but why bother, use the secure method.  This is a very good enhancement for security so do not be shocked if you have some connection issues while you get your connections using this more secure method. 


Welcome to the MySQL monitor.  Commands end with ; or \g.
Your MySQL connection id is 36
Server version: 8.0.4-rc-log

Copyright (c) 2000, 2018, Oracle and/or its affiliates. All rights reserved.

So the first very cool enhancement... 

mysql> show create table user\G
*************************** 1. row ***************************
       Table: user
Create Table: CREATE TABLE `user` (
  `Host` char(60) COLLATE utf8_bin NOT NULL DEFAULT '',
  `User` char(32) COLLATE utf8_bin NOT NULL DEFAULT '',
  `Select_priv` enum('N','Y') CHARACTER SET utf8 NOT NULL DEFAULT 'N',
  `Insert_priv` enum('N','Y') CHARACTER SET utf8 NOT NULL DEFAULT 'N',
  `Update_priv` enum('N','Y') CHARACTER SET utf8 NOT NULL DEFAULT 'N',
  `Delete_priv` enum('N','Y') CHARACTER SET utf8 NOT NULL DEFAULT 'N',
  `Create_priv` enum('N','Y') CHARACTER SET utf8 NOT NULL DEFAULT 'N',
  `Drop_priv` enum('N','Y') CHARACTER SET utf8 NOT NULL DEFAULT 'N',
  `Reload_priv` enum('N','Y') CHARACTER SET utf8 NOT NULL DEFAULT 'N',
  `Shutdown_priv` enum('N','Y') CHARACTER SET utf8 NOT NULL DEFAULT 'N',
  `Process_priv` enum('N','Y') CHARACTER SET utf8 NOT NULL DEFAULT 'N',
  `File_priv` enum('N','Y') CHARACTER SET utf8 NOT NULL DEFAULT 'N',
  `Grant_priv` enum('N','Y') CHARACTER SET utf8 NOT NULL DEFAULT 'N',
  `References_priv` enum('N','Y') CHARACTER SET utf8 NOT NULL DEFAULT 'N',
  `Index_priv` enum('N','Y') CHARACTER SET utf8 NOT NULL DEFAULT 'N',
  `Alter_priv` enum('N','Y') CHARACTER SET utf8 NOT NULL DEFAULT 'N',
  `Show_db_priv` enum('N','Y') CHARACTER SET utf8 NOT NULL DEFAULT 'N',
  `Super_priv` enum('N','Y') CHARACTER SET utf8 NOT NULL DEFAULT 'N',
  `Create_tmp_table_priv` enum('N','Y') CHARACTER SET utf8 NOT NULL DEFAULT 'N',
  `Lock_tables_priv` enum('N','Y') CHARACTER SET utf8 NOT NULL DEFAULT 'N',
  `Execute_priv` enum('N','Y') CHARACTER SET utf8 NOT NULL DEFAULT 'N',
  `Repl_slave_priv` enum('N','Y') CHARACTER SET utf8 NOT NULL DEFAULT 'N',
  `Repl_client_priv` enum('N','Y') CHARACTER SET utf8 NOT NULL DEFAULT 'N',
  `Create_view_priv` enum('N','Y') CHARACTER SET utf8 NOT NULL DEFAULT 'N',
  `Show_view_priv` enum('N','Y') CHARACTER SET utf8 NOT NULL DEFAULT 'N',
  `Create_routine_priv` enum('N','Y') CHARACTER SET utf8 NOT NULL DEFAULT 'N',
  `Alter_routine_priv` enum('N','Y') CHARACTER SET utf8 NOT NULL DEFAULT 'N',
  `Create_user_priv` enum('N','Y') CHARACTER SET utf8 NOT NULL DEFAULT 'N',
  `Event_priv` enum('N','Y') CHARACTER SET utf8 NOT NULL DEFAULT 'N',
  `Trigger_priv` enum('N','Y') CHARACTER SET utf8 NOT NULL DEFAULT 'N',
  `Create_tablespace_priv` enum('N','Y') CHARACTER SET utf8 NOT NULL DEFAULT 'N',
  `ssl_type` enum('','ANY','X509','SPECIFIED') CHARACTER SET utf8 NOT NULL DEFAULT '',
  `ssl_cipher` blob NOT NULL,
  `x509_issuer` blob NOT NULL,
  `x509_subject` blob NOT NULL,
  `max_questions` int(11) unsigned NOT NULL DEFAULT '0',
  `max_updates` int(11) unsigned NOT NULL DEFAULT '0',
  `max_connections` int(11) unsigned NOT NULL DEFAULT '0',
  `max_user_connections` int(11) unsigned NOT NULL DEFAULT '0',
  `plugin` char(64) COLLATE utf8_bin NOT NULL DEFAULT 'caching_sha2_password',
  `authentication_string` text COLLATE utf8_bin,
  `password_expired` enum('N','Y') CHARACTER SET utf8 NOT NULL DEFAULT 'N',
  `password_last_changed` timestamp NULL DEFAULT NULL,
  `password_lifetime` smallint(5) unsigned DEFAULT NULL,
  `account_locked` enum('N','Y') CHARACTER SET utf8 NOT NULL DEFAULT 'N',
  `Create_role_priv` enum('N','Y') CHARACTER SET utf8 NOT NULL DEFAULT 'N',
  `Drop_role_priv` enum('N','Y') CHARACTER SET utf8 NOT NULL DEFAULT 'N',
  `Password_reuse_history` smallint(5) unsigned DEFAULT NULL,
  `Password_reuse_time` smallint(5) unsigned DEFAULT NULL,
  PRIMARY KEY (`Host`,`User`)
) /*!50100 TABLESPACE `mysql` */ ENGINE=InnoDB DEFAULT CHARSET=utf8 COLLATE=utf8_bin STATS_PERSISTENT=0 COMMENT='Users and global privileges'
1 row in set (0.00 sec)

Yep user table is InnoDB and has own TableSpace. 

With the addition of the new Data Dictionary you will now notice Information_schema changes. 
So as a simple example the Columns table historically has not been a view but that has now changed , along with many others as you can see via the url provided. 


mysql> show create table COLUMNS \G
*************************** 1. row ***************************
                View: COLUMNS
         Create View: CREATE ALGORITHM=UNDEFINED DEFINER=`mysql.infoschema`@`localhost` 

This appears to be done to help performance with the information_schema but removing the temporary table creations per queries into the information_schema. 

Chapter 14 of the documentation goes into depth on this, the provided url below will help you find more information and future blog posts might touch more on this. 
The previously mentioned Data Dictionary then also leads into the ability to have atomic Data Definition Language (DDL) statements or  atomic DDL. 


This is likely to trip up a few transactions if you do not review your queries before setting up replication to a new MySQL 8.0 instance. I say that because of how the handling of table maintenance could be impacted. If you write clean queries with "If Exists" it won't be a big problem. Overall it is a more transaction based feature that protects your data and rollback options. 


Resource management looks very interesting and I will have to take more time to focus on this as it is a new feature with MySQL 8.0. Overall you can assign groups and no longer have to set priority of query but let your grouping define how a query should behave and resources allotted to it. 

mysql> select @@version;
+------------+
| @@version  |
+------------+
| 5.7.16-log |
+------------+
1 row in set (0.00 sec)

mysql> desc INFORMATION_SCHEMA.RESOURCE_GROUPS;
ERROR 1109 (42S02): Unknown table 'RESOURCE_GROUPS' in information_schema

mysql> select @@version;
+--------------+
| @@version    |
+--------------+
| 8.0.4-rc-log |
+--------------+
1 row in set (0.00 sec)

mysql> desc INFORMATION_SCHEMA.RESOURCE_GROUPS;
+------------------------+-----------------------+------+-----+---------+-------+
| Field                  | Type                  | Null | Key | Default | Extra |
+------------------------+-----------------------+------+-----+---------+-------+
| RESOURCE_GROUP_NAME    | varchar(64)           | NO   |     | NULL    |       |
| RESOURCE_GROUP_TYPE    | enum('SYSTEM','USER') | NO   |     | NULL    |       |
| RESOURCE_GROUP_ENABLED | tinyint(1)            | NO   |     | NULL    |       |
| VCPU_IDS               | blob                  | YES  |     | NULL    |       |
| THREAD_PRIORITY        | int(11)               | NO   |     | NULL    |       |
+------------------------+-----------------------+------+-----+---------+-------+
5 rows in set (0.00 sec)


More insight into your InnoDB buffer pool cache in regards to the indexes that are in it is now available. 

mysql> desc INFORMATION_SCHEMA.INNODB_CACHED_INDEXES ;
+----------------+---------------------+------+-----+---------+-------+
| Field          | Type                | Null | Key | Default | Extra |
+----------------+---------------------+------+-----+---------+-------+
| SPACE_ID       | int(11) unsigned    | NO   |     |         |       |
| INDEX_ID       | bigint(21) unsigned | NO   |     |         |       |
| N_CACHED_PAGES | bigint(21) unsigned | NO   |     |         |       |
+----------------+---------------------+------+-----+---------+-------+
3 rows in set (0.01 sec)


If you are unsure what to set the InnoDB Buffer pool , log_sizes or flush method MySQL will set these for you now based on the available memory. 

innodb_dedicated_server

[mysqld]
innodb-dedicated-server=1

mysql> select @@innodb_dedicated_server;
+---------------------------+
| @@innodb_dedicated_server |
+---------------------------+
|                         1 |
+---------------------------+

This simple test set my innodb_buffer_pool_size to 6GB  for example when the default is 128MB. 

Numerous JSON additions have been made as well as regular expression changes. Both of which look promising. 

The only replication enhancement per this release itself is that is now supports binary logging of partial updates to JSON documents using a compact binary format. 

However overall many features are available ( you can read all about them here) ,  one of which (I wish my client had tomorrow ) is replication filers per channel. 
My test instance already had binary logs enabled, but they are on by default now along with TABLE based versus file based master & slave info, ( big fan of having that transaction based by default )

Overall keep in mind this is just a first glance at this release and very high level thoughts on it, many other changes exist. Looking over other blog posts about this release as well as the manual and release notes will also help. Certainly download and review as it looks to be very promising for administration, security and replication points of view. 

Fun With Bugs #62 - On Bugs Related to JSON Support in MySQL

$
0
0
Comparing to "online ALTER" or FULLTEXT indexes in InnoDB, I am not that much exposed to using JSON in MySQL. OK, there is EXPLAIN ... FORMAT=JSON statement that is quite useful, optimizer trace in MySQL is also in JSON format, but otherwise I rarely have to even read this kind of data since my lame attempt to pass one introductory MongoDB training couse back in 2015 (when I mostly enjoyed mongo shell). Even less I care about storing JSON in MySQL.

But it seems community users do use it, and there is a book for them... So, out of pure curiosity last week I decided to check known bugs reported by MySQL Community users that are related to this feature (it has a separate category "MySQL Server: JSON" in public bugs database. This is a (short enough) list of my findings:
  • Bug #89543 - "stack-overflow on gis.geojson_functions / json.json_functions_innodb". This is a recent bug report from Laurynas Biveinis. Based on last comment, it may have something to do with specific GCC compiler version and exact build option (WITH_UBSAN=ON) used. But for me it's yet another indication that community (Percona's in this case) extra QA still matters for MySQL quality. 
  • Bug #88033 - "Generated INT column with value from JSON document". As Geert Vanderkelen says: "would be great if JSON null is NULL".
  • Bug #87440 - "use union index,the value of key_len different with used_key_parts’ value." This is actually a bug in optimizer (or EXPLAIN ... FORMAT=JSON), but as it is still "Open" and nobody cared to check it, it still stays in the wrong category.
  • Bug #85755 - "JSON containing null value is extracted as a string "null"". Similar to Geert's case above, Dave Pullin seems to need an easy way to get real NULL in SQL when the value is null in JSON. It is stated in comments that now everything works as designed, and it works exactly the same in MariaDB 10.2.13. Some users are not happy though and the bug remains still "Verified".
  • Bug #84082 - "JSON_OBJECT("k", dateTime) adds milliseconds to time". In MariaDB 10.2.13 the result is different:
    MariaDB [(none)]> SELECT version(), JSON_OBJECT("k", cast("2016-11-19 17:46:31" as datetime(0)));
    +-----------------+--------------------------------------------------------------+
    | version()       | JSON_OBJECT("k", cast("2016-11-19 17:46:31" as datetime(0))) |
    +-----------------+--------------------------------------------------------------+
    | 10.2.13-MariaDB | {"k": "2016-11-19 17:46:31"}                                 |
    +-----------------+--------------------------------------------------------------+
    1 row in set (0.00 sec)
  • Bug #83954 - "JSON handeling of DECIMAL values, JSON from JSON string". Take care when you cast values to JSON type.
  • Bug #81677 - "Allows to force JSON columns encoding into pure UTF-8". This report is still "Open" and probably everything works as designed.
  • Bug #79813 - "Boolean values are returned inconsistently with JSON_OBJECT". Take care while working with boolean properties.
  • Bug #79053 - "Second argument "one" to JSON_CONTAINS_PATH is a misnomer". Nice request from Roland Bouman to use "some" instead of "one" in this case. Probably too late to implement it...
There also several related feature requests, of them the following are still "Open":
  • Bug #84167 - "Managing deeply nested JSON documents with JSON_SET, JSON_MERGE". As a comment says, "It would by nice if MySQL came up with a solution for this in a more constructive way".
  • Bug #82311 - "Retrieve the last value of an array (JSON_POP)". I am not 100% sure what the user wants here, but even I can get last array element in MongoDB using $slice, for example:
    > db.text.find();
    { "_id" : ObjectId("5aafe41c6bd09c09625aa3d1"), "item" : "test" }
    { "_id" : ObjectId("5ab0e8c208d6fe081ebb4f40"), "item" : null }
    { "_id" : ObjectId("5ab0f0f6cc695c62b4b0a301"), "item" : [ { "val" : 10 }, { "val" : 11 } ] }
    > db.text.find({}, { item: { $slice: -1 }, _id: 0});
    { "item" : "test" }
    { "item" : null }
    { "item" : [ { "val" : 11 } ] }
    >
  • Bug #80545 - "JSON field should be allow INDEX by specifying table_flag". It seems some 3rd party storage engine developers want to have a way to crate and use some nice indexes of their engines to get efficient index-based search in JSON documents.
  • Bug #80349 - "MySQL 5.7 JSON: improve documentation and possible improvements". Simon Mudd asked for more documentation on the way feature is designed (for those interested in the details of JSON data type implementation in modern MySQL versions there is a detailed enough public worklog, WL#8132) and asked some more questions. Morgan Tocker answered at least some of them, but this report still stays "Open" since that times...
It would be great for remaining few "Open" reports from community users to be properly processed, and a couple of real bugs identified fixed. There are also features to work on, and in the meantime workarounds and best practices should be shared. Maybe there are enough of them for the entire book.

That's almost all I have to say about JSON in MySQL at the moment.

Join Pythian at Percona Live 2018

$
0
0

Percona Live 2018 is coming up soon, and Pythian is excited to be participating again this year. The Percona Live Open Source Database Conference is the premier open source database event for individuals and businesses that develop and use open source database software. This year the conference will take place April 23 – April 25 in Santa Clara, California. Once again Pythian will be hosting the highly anticipated Pythian Community Dinner on Tuesday, April 24th at Pedro’s Restaurant and Cantina.

We’ve also got a fantastic lineup up of speakers. You’ll want to make sure you register for the following sessions:

Monday, April 23, 2018

9:30 am – 12: 30 pm PST

  • Derek Downey will present “Hands on ProxySQL”
  • Matthias Crauwels & Pep Pla will present “MySQL Break/Fix Lab”

Tuesday, April 24, 2018

1:30 am – 12: 30 pm

  • Igor Donchovski will present “How to scale MongoDB”

11:30 am – 12:20 pm PST

  • Gabriel Ciciliani will present “Running database services on DC/OS”

Wednesday, April 25, 2018

11:00 am – 11:50 am

  • Igor Donchvski will present “Securing Your Data: All Steps for Encrypting Your MongoDB Database”

REGISTER FOR THE PYTHIAN COMMUNITY DINNER


 Visit the Percona Live site for more information. We look forward to seeing you at the show!

The case against auto increment in MySQL

$
0
0

Introduction

In my travels to visit many customers over the last few years, I often see my customers creating many or all of their MySQL InnoDB tables using auto-increment primary keys. Many Object Relational Mappers do this by default on behalf of the user. Once the tables are all created with auto increment primary keys, then the database designer/developer goes about assigning alternate keys that they will actually use to access the data. Most of the time the auto-increment key is simply there to ensure that there is a unique key on the table and it’s often not used as an access path. This is a common design pattern, but is it the best way to create tables using MySQL? I am witting this blog to present the case that it’s a pretty bad idea most of the time.

Why it’s a bad Idea

There are four reasons why, which I will explain in some depth later in the post but for now, they are:

  • Auto increment keys used indiscriminately are a waste of the primary key access which is always the fastest way to get to a row in a table.
  • Auto increment locks can and do impact concurrency and scalability of your database.
  • In an HA replication environment using standard Async Replication, auto increment risks orphan rows during a master failure event.
  • If you are lucky enough to need to scale writes beyond a single server and end up having to shard auto increment no longer produces unique keys.

What are the alternatives

What can I use instead you might ask? Well, there are a few  good answers to that as well.

  • Use UUID instead. It’s larger, uglier and even more meaningless looking than an auto increment key, but it avoids most, if not all, of the issues above.
  • My favorite, is to use a natural key. This is not always possible, but I often see tables with an auto increment primary key and then one or more unique secondary indexes. In this case, you simply replace the auto- increment key with your choice of already existing unique keys.
  • Use a custom roll your own custom key generator. This is probably worthy of a lengthy blog all on its own.

The problem cases in a bit more depth

The waste of a primary key

MySQL InnoDB stores tables store the table data as part of the primary key’s B-Tree. Storing data this way makes access by primary key fast it also helps to keep the table well organized during inserts and deletes minimizing the impact of fragmentation over time.

What this means is when access is made by a secondary index, first the secondary index B-Tree must be traversed and then the primary key index must be traversed. In addition, when the primary index is not used for access just to ensure uniqueness, there is the additional cost for maintaining a secondary index which could be the primary key index.

As a result, it will take 2x additional work to access rows via secondary key, extra writes to maintain an additional B-Tree and InnoDB buffer pool space consumed by an additional B-Tree.

auto increment PK means secondary unique index

Unique secondary index with primary key in InnnoDB

Auto-increment locks

When an insert is performed on a table with an auto increment key table level lock is placed on the table for inserts only until the transaction in which the insert is performed commits.

When auto-commit is on, this lock lasts for a very short time. If the application is using manual commits, the lock will be maintained for a longer period.

In some cases, I have seen this lock result in deadlocks when two or more transactions insert into multiple tables in differing order. Always a bad idea, but the very low granularity of auto-increment locks causes this to be especially problematic.

Replication orphans

Standard MySQL replication is asynchronous by default this allows the master and slave to become disconnected without impacting the master’s operations. It also can result in updates to the master which are not replicated to the slave when the master fails. In a situation like this failing over to the slave will result in new rows going into auto increment tables using the same increment values used by the previous master.

If the tables are using a method to generate primary keys other than auto-increment, when the original master becomes available the missing operations from the original master Binlog can be played against the new master with minimal risk. If auto-increment is used the Binlog entries will not be able to be used without modification. Note if Statement mode replication was used this issue is avoided, but there are bunch of other reasons why you really shouldn’t be using statement mode replication anymore.

Lost uniqueness when sharding

If you get to the enviable point where you need to shard your database because you have just too much traffic going to your database for it to scale any further without sharding it, you will quickly find that the unique keys you get from auto-increment aren’t unique anymore. This causes problems when you want to merge shard data for analytics or if you need to recombine sharded data for any other reason, the no longer unique auto-increment primary keys get in the way.

Primary Key Alternatives

Once it becomes apparent that auto-increment, as implemented in InnoDB, is not necessarily the great idea it once appeared to be, the question becomes what are the alternatives? I’ll offer four options here.

Natural Key

By far and away the best choice is to use a natural key. By that, I mean one that has meaning outside of the database itself. Examples of Natural keys are National Identity numbers, State or Province identity number, timestamp, postal address, phone number, email address etc. These are generally already unique and have the advantage that they are already likely to have been used as secondary indexes anyway when you were creating your table with auto-increment primary keys. If you just simply use the existing Natural key as your primary key, you improve access to the table by that key and eliminate the cost of maintaining an extra index while avoiding the consequences of all of the problems I have already described.

Modified Natural Key

In the case of a modified natural key, you have a natural key which you are fairly sure is mostly unique, but maybe not always. Maybe occasionally you will run into cases where it’s not really going to be unique. The most common case is when you want to use a timestamp. Even if you make your timestamp down to the nanosecond there is always a small chance you will have two different processes attempting to insert into the same table with the same timestamp. By making your primary key a compound key with a small byte sized counter on the end, you can add duplicates by incrementing the small counter if an insert fails. If it fails again rinse and repeat. This only works when most of the time the natural key is fully unique.

UUID

The use of a UUID (Universally Unique Identifier) has become popular in recent years as an alternative to auto- increment keys. See:  https://en.wikipedia.org/wiki/Universally_unique_identifier UUIDs have the advantage of being unique much like auto-increment keys but they do not require table locks and they are unique within the constraints of their construction which often includes the generators MAC address, a timestamp and a unique value much like the kinds of value generated by the modified natural key approach above. To save space and minimize the impact on index block consumption UUIDs should be stored as binary(16) values instead of the Char(36) form they are usually seen. If insertion order is significant the bytes of a Type 1 UUID should be re-ordered as described here: https://www.percona.com/blog/2014/12/19/store-uuid-optimized-way/

Custom Key generator

Finally you can go to a custom key generator. Custom key generators like UUIDs can produce universally unique keys with specific characteristics.  I am not going to go into a lot of detail here but here are some examples of such generators:


A slideshare presentation that does a good job of describing a number of distributed options can be found here: https://www.slideshare.net/davegardnerisme/unique-id-generation-in-distributed-systems
Another custom approach to generating distributed keys makes light use of a persistent store by breaking up the keys into large ranges and assigning each range to a specific generator (say for example by customer id or hash of customer id) and then pulling smaller ranges of a few hundred to a few thousand keys into memory for allocation at a time. This allows distribution across multiple generators and limits database updates to relatively infrequent key batch allocation requests.

GTID consistent reads

$
0
0

Adaptive query routing based on GTID tracking

ProxySQL is a layer 7 database proxy that understands the MySQL Protocol. It provides high availability and high performance out of the box. ProxySQL has a rich set of features, and the upcoming version 2.0 has new exciting features, like the one described in this blog post.

One of the most commonly used feature is query analysis and query routing in order to provide read/write split.

When a client connected to ProxySQL executes a query, ProxySQL will first check its rules (configured by a DBA) and determine on which MySQL server the query needs to be executed. A minimalistic example is to send all reads to slaves, and writes to master. Of course, this example is not to be used in production, because sending reads to slaves may return stale data, and while stale data is ok for some queries, it is not ok for other queries. For this reason, we generally suggest to send all traffic to master, and thanks to the statistics that ProxySQL makes available, a DBA can create more precise routing rules in which only specific set of queries are routed to the slaves. More details and examples are available in a previous blog post.

ProxySQL routing can be customized a lot: it is even possible to use next_query_flagIN to specific that after a specific query, the next query (or the next set of queries) should be executed on a determined hostgroup. For example, you can specify that after a specific INSERT, the following SELECT should be executed on the same server. Although this solution is advanced, it is also complex to configure because the DBA should know the application logic to determine which are the read-after-write queries.

Causal consistency reads

Some application cannot work properly with stale data, but they can operate properly with causal consistency reads: this happens when a client is able to read the data that has written. Standard MySQL asynchronous replication cannot guarantee that. In fact, if a client writes on master, and immediately tries to read it from a slave, it is possible that the data is yet not replicated to slave.

How can we guarantee that a query is executed on slave only if a certain write event was already replicated?

GTID helps in this.

Since MySQL 5.7.5 , a client can know (in the OK packet returned by MySQL Server) which is the GTID of its last write, and can execute a read on any slave where that GTID is already executed. Lefred described the process in a blog post with an example: the server needs to have session_track_gtids enabled, and the client can execute WAIT_FOR_EXECUTED_GTID_SET on a slave and wait for the replication to apply the event on slave.

Although this solution works, it is very trivial and not usable in production, mostly for the following reasons/drawbacks:

  • executing a query with WAIT_FOR_EXECUTED_GTID_SET before the real query will add latency before any real query
  • the client doesn’t know which slave will be in sync first, so it needs to check many/all slaves
  • it is possible that none of the slaves will be in sync in an acceptable amount of time (will you wait few seconds before running the query?)

That being said, the above solution is not usable in production and is mostly a POC.

Can ProxySQL tracks GTID?

ProxySQL acts as client for MySQL . Therefore, if session_track_gtids is enabled, ProxySQL can track the GTID of all the clients’ requests, and know exactly the last GTID for each client’s connection. ProxySQL can then use this information to send a read to the right slave where the GTID was already executed. How can ProxySQL track GTID executed on slaves?

There are mostly two approaches:

  • Pull : at regular interval, ProxySQL queries all the MySQL servers to retrieve the GTID executed set
  • Push : every time a new write event is executed on a MySQL server (master or slave) and a new GTID is generated, ProxySQL is immediately notified

No need to say, the pull method is not very efficient because it will almost surely introduce latency based on how frequently ProxySQL will query the MySQL servers to retrieve the GTID executed set. The less frequent the check, the less accurate it will be. The more frequent the check, the more precise, yet it will cause load on MySQL servers and inefficiently use a lot of bandwidth if there are hundreds of ProxySQL instances. In other words, this solution is not efficient neither scalable.

What about pull method?

Real time retrieval of GTID executed set

Real time retrieval of GTID executed set is technically simple: consume and parse binlog in real time! Although, if ProxySQL becomes a slave of every MySQL server, it is easy to conclude that this solution will consume CPU resources on ProxySQL instance. To make things worse, in a setup with a lot of ProxySQL instances, if each ProxySQL instance needs to get replication events via replication from every MySQL server, network bandwidth will soon become a bottleneck. For example, think what will happen if you have 4 clusters, and each cluster has 1 master generating 40GB of binlog per day and 5 slaves, and a total of 30 proxysql instances. If each proxysql instance needs to become a slave of the 24 MySQL servers, this solution will consume nearly 30TB of network bandwidth in 1 day (and you don’t want this if you pay for bandwidth usage).

ProxySQL Binlog Reader

The pull method described above doesn’t scale and it consumes too many resources. For this reason, a new tool was implemented: ProxySQL Binlog Reader.

  • ProxySQL Binlog Reader is a lightweight process that run on the MySQL server, it connects to the MySQL server as a slave, and tracks all the GTID events.
  • ProxySQL Binlog Reader is itself a server: when a client connects to it, it will start streaming GTID in a very efficient format to reduce bandwidth.

By now you can easily guess who will be the clients of ProxySQL Binlog Reader: all the ProxySQL instances.

ProxySQL Binlog Reader

Real time routing

ProxySQL Binlog Reader allows ProxySQL to know in real time which GTID was been executed on every MySQL server, slaves and master itself. Thanks to this, when a client executes a reads that needs to provide causal consistency reads, ProxySQL immediately knows on which server the query can be executed. If for whatever reason the writes was not executed on any slave yet, ProxySQL will know that the write was executed on master and send the read there.

ProxySQL GTID Consistency

Advanced configuration, and support for many clusters

ProxySQL is extremely configurable, and this is true also for this feature. The most important tuning is that you can configure if a read should provide causal consistency or not, and if causal consistency is required you need to specify to which hostgroup should be consistent. This last detail is very important: you don’t simply enable causal consistency, but you need to specify that a read to hostgroup B should be causal consistent to hostgroup A. This allows ProxySQL to implement the algorithm on any number of hostgroups and clusters, and also allows a single client to execute queries on multiple clusters (sharding) knowing that the causal consistency read will be executed on the right cluster.

Requirements

Casual reads using GTID is only possible if:

  • ProxySQL 2.0 is used (older versions do not support it)
  • the backend is MySQL version 5.7.5 or newer. Older versions of MySQL do not have capability to use this functionality.
  • replication binlog format is ROW
  • GTID is enabled (that sounds almost obvious).
  • backends are either Oracle’s or Percona’s MySQL Server: MariaDB Server does not support session_track_gtids, but I hope it will be available soon.

Conclusion

The upcoming release of ProxySQL 2.0 is able to track executed GTID in real-time from all the MySQL servers in a replication topology. Adaptive query routing based on GTID tracking allows to provide causal reads, and ProxySQL can route reads to the slave where the needed GTID event was already executed. This solutions scales very well with limited network usage, and is being already tested in production environments.

Do you want to know more?
Join us at Percona Live 2018 and attend our session Consistent Reads Using ProxySQL and GTID

The Case Against The Case Against Auto Increment in MySQL

$
0
0
In the Pythian blog today, John Schulz writes The Case Against Auto Increment In MySQL, but his blog contains some misunderstandings about MySQL, and makes some bad conclusions. The Concerns are Based on Bad Assumptions In his blog, Schulz describes several concerns about using auto-increment primary keys. Primary Key Access "...when access is made by a secondary index, first the secondary

The simultaneous_assignment mode in MariaDB 10.3.5

$
0
0

Starting with MariaDB 10.3.5, if you say sql_mode = 'simultaneous_assignment', then
UPDATE t SET a = b, b = a;
will swap b and a because a gets what's originally in b, while b gets what's originally in a (as of the start of the SET for a given row), instead of what was going on before, which was "Assignments are evaluated in left-to-right order".

I will list things that I like or don't like, and behaviour-change cases to watch for.

I like it that this is standard SQL at last

I don't know any other vendor who ever did left-to-right assignments, and they had a good reason.

Way back in SQL-86, section 8.11 said how to handle a situation with (simplified BNF)
SET <object column> = <value expression> | NULL [, <object column> = <value expression> | NULL ...
"If the <value expression> contains a reference to a column of T, the reference is to the value of that column in the object row before any value of the object row is updated."

In case anyone still didn't get it, SQL-92 added the sentence:
"The <value expression>s are effectively evaluated before updating the object row."

Unfortunately later versions of the standard were slightly denser, such as:
"11) Each <update source> contained in SCL is effectively evaluated for the current row before any of the current row's object rows is updated."
The abbreviation "SCL" is the set clause list. The word "rows" is not a typo, but it's for a special situation, we can still interpret as "before the object row is updated".

Thus what we're talking about is optionally following the standard.

So hurrah, let's put equestrian statues of the MariaDB seal in main squares of our cities.

I don't like the name

I'll admit that the effect can be the same, and I'll admit that some SQL Server commenters like to refer to this as doing things "all at once". (See here and here.) But the standard description isn't really demanding that all the assignments be simultaneous.

And the term "simultaneous assignment" can make some programmers
think of "parallel assignment", as in this example (from Wikipedia)
a, b := 0, 1

A name like "evaluate_sources_first_during_updates" would have been better.

I don't like that it's a mode

We all know the problems of setting a global variable that people don't see or think about when they create SQL statements.

So perhaps it would have been better to make a change to the UPDATE syntax, e.g.
UPDATE /*! new-style-update */ NEW STYLE t SET ...;
It doesn't solve the problem cleanly -- now every statement has non-standard syntax in order to perform in a standard way -- but it means you don't get the behaviour change in every statement, only in the ones where you ask.

Or perhaps it would have been better to produce a warning: "You are using an sql_mode value that changes the behaviour of this particular UPDATE statement because evaluation is no longer left to right." I don't know if it would be hard. I don't know if it's too late.

Setup for examples

Following examples are done with a one-row table, made thus:

CREATE TABLE t (col1 INT, col2 INT, PRIMARY KEY (col1, col2));
INSERT INTO t VALUES (1, 2);

The MariaDB version is 10.3.5 downloaded on 2018-03-20.

Assigning with swaps and variables

SET @@sql_mode='simultaneous_assignment';
UPDATE t SET col1 = 1, col2 = 2;
UPDATE t SET col1 = col2, col2 = col1;
SELECT * FROM t;
-- Result: col1 is 2, col2 is 1.

This is different from what happens with @@sql_mode=''. This is the best example that shows the new mode works.

SET @@sql_mode='simultaneous_assignment';
SET @x = 100;
UPDATE t SET col1 = @x, col2 = @x := 200;
SELECT * FROM t;
-- Result: col1 is 100, col2 is 200.

This is not different from what happens with @@sql_mode=''. Conclusion: if you use the non-standard variable-assignment trick, the value is not updated in advance.

What about the SET statement?

DROP PROCEDURE p;
SET @@sql_mode='simultaneous_assignment';
CREATE PROCEDURE p()
BEGIN
  DECLARE v1 INT DEFAULT 1;
  DECLARE v2 INT DEFAULT 2;
  SET v1 = v2, v2 = v1;
  SELECT v1, v2;
END;
CALL p();
-- Result: v1 is 2, v2 is 2.

This is not different from what happens with @@sql_mode=''. Conclusion 'simultaneous_assignment' does not affect assignments with the SET statement.

Perhaps people will expect otherwise because SET statements look so similar to SET clauses, but this is actually correct. The way the standard defines things, for syntax that is similar to (though not exactly the same as) "SET v1 = v2, v2 = v1;", is: the statement should be treated as equivalent to

SET v1 = v2;
SET v2 = v1;

Good. But come to think of it, this is another reason to dislike the misleading mode name 'simultaneous_assignment'. SET statements are assignments but @@sql_mode won't affect them.

What about the INSERT statement?

SET @@sql_mode='simultaneous_assignment';
TRUNCATE TABLE t;
INSERT INTO t SET col1 = col2, col2 = 99;
SELECT * FROM t;
-- Result: col1 is 0, col2 is 99.

Conclusion: 'simultaneous_assignment' does not affect INSERT ... SET statements, processing is left to right. This looks inconsistent to me, but it's not wrong.

What about the INSERT ON DUPLICATE KEY UPDATE statement?

SET @@sql_mode='simultaneous_assignment';
UPDATE t SET col1 = 0, col2 = 1;
INSERT INTO t VALUES (0, 1) ON DUPLICATE KEY UPDATE col1 = col2, col2 = col1;
SELECT * FROM t;
-- Result: col1 is 1, col2 is 0.

Conclusion: 'simultaneous_assignment does affect INSERT ON DUPLICATE KEY UPDATE. Nobody said that it has to (this syntax is a MySQL/MariaDB extension), but surely this is what everyone would expect. Good.

Triggers and constraints

I could not come up with a case where 'simultaneous_assignment' affected the order in which triggers or constraints are processed. Good.

Assigning twice to the same column

SET @@sql_mode='simultaneous_assignment';
UPDATE t SET col1 = 3, col2 = 4, col1 = col2;
-- Result: error.

Good. There's supposed to be an error, because (quoting the standard document again) "Equivalent <object column>s shall not appear more than once in a <set clause list>."

Actually this doesn't tell us something new about 'simultaneous_assignment', I only tried it because I thought that MariaDB would not return an error. Probably I was remembering some old version before this was fixed.

Multiple-table updates

From the bugs.mysql.com site quoting the MySQL manual:
"Single-table UPDATE assignments are generally evaluated from left to right. For multiple-table updates, there is no guarantee that assignments are carried out in any particular order."
I don't see an equivalent statement in the MariaDB manual. So I conclude that even for multiple-table updates the assignments will be done in a standard way, but couldn't think of a good way to test.

There are other things

The really big things in MariaDB 10.3.5 are PL/SQL and the myrocks engine. So, just because I've looked at a small thing, don't get the impression that 10.3.5 is going to be a minor enhancement.

ocelotgui

There have been no significant updates to ocelotgui since my last blog post.


FLUSH and LOCK Handling in Percona XtraDB Cluster

$
0
0
FLUSH and LOCK Handling

FLUSH and LOCK HandlingIn this blog post, we’ll look at how Percona XtraDB Cluster (PXC) executes FLUSH and LOCK handling.

Introduction

Percona XtraDB Cluster is a multi-master solution that allows parallel execution of the transactions on multiple nodes at the same point in time. Given this semantics, it is important to understand how Percona XtraDB Cluster executes statements regarding FLUSH and LOCK handling (that operate at node level).

The section below enlist different flavors of these statements and their PXC semantics

FLUSH TABLE WITH READ LOCK
  • FTWRL is normally used for backup purposes.
  • Execution of this command establishes a global level read lock.
  • This read lock is non-preemptable by the background running applier thread.
  • PXC causes the node to move to DESYNC state (thereby blocking emission of flow-control) and also pauses the node.

2018-03-08T05:09:54.293991Z 0 [Note] WSREP: Shifting SYNCED -> DONOR/DESYNCED (TO: 1777)
2018-03-08T05:09:58.040809Z 5 [Note] WSREP: Provider paused at c7daf065-2285-11e8-a848-af3e3329ab8f:2002 (2047)
2018-03-08T05:14:20.508317Z 5 [Note] WSREP: resuming provider at 2047
2018-03-08T05:14:20.508350Z 5 [Note] WSREP: Provider resumed.
2018-03-08T05:14:20.508887Z 0 [Note] WSREP: Member 1.0 (n2) resyncs itself to group
2018-03-08T05:14:20.508900Z 0 [Note] WSREP: Shifting DONOR/DESYNCED -> JOINED (TO: 29145)
2018-03-08T05:15:16.932759Z 0 [Note] WSREP: Member 1.0 (n2) synced with group.
2018-03-08T05:15:16.932782Z 0 [Note] WSREP: Shifting JOINED -> SYNCED (TO: 29145)
2018-03-08T05:15:16.988029Z 2 [Note] WSREP: Synchronized with group, ready for connections
2018-03-08T05:15:16.988054Z 2 [Note] WSREP: Setting wsrep_ready to true

  • Other nodes of the cluster continue to process the workload.
  • DESYNC and pause node continue to see the replication traffic. Though it doesn’t process the write-sets, they are appended to Galera cache for future processing.
  • Fallback: When FTWRL is released (through UNLOCK TABLES), and if the workload is active on other nodes of the cluster, FTWRL executed node may start emitting flow-control to cover the backlog. Check details here.
FLUSH TABLE <tablename> (WITH READ LOCK|FOR EXPORT)
  • It is meant to take global level read lock on the said table only. This lock command is not replicated and so pxc_strict_mode = ENFORCING blocks execution of this command.
  • This read lock is non-preemptable by the background running applier thread.
  • Execution of this command will cause the node to pause.
  • If the flush command executing node is same as workload processing node, then the node will pause immediately
  • If the flush command executing node is different from workload processing node, then the write-sets are queued to the incoming queue and flow-control will cause the pause.
  • End-result is cluster will stall in both cases.

2018-03-07T06:40:00.143783Z 5 [Note] WSREP: Provider paused at 40de14ba-21be-11e8-8e3d-0ee226700bda:147682 (149032)
2018-03-07T06:40:00.144347Z 5 [Note] InnoDB: Sync to disk of `test`.`t` started.
2018-03-07T06:40:00.144365Z 5 [Note] InnoDB: Stopping purge
2018-03-07T06:40:00.144468Z 5 [Note] InnoDB: Writing table metadata to './test/t.cfg'
2018-03-07T06:40:00.144537Z 5 [Note] InnoDB: Table `test`.`t` flushed to disk
2018-03-07T06:40:01.855847Z 5 [Note] InnoDB: Deleting the meta-data file './test/t.cfg'
2018-03-07T06:40:01.855874Z 5 [Note] InnoDB: Resuming purge
2018-03-07T06:40:01.855955Z 5 [Note] WSREP: resuming provider at 149032
2018-03-07T06:40:01.855970Z 5 [Note] WSREP: Provider resumed.

  • Once the lock is released (through UNLOCK TABLES), node resumes apply of write-sets.
LOCK TABLE <tablename> READ/WRITE
  • LOCK TABLE command is meant to lock the said table in the said mode.
  • Again, the lock established by this command is non-preemptable.
  • LOCK is taken at node level (command is not replicated) so pxc_strict_mode = ENFORCING blocks this command.
  • There is no state change in PXC on the execution of this command.
  • If the lock is taken on the table that is not being touched by the active workload, the workload can continue to progress. If the lock is taken on the table that is part of the workload, said transaction in the workload will wait for the lock to get released, in turn, will cause complete workload to halt.
GET_LOCK
  • It is named lock and follows same semantics as LOCK TABLE for PXC. (Base semantics of MySQL are slightly different that you can check here).
LOCK TABLES FOR BACKUP
  • As the semantics goes, this lock is specially meant for backup and blocks non-transactional changes (like the updates to non-transactional engine = MyISAM and DDL changes).
  • PXC doesn’t have any special add-on semantics for this command
LOCK BINLOG FOR BACKUP
  • This statement blocks write to binlog. PXC always generates a binlog (persist to disk is controlled by the log-bin setting). If you disable log-bin, then PXC enables emulation-based binlogging.
  • This effectively means this command can cause the cluster to stall.

Tracking active lock/flush

  • If you have executed a flush or lock command and wanted to find out, it is possible using the com_% counter. These counters are connection specific, so execute these commands from the same client connection. Also, these counters are aggregate counters and incremental only.

mysql> show status like 'Com%lock%';
+----------------------------+-------+
| Variable_name | Value |
+----------------------------+-------+
| Com_lock_tables | 2 |
| Com_lock_tables_for_backup | 1 |
| Com_lock_binlog_for_backup | 1 |
| Com_unlock_binlog | 1 |
| Com_unlock_tables | 5 |
+----------------------------+-------+
5 rows in set (0.01 sec)
mysql> show status like '%flush%';
+--------------------------------------+---------+
| Variable_name | Value |
+--------------------------------------+---------+
| Com_flush | 4 |
| Flush_commands | 3 |
* Flush_commands is a global counter. Check MySQL documentation for more details.

Conclusion

By now, we can conclude that the user should be a bit more careful when executing local lock commands (understanding the semantics and the effect). Careful execution of these commands can help serve your purpose.

The post FLUSH and LOCK Handling in Percona XtraDB Cluster appeared first on Percona Database Performance Blog.

Database Audit Log Monitoring for Security and Compliance

$
0
0

We recently conducted a webinar on Audit Log analysis for MySQL & MariaDB Databases. This blog will further provide a deep dive into the security & compliance surrounding databases.

Database auditing is the tracking of database resources utilization and authority, specifically, the monitoring and recording of user database actions. Auditing can be based on a variety of factors, including individual actions, such as the type of SQL statement executed, or on a combination of factors such as user name, application, time, etc.  Performing regular database log analysis bolsters your internal security measures by answering questions like who changed your critical data, when it was changed, and more. Database auditing also helps you comply with increasingly demanding compliance requirements.

The purpose of this blog is to outline the importance of audit log analysis using MariaDB and Enterprise MySQL as examples.

Auditing Requirements

The requirement to track access to database servers and the data itself is not that new, but in recent years, there has been a marked need for more sophisticated tools. When auditing is enabled, each database operation on the audited database records a trail of information such as what database objects were impacted, who performed the operation and when. The comprehensive audit trail of executed database actions can be maintained over time to allow DBAs, security staff, as well as any authorized personnel, to perform in-depth analysis of access and modification patterns against data in the DBMS.  

Keep in mind that auditing tracks what a particular user has done once access has been allowed. Hence, auditing occurs post-activity; it does not do anything to prohibit access. Of course, some database auditing solutions have grown to include capabilities that will identify nefarious access and shut it down before destructive actions can occur.

Audit trails produced by intrusion detection help promote data integrity by enabling the detection of security breaches.  In this capacity, an audited system can serve as a deterrent against users tampering with data because it helps to identify infiltrators. Your company’s business practices and security policies may dictate being able to trace every data modification back to the initiating user. Moreover, government regulations may require your organization to analyze data access and produce regular reports, either on an ongoing basis, or on a case-by-case basis, when there is a need to identify the root cause of data integrity problems.  Auditing is beneficial for all of these purposes.

Moreover, should unauthorized, malicious, or simply ill-advised operations take place, proper auditing will lead to the timely discovery of the root cause and resolution.

The General Data Protection Regulation

On April 27, 2016, the General Data Protection Regulation (GDPR) was adopted by the European Parliament and the council of the European Union that will be taking effect starting on May 25, 2018.  It’s a regulation in EU law governing data protection and privacy for all individuals within the European Union. It introduces numerous security and compliance regulations to all organizations worldwide that handle, process, collect or store personal information of EU citizens. This means that organizations that work with personal data will have to elevate security measures and auditing mechanisms when handling Personal Identifiable Information (PII) of EU citizens.

Furthermore, organizations will have to ensure that only people which should have access to the personal information of EU citizens are granted  access, and in case of unauthorized access, organizations must have mechanisms to detect and be alerted on any such incident in order to resolve any possible issues in an expeditious manner.  Following a data breach, organizations must disclose full information on these events to their local data protection authority (DPA) and all customers concerned with the data breach in no more than 72 hours so they can respond accordingly.

Failing to comply with GDPR standard could result in heavy fines for up to 4% of the offending organization’s global revenue, or up to €20 million (whichever is greater). With this in mind, it is crucial for all affected organizations to make sure that they implement adequate log monitoring on their databases, as defined by the standard.

How Databases Implement Auditing

There is no set standard that defines how a database should implement auditing, so vendors and Database Administrators (DBAs) differ in their approach.  Some employ special tables while others utilize log files. The two DBMSes that we’ll be looking at here today, MariaDB and MySQL, employ log-based auditing.

The MariaDB Audit Plugin

Prior to MariaDB 5.5.20, in order to record user access, you would have had to employ third-party database solutions. To help businesses comply with internal auditing regulations and those of various regulatory bodies, MariaDB developed the MariaDB Audit Plugin.  The MariaDB Audit Plugin can be used also with MySQL, but includes some unique features that are available only for MariaDB.

In MariaDB, the Audit Plugin logs detailed information for any type of access from users to your database server and tables, including:

    • Timestamp
    • Server-Host
    • User
    • Client-Host
    • Connection-ID
    • Query-ID
    • Operation
    • Database
    • Table
    • Error-Code

Installation

Getting the Maria Audit Plugin installed, configured and the auditing activated is fairly simple.  In fact, you only need a few minutes to enable auditing for your database. A restart of the Server is not needed, so you do not need to plan any downtime for the installation of the plugin.  The only requirement is that you are running MariaDB or MySQL Server with version 5.5 or newer (MySQL 5.5.14, MariaDB 5.5.20).

If you installed MariaDB from its official packages, you probably already have the plugin on your system, even though it’s neither installed nor enabled by default. Look for a file called “server_audit.so” (in Linux) or “server_audit.dll” (in Windows) inside your plugins directory.  The file path of the plugin library is stored in the plugin_dir system variable. To see the value of this variable and determine the file path of the plugin library, execute the following SQL statement:

SHOW GLOBAL VARIABLES LIKE 'plugin_dir';

+---------------+--------------------------+
| Variable_name | Value                    |
+---------------+--------------------------+
| plugin_dir    | /usr/lib64/mysql/plugin/ |
+---------------+--------------------------+

If you don’t find the plugin file inside your plugins directory, download it from the MariaDB site and place it in the plugins directory manually. (In Linux, ensure that the MariaDB server can read the file by giving it 755 permissions and root user ownership.)

Next, install the plugin using the command:
INSTALL PLUGIN server_audit
SONAME 'server_audit.so';

To confirm the plugin is installed and enabled, run the query show plugins;. You should see it appear in the results list:

+-----------------------------+----------+--------------------+-----------------+---------+
| Name                        | Status   | Type               | Library         | License |
+-----------------------------+----------+--------------------+-----------------+---------+
| SERVER_AUDIT                | ACTIVE   | AUDIT              | server_audit.so | GPL     |
+-----------------------------+----------+--------------------+-----------------+---------+

The MariaDB Audit Plugin comes with many variables to let you fine-tune your auditing to help you better concentrate on just those events and statements that are important to you. You can see the currently set variables with the command show global variables like "server_audit%";:

MariaDB [(none)]> SHOW GLOBAL VARIABLES LIKE "server_audit%";

+-------------------------------+-----------------------+
| Variable_name                 | Value                 |
+-------------------------------+-----------------------+
| server_audit_events           |                       |
| server_audit_excl_users       |                       |
| server_audit_file_path        | server_audit.log      |
| server_audit_file_rotate_now  | OFF                   |
| server_audit_file_rotate_size | 1000000               |
| server_audit_file_rotations   | 9                     |
| server_audit_incl_users       |                       |
| server_audit_logging          | ON                    |
| server_audit_mode             | 0                     |
| server_audit_output_type      | file                  |
| server_audit_syslog_facility  | LOG_USER              |
| server_audit_syslog_ident     | mysql-server_auditing |
| server_audit_syslog_info      |                       |
| server_audit_syslog_priority  | LOG_INFO              |
+-------------------------------+-----------------------+

These variables should be specified in the MariaDB server configuration file (e.g /etc/my.cnf.d/server.cnf) in the [server] section in order to be persistent between server restarts. For example, to have the variable server_audit_logging set to ON, add the line server_audit_logging=ON to the file:

[server]

server_audit_logging=OFF

Here is a quick rundown of some of the most important variables:

  • server_audit_logging – Enables audit logging; if it’s not set to ON, audit events will not be recorded and the audit plugin will not do anything.
  • server_audit_events – Specifies the events you wish to have in the log. By default the value is empty, which means that ALL events are recorded. The options are:
    • CONNECTION (users connecting and disconnecting)
    • QUERY (queries and their result)
    • TABLE (which tables are affected by the queries)
  • server_audit_excl_users, server_audit_incl_users – These variables specify which users’ activity should be excluded from or included in the audit. server_audit_incl_users has the higher priority. By default, all users’ activity is recorded.
  • server_audit_output_type – By default auditing output is sent to a file. The other option is “syslog”, meaning all entries go to the syslog facility.
  • server_audit_syslog_facility, server_audit_syslog_priority – Specifies the syslog facility and the priority of the events that should go to syslog.

Understanding the Log File Entries

Once you have the audit plugin configured and running, you can examine the log file, (e.g. /var/lib/mysql/server_audit.log). There you will find all the events that have been enabled by the server_audit_logging variable. For example, CONNECTION entries will show you the user and from where connects and disconnects occur:

20140901 15:33:43,localhost.localdomain,root,localhost,5,0,CONNECT,,,0

20140901 15:45:42,localhost.localdomain,root,localhost,5,0,DISCONNECT,,,0

Here are some example TABLE and QUERY entries:

20140901 15:19:44,localhost.localdomain,root,localhost,4,133,WRITE,video_king,stores,

20140901 15:19:44,localhost.localdomain,root,localhost,4,133,QUERY, video_king,'DELETE FROM stores LIMIT 10',0

The first entry shows that there were WRITE operations on the database video_king and the table stores. The query that made the WRITE changes follows: DELETE FROM stores LIMIT 10. The order of these statements will be always the same – first the TABLE event and then the QUERY event that caused it.

A READ operation looks like this:

20140901 15:20:02,localhost.localdomain,root,localhost,4,134,READ,video_king,stores,

20140901 15:20:05,localhost.localdomain,root,localhost,4,134,QUERY,stores,'SELECT * FROM stores LIMIT 100',0

MySQL Enterprise Audit

MySQL Enterprise Edition includes MySQL Enterprise Audit, implemented using a server plugin named audit_log. MySQL Enterprise Audit uses the open MySQL Audit API to enable standard, policy-based monitoring, logging, and blocking of connection and query activity executed on specific MySQL servers. Designed to meet the Oracle audit specification, MySQL Enterprise Audit provides an out of box auditing and compliance solution for applications that are governed by both internal and external regulatory guidelines.

Installation

The plugin is included with MySQL Enterprise Audit, so you simply need to add the following to your my.cnf file to register and enable the audit plugin:

[mysqld]

plugin-load=audit_log.so (keep in mind the audit_log suffix is platform dependent, so .dll on Windows, etc.)

Alternatively, you can load the plugin at runtime:

mysql> INSTALL PLUGIN audit_log SONAME 'audit_log.so';

Auditing for a specific MySQL server can be dynamically enabled and disabled via the audit_log_policy global variable. It uses the following named values to enable or disable audit stream logging and to filter the audit events that are logged to the audit stream:

  • “ALL” – enable audit stream and log all events
  • “LOGINS” – enable audit stream and log only login events
  • “QUERIES” – enable audit stream and log only query events
  • “NONE” – disable audit stream

Another global variable, audit_log_rotate_on_size, allows you to automate the rotation and archival of audit stream log files based on size. Archived log files are renamed and appended with a datetime stamp
when a new file is opened for logging.

The MySQL audit stream is written as XML, using UFT-8 (without compression or encryption) so that it can be easily formatted for viewing using a standard XML parser. This enables you to leverage third-party tools to view the contents. You may override the default file format by setting the audit_log_format system variable at server startup.  Formats include:

  • Old-style XML format (audit_log_format=OLD): The original audit logging format used by default in older MySQL series.
  • New-style XML format (audit_log_format=NEW): An XML format that has better compatibility with Oracle Audit Vault than old-style XML format. MySQL 5.7 uses new-style XML format by default.
  • JSON format (audit_log_format=JSON)

By default, the file is named “audit.log” and resides in the server data directory. To change the name of the file, you can set the audit_log_file system variable at server startup.

MySQL Enterprise Audit was designed to be transparent at the application layer by allowing you to control the mix of log output buffering and asynchronous or synchronous disk writes to
minimize the associated overhead that comes when the audit stream is enabled. The net result is that, depending on the chosen audit stream log stream options, most application users will see little to no difference in response times when the audit stream is enabled.

Monyog MySQL Monitor

While reading the audit log file is great for a quick casual look, it’s not the most practical way to monitor database logs. Chances are you’ll be better off using the syslog option or, better still, taking advantage of tools that report on the audit log and/or syslogs.  There, you can process entries to focus on certain type of events of interest.

One such tool is Monyog MySQL Monitor.  Version 8.5.0 introduces audit log analysis for MySQL Enterprise and MariaDB.  This feature parses the audit log maintained by the server and displays the content in clean tabular format.

Monyog accesses the audit log file, the same way it does for other MySQL log files, including the Slow Query, General Query and Error log.

Figure 1: Audit Log Options

You can select the server and the time-frame for which you want the audit log to be seen from.  Then, clicking on “SHOW AUDIT LOG” fetches the contents of the log. The limit on the number of rows which can be fetched in one time-frame is 10000.

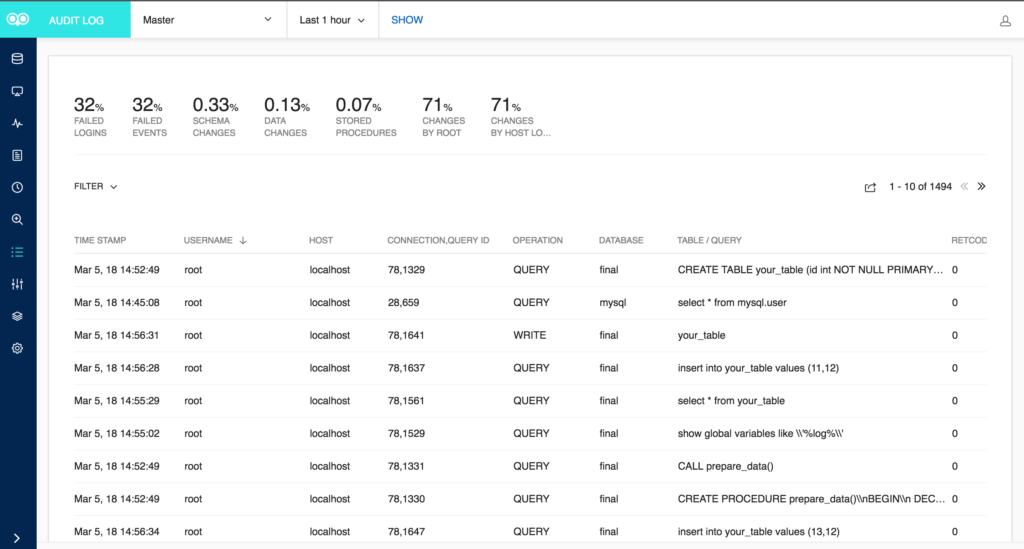
Figure 2: Audit Log Screen

The section on the top gives you quick summary of the audit log in percentage like Failed Logins, Failed Events, Schema changes, Data Changes and Stored Procedure. All these legends are clickable and shows the corresponding audit log entries on clicking. Furthermore, you can use the filter option to fetch audit log based on Username, Host, Operation, Database and Table/Query. There is also an option to export the fetched audit log content in CSV format.

Conclusion

In this blog, we outlined the importance of audit log analysis using MariaDB and Enterprise MySQL as examples.  

In recent years, there has been a marked need for more sophisticated tools due to increased internal and external security and auditing policies.  

A properly audited system can serve as a deterrent against users tampering with data because it helps to identify infiltrators.  Once an unauthorized, malicious, or simply ill-advised operation has taken place, proper auditing will lead to the timely discovery of the root cause and resolution.

Both MariaDB and MySQL implement auditing via native plugins.  These are fully configurable and may record database activities in a variety of formats.  The resulting log files may be read directly or analyzed by a tool such as the Monyog MySQL Monitor.  It provides a summary of Failed Logins, Failed Events, Schema changes, Data Changes and Stored Procedure, as well as fields such as Username, Host, Operation, Database and Table/Query, all within an easy-to-read tabular format.

Download a 14-day free trial of Monyog MySQL monitor. Here’s the complete video for all those who couldn’t attend the webinar.

The post Database Audit Log Monitoring for Security and Compliance appeared first on Monyog Blog.

How to install XMB forum on Ubuntu 16.04 LTS

$
0
0
XMB forum also known as eXtreme Message Board is a free and open source forum software written in PHP and uses MySQL database backend. XMB is a simple, lightweight, easy to use, Powerful and highly customizable. In this tutorial, we will learn how to install XMB forum on Ubuntu 16.04.

Docker Compose Setup for InnoDB Cluster

$
0
0
In the following we show how InnoDB cluster can be deployed in a container context. In the official documentation (Introducing InnoDB Cluster), InnoDB is described as: MySQL InnoDB cluster provides a complete high availability solution for MySQL. MySQL Shell includes AdminAPI which enables you to easily configure and administer a group of at least three […]

MySQL Log Rotation

$
0
0

Overview

I find far too often that MySQL error and slow query logs are unaccounted for.  Setting up log rotation helps make the logs manageable in the event that they start to fill up and can help make your troubleshooting of issues more efficient.

Setup

All steps in the examples below are run as the root user. The first step is to setup a user that will perform the log rotation.  It is recommended to only give enough access to the MySQL user for the task that it is performing.

Create Log Rotate MySQL User

mysql > CREATE USER 'log_rotate'@'localhost' IDENTIFIED BY '<ENTER PASSWORD HERE>';
mysql > GRANT RELOAD,SUPER ON *.* to 'log_rotate'@'localhost';
mysql > FLUSH PRIVILEGES;</pre>


The next step is to setup the MySQL authentication config as root.  Here are two methods to set this up.  The first method will be the more secure method of storing your MySQL credentials using mysql_config_editor as the credentials are stored encrypted. But this first method is only available with Oracle MySQL or Percona MySQL client greater than 5.5. It is not available with Maria DB MySQL client. Method 2 can be used with pretty much any setup but is less secure as the password is stored in plain text.


Method 1

bash # mysql_config_editor set \
  --login-path=logrotate \
  --host=localhost \
  --user=log_rotate \
  --port 3306 \
  --password 

Method 2

bash # vi /root/.my.cnf

[client]
user=log_rotate
password='<ENTER PASSWORD HERE>'

bash # chmod 600 /root/.my.cnf


Now we will test to make sure this is working as expected


Method 1

bash # mysqladmin --login-path=logrotate ping

Method 2

bash # mysqladmin ping


The paths for the error and slow query log will need to be gathered in order to place them in the logrotate config file


Method 1

bash # mysql --login-path=logrotate -e "show global variables like 'slow_query_log_file'" 
bash # mysql --login-path=logrotate -e "show global variables like 'log_error'"

Method 2

bash # mysql -e "show global variables like 'slow_query_log_file'" 
bash # mysql -e "show global variables like 'log_error'"


Finally we will create the log rotation file with the following content. Make sure to update your error and slow query log paths to match the paths gathered in previous steps. Start by opening up the editor for a new mysql logrotate file in the /etc/logrotate.d directory.


Method 1 Content

bash # vi /etc/logrotate.d/mysql

/var/lib/mysql/error.log /var/lib/mysql/slow.queries.log {
  create 600 mysql mysql
  daily
  rotate 30
  missingok
  compress
  sharedscripts
  postrotate
    if test -x /usr/bin/mysqladmin &&
      env HOME=/root /usr/bin/mysqladmin --login-path=logrotate ping > /dev/null 2>&1
    then
      env HOME=/root/ /usr/bin/mysql --login-path=logrotate -e 'select @@global.long_query_time into @lqt_save; set global long_query_time=2000; set global slow_query_log=0; select sleep(2); FLUSH ERROR LOGS; FLUSH SLOW LOGS;select sleep(2); set global long_query_time=@lqt_save; set global slow_query_log=1;' > /var/log/mysqladmin.flush-logs 2>&1
    fi
  endscript
}

Method 2 Content

bash # vi /etc/logrotate.d/mysql

/var/lib/mysql/error.log /var/lib/mysql/slow.queries.log {
  create 600 mysql mysql
  daily
  rotate 30
  missingok
  compress
  sharedscripts
  postrotate
    if test -x /usr/bin/mysqladmin &&
      env HOME=/root /usr/bin/mysqladmin ping > /dev/null 2>&1
    then
      env HOME=/root/ /usr/bin/mysql -e 'select @@global.long_query_time into @lqt_save; set global long_query_time=2000; set global slow_query_log=0; select sleep(2); FLUSH ERROR LOGS; FLUSH SLOW LOGS;select sleep(2); set global long_query_time=@lqt_save; set global slow_query_log=1;' > /var/log/mysqladmin.flush-logs 2>&1
    fi
  endscript
}

Validation

For final validation force a log rotate. Update the path in the ls command to match the path of the logs gathered earlier.

bash # logrotate --force /etc/logrotate.d/mysql
bash # ls -al /var/lib/mysql

Shinguz: MySQL sys Schema in MariaDB 10.2

$
0
0

MySQL has introduced the PERFORMANCE_SCHEMA (P_S) in MySQL 5.5 and made it really usable in MySQL 5.6 and added some enhancements in MySQL 5.7 and 8.0.

Unfortunately the PERFORMANCE_SCHEMA was not really intuitive for the broader audience. Thus Mark Leith created the sys Schema for an easier access for the normal DBA and DevOps and Daniel Fischer has enhanced it further. Fortunately the sys Schema up to version 1.5.1 is available on GitHub. So we can adapt and use it for MariaDB as well. The version of the sys Schema in MySQL 8.0 is 1.6.0 and seems not to be on GitHub yet. But you can extract it from the MySQL 8.0 directory structure: mysql-8.0/share/mysql_sys_schema.sql. According to a well informed source the project on GitHub is not dead but the developers have just been working on other priorities. An the source announced another release soon (they are working on it at the moment).

MariaDB has integrated the PERFORMANCE_SCHEMA based on MySQL 5.6 into its own MariaDB 10.2 server but unfortunately did not integrate the sys Schema. Which PERFORMANCE_SCHEMA version is integrated in MariaDB can be found here.

To install the sys Schema into MariaDB we first have to check if the PERFORMANCE_SCHEMA is activated in the MariaDB server:

mariadb> SHOW GLOBAL VARIABLES LIKE 'performance_schema';
+--------------------+-------+
| Variable_name      | Value |
+--------------------+-------+
| performance_schema | OFF   |
+--------------------+-------+

To enable the PERFORMANCE_SCHEMA just add the following line to your my.cnf:

[mysqld]

performance_schema = 1

and restart the instance.

In MariaDB 10.2 the MySQL 5.6 PERFORMANCE_SCHEMA is integrated so we have to run the sys_56.sql installation script. If you try to run the sys_57.sql script you will get a lot of errors...

But also the sys_56.sql installation script will cause you some little troubles which are easy to fix:

unzip mysql-sys-1.5.1.zip 
mysql -uroot < sys_56.sql

ERROR 1193 (HY000) at line 20 in file: './procedures/diagnostics.sql': Unknown system variable 'server_uuid'
ERROR 1193 (HY000) at line 20 in file: './procedures/diagnostics.sql': Unknown system variable 'master_info_repository'
ERROR 1193 (HY000) at line 20 in file: './procedures/diagnostics.sql': Unknown system variable 'relay_log_info_repository'

For a quick hack to make the sys Schema work I changed the following information:

  • server_uuid to server_id
  • @@master_info_repository to NULL (3 times).
  • @@relay_log_info_repository to NULL (3 times).

For the future the community has to think about if the sys Schema should be aware of the 2 branches MariaDB and MySQL and act accordingly or if the sys Schema has to be forked to work properly for MariaDB and implement MariaDB specific functionality.

When the sys Schema finally is installed you have the following tables to get your performance metrics:

mariadb> use sys
mariadb> SHOW TABLES;
+-----------------------------------------------+
| Tables_in_sys                                 |
+-----------------------------------------------+
| host_summary                                  |
| host_summary_by_file_io                       |
| host_summary_by_file_io_type                  |
| host_summary_by_stages                        |
| host_summary_by_statement_latency             |
| host_summary_by_statement_type                |
| innodb_buffer_stats_by_schema                 |
| innodb_buffer_stats_by_table                  |
| innodb_lock_waits                             |
| io_by_thread_by_latency                       |
| io_global_by_file_by_bytes                    |
| io_global_by_file_by_latency                  |
| io_global_by_wait_by_bytes                    |
| io_global_by_wait_by_latency                  |
| latest_file_io                                |
| metrics                                       |
| processlist                                   |
| ps_check_lost_instrumentation                 |
| schema_auto_increment_columns                 |
| schema_index_statistics                       |
| schema_object_overview                        |
| schema_redundant_indexes                      |
| schema_table_statistics                       |
| schema_table_statistics_with_buffer           |
| schema_tables_with_full_table_scans           |
| schema_unused_indexes                         |
| session                                       |
| statement_analysis                            |
| statements_with_errors_or_warnings            |
| statements_with_full_table_scans              |
| statements_with_runtimes_in_95th_percentile   |
| statements_with_sorting                       |
| statements_with_temp_tables                   |
| sys_config                                    |
| user_summary                                  |
| user_summary_by_file_io                       |
| user_summary_by_file_io_type                  |
| user_summary_by_stages                        |
| user_summary_by_statement_latency             |
| user_summary_by_statement_type                |
| version                                       |
| wait_classes_global_by_avg_latency            |
| wait_classes_global_by_latency                |
| waits_by_host_by_latency                      |
| waits_by_user_by_latency                      |
| waits_global_by_latency                       |
+-----------------------------------------------+

One query as an example: Top 10 MariaDB global I/O latency files on my system:

mariadb> SELECT * FROM sys.waits_global_by_latency LIMIT 10;
+--------------------------------------+-------+---------------+-------------+-------------+
| events                               | total | total_latency | avg_latency | max_latency |
+--------------------------------------+-------+---------------+-------------+-------------+
| wait/io/file/innodb/innodb_log_file  |   112 | 674.18 ms     | 6.02 ms     | 23.75 ms    |
| wait/io/file/innodb/innodb_data_file |   892 | 394.60 ms     | 442.38 us   | 29.74 ms    |
| wait/io/file/sql/FRM                 |   668 | 72.85 ms      | 109.05 us   | 20.17 ms    |
| wait/io/file/sql/binlog_index        |    10 | 21.25 ms      | 2.13 ms     | 15.74 ms    |
| wait/io/file/sql/binlog              |    19 | 11.18 ms      | 588.56 us   | 10.38 ms    |
| wait/io/file/myisam/dfile            |    79 | 10.48 ms      | 132.66 us   | 3.78 ms     |
| wait/io/file/myisam/kfile            |    86 | 7.23 ms       | 84.01 us    | 789.44 us   |
| wait/io/file/sql/dbopt               |    35 | 1.95 ms       | 55.61 us    | 821.68 us   |
| wait/io/file/aria/MAI                |   269 | 1.18 ms       | 4.40 us     | 91.20 us    |
| wait/io/table/sql/handler            |    36 | 710.89 us     | 19.75 us    | 125.37 us   |
+--------------------------------------+-------+---------------+-------------+-------------+

Taxonomy upgrade extras: 

MySQL 8.0 Source Code Improvements

$
0
0

With this post, I want to bring your attention to source code improvements in MySQL 8.0. MySQL 8.0 modernizes the code base by using C++11 constructs, being warning-free on more compilers and platforms, being UBSan- and ASan- clean, improving header file dependencies, improving the coding style, and better developer documentation.…


Caching SHA-2 (or 256) Pluggable Authentication for MySQL 8

$
0
0
If you are like me and you spend chilly spring evenings relaxing by the fire, reading the manual for the upcoming MySQL 8 release, you may have seen Caching SHA-2 Pluggable Authentication in section 6.5.1.3. 

There are now TWO SHA-256 plugsins for MySQL 8 for hashing user account passwords and no, I do not know what the title of the manual pages says SHA-2 when it is SHA-256.  We have sha256_password for basic SHA-256 authentication and  caching_sha2_password that adds caching for better performance.

The default plugin is caching_sha2_password has three features not found in its non caching brother. The first is, predictably, a cache for faster authentication for repeat customers to the database. Next is a RSA-based password exchange that is independent of the SSL library you executable is linked. And it supports Unix socket-files and shared-memory protocols -- so sorry named pipe fans.

If you have been testing the release candidate and use older clients or older libmysqlclient you may have seen Authentication plugin 'caching_sha2_password' is not supported or some other similar message. You need updated clients to work with the updated server.  Old clients used the old MySQL native password password not the new chaching_ha2_password as the default.

When upgrading from 5,7,21 to the 8 GA version, existing accounts are not upgraded,  But if you are starting with a fresh install you get the chaching_sha2_password in your mysql.user entry.   I am sure this will catch someone so please take care. And this goes for new replication servers too! 

End of an Era: Neither MC nor Continuent Attending Percona Live

$
0
0

Continuent have been a long term sponsor of the Percona Live conference, and the MySQL conference as it was before that, for many years. We have attended the conference both as a Diamond sponsor, and members of our staff attending and presenting our products and experience at the conference.

The nature of these conferences always changes over time, and we have seen over the last few years how the Percona Live conference has moved from being a pure MySQL conference to an open source database conference. Although Continuent continue to provide open source software and integrate with many open source databases, our core operation still revolves around MySQL clustering and replication for MySQL and Oracle.

Continuent is also evolving and changing and we are increasingly deploying and moving towards pure cloud-based environments, building and developing products that are used on the cloud or explicitly leverage cloud computing technology. We have a number of new products and initiatives specifically targeting these areas.

Over the course of the next year we will be releasing cloud editions of our clustering, replication and new backup and proxy services both directly and through our partners.

As such, this year we have made the difficult decision not to sponsor or attend the Percona Live conference, directing our energies to other conferences, webinars and meetups. We will be attending the AWS conference, for example, and we fully intend to be at some other select conferences this year dealing with analytics, in-memory computing, and cloud-based deployments.

To stay up-to-date with what Continuent are doing, keep reading the Continuent blog and follow us on Twitter and Facebook.

Fun with Bugs #63 - On Bugs Detected by ASan

$
0
0
Among other things Geir Hoydalsvik stated in his nice post yesterday:
 "We’ve fixed a number of bugs detected by UBsan and Asan."
This is indeed true, I already noted many related bugs fixed in recent MySQL 8.0.4. But I think that a couple of details are missing in the blog post. First of all, there still a notable number of bugs detected by ASan or noted in builds with ASan that remain "Verified". Second, who actually found and reported these bugs?

I decided to do a quick search and present my summary to clarify these details. Let me start with the list of "Verified" or "Open" bugs in public MySQL bugs database, starting from the oldest one:
  • Bug #69715 - "UBSAN: Item_func_mul::int_op() mishandles 9223372036854775809*-1". The oldest related "Verified" bug I found was reported back in 2013 by Arthur O'Dwyer. Shane Bester from Oracle kindly keeps checking it with recent and upcoming releases, so we know that even '9.0.0-dmr-ubsan' (built on 20 October 2017) was still affected.
  • Bug #80309 - "some innodb tests fail with address sanitizer (WITH_ASAN)". It was reported by Richard Prohaska and remains "Verified" for more than two years already.
  • Bug #80581 - "rpl_semi_sync_[non_]group_commit_deadlock crash on ASan, debug". This bug reported by Laurynas Biveinis from Percona two years ago is still "Verified".
  • Bug #81674 - "LeakSanitizer-enabled build fails to bootstrap server for MTR". This bug reported by  Laurynas Biveinis affects only MySQL 5.6, but still, why not to backport the fix from 5.7?
  • Bug #82026 - "Stack buffer overflow with --ssl-cipher=<more than 4K characters>". Bug detected by ASan was noted by Yura Sorokin from Percona and reported by Laurynas Biveinis.
  • Bug #82915 - "SIGKILL myself when using innodb_limit_optimistic_insert_debug=2 and drop table". ASan debug builds are affected. This bug was reported by Roel Van de Paar from Percona.
  • Bug #85995 - "Server error exit due to empty datadir causes LeakSanitizer errors". This bug in MySQL 8.0.1 (that had to affect anyone who runs tests on ASan debug builds on a regular basis) was reported by Laurynas Biveinis and stay "Verified" for almost a year.
  • Bug #87129 - "Unstable test main.basedir". This test problem reported by Laurynas Biveinis affects ASan builds, among others. See also his Bug #87190 - "Test main.group_by is unstable".
  • Bug #87201 - "XCode 8.3.3+ -DWITH_UBSAN=ON bundled protobuf build error". Yet another (this time macOS-specific) bug found by Laurynas Biveinis.
  • Bug #87295 - "Test group_replication.gr_single_primary_majority_loss_1 produces warnings". Potential bug in group replication noted by Laurynas Biveinis in ASan builds.
  • Bug #87923 - "ASan reporting a memory leak on merge_large_tests-t". This bug by Laurynas Biveinis is still "Verified", while Tor Didriksen's comment states that it it resolved with the fix for Bug #87922 (that is closed as fixed in MySQL 8.0.4). Why not to close this one also?
  • Bug #89438 - "LeakSanitizer errors on xplugin unit tests". As Laurynas Biveinis found, X Plugin unit tests report errors with LeakSanitizer.
  • Bug #89439 - "LeakSanitizer errors on GCS unit tests". yet another bug report for MySQL 8.0.4 by Laurynas Biveinis.
  • Bug #89961 - "add support for clang ubsan". This request was made by Tor Didriksen from Oracle. It is marked as "fixed in 8.0.12". It means we may get MySQL 8.0.11 released soon. That's why I decided to mention the bug here.
There were also few other test failures noted on ASan debug builds. I skipped them to make this post shorter.

Personally I do not run builds or tests with ASan on a regular basis. I appreciate Oracle's efforts to make code warning-free, UBSan- and ASan-clean, and fix bugs found with ASan. But I'd also want them to process all/most of related bugs in public database properly before making announcements of new related achievement, and clearly admit and appreciate a lot of help and contribution from specific community members (mostly Laurynas Biveinis in this case).

Percona engineers seem to test ASan builds of MySQL 5.7 and 8.0 (or Percona's closely related versions) regularly, for years, and contribute back public bug reports. I suspect they found way more related bugs than internal Oracle's QA. I think we should explicitly thank them for this contribution that made MySQL better!

Windows Tools for MySQL DBAs: Basic Minidump Analysis

$
0
0

"To a man with a hammer, everything looks like a nail."

Even though I had written many posts explaining the use of gdb for various MySQL-related tasks, I have to use other OS level troubleshooting tools from time to time. Moreover, as MySQL and MariaDB are still supported and used under Microsoft Windows in production by customers I have to serve them there, and use Windows-specific tools sometimes. So, I decided to start a series of posts (that I promised to my great colleague Vladislav Vaintroub (a.k.a Wlad) who helped me a lot over years and actually switched my attention from Performance Schema towards debuggers) about different Windows tools for MySQL DBAs (and support engineers).

Developers (and maybe even power users) on Windows probably know all I plan to describe and way more, by heart, but for me many things were not obvious and took some time to search, try or even ask for some advises... So, this series of posts is going to be useful at least for me (and mostly UNIX users, like me), as a source of hints and links that may save me some time and efforts in the future.

In this first post I plan to describe basic installation of "Debugging Tools for Windows" and use of cdb command line debugger to analyze minidumps (that one gets on Windows upon crashes when core-file option is added to my.ini and may get for hanging mysqld.exe process with minimal efforts using different tools) and get backtraces and few other details from them. I also plan to show simple command lines to share with DBAs and users whom you help, that allow to get useful details (more or less full backtraces, crash analysis, OS details etc) for further troubleshooting when/if dumps can not or should not be shared.
---
I have to confess: I use Microsoft Windows on desktops and laptops. I started from Windows 3.0 back in 1992 and ended with Windows 10 on my wife's laptop. I use Windows even for work. Today 2 of my 4 machines used for work-related tasks run Windows (64-bit XP on old Dell box I've got from MySQL AB back in 2005 and 64-bit Windows 7 on this Acer netbook). At the same time, most of work I have to do since 1992 is related to UNIX of all kinds (from Xenix and SCO OpenDesktop that I connected to from VT220 terminal in at my first job after the university, to recent Linux versions used by customers in production, my Fedora 27 box and Ubuntu 14.04 netbook used as build, Docker, VirtualBox, testing, benchmarking etc servers). I had never become a real powerful user of Windows (no really complex .bat files, PowerShell programming or even Basic macros in Word, domains, shadow copy services usage for backups, nothing fancy). But on UNIX I had to master shell, vi :), some Perl and a lot of command line tools.

I had to do some software development on Windows till 2005, built MySQL on Windows sometimes up to 2012 when I joined Percona (that had nothing to do with Windows at all), so I have old version of Visual Studio, some older WinDbg and other debugging tools here and there, but had not used them more than once a year, until recently... Last time I attached WinDbg to anything MySQL-related it was MariaDB 10.1.13, during some troubleshooting related to MDEV-10191.

Suddenly in March I've got issues from customers related to hanging upon startup/InnoDB recovery and under load, and crashing while using some (somewhat exotic) storage engine, all these - on modern versions of Microsoft Windows, in production. I had no other option but to get and study backtraces (of all threads or crashing threads) and check source code. It would be so easy to get them on Linux (just ask them to install gdb , attach it to hanging mysqld process or point out to the mysqld binary and core, and get the output of thread apply all backtrace, minor details aside). But how to do this on Winsdows, in command line if possible (as I hate to share screenshots and write long explanations on where to click and what to copy/paste)? I had to check in WinDbg, get some failures because of my outdated and incomplete environment (while customer with proper environment provided useful outputs anyway), then, eventually, asked Wlad for some help. Eventually I was able to make some progress.

To be ready to do this again next time with confidence, proper test environment and without wasting anybody else's time, I decided to repeat some of these efforts in clean environment and make notes, that I am going to share in this series of blog posts. Today I'll concentrate on installing current "Debugging Tools for Windows" and using cdb from them to process minidumps.

1. Installing "Debugging Tools for Windows"

There is a nice, easy to find document from Microsoft on how to get cdb and other debugging tools for Windows. For recent versions you just have to download Windows 10 SDK and then install these tools (and everything else you may need) from it. Proceed to this page, read the details, click on "Download .EXE" to get winsdksetup.exe , start it and select "Debugging Tools for Windows" when requested to select the features. Eventually you'll get some 416+ MB downloaded and installed by default in C:\Program Files (x86)\Windows Kits\10\Debuggers\. (on default 64-bit Windows installation with C: as system disk). Quick check shows I have everything I need:
C:\Program Files (x86)\Windows Kits\10\Debuggers\x64>dir
...
11/10/2017  11:55 PM           154,936 cdb.exe
...
11/10/2017  11:55 PM           576,312 windbg.exe
...
Here is the list of most useful cdb options for the next step:
C:\Program Files (x86)\Windows Kits\10\Debuggers\x64>cdb /?
cdb version 10.0.16299.91
usage: cdb [options]

Options:

  <command-line> command to run under the debugger
  -? displays command line help text
...
  -i <ImagePath> specifies the location of the executables that generated the
                 fault (see _NT_EXECUTABLE_IMAGE_PATH)
...
  -lines requests that line number information be used if present
...
  -logo <logfile> opens a new log file
...
  -p <pid> specifies the decimal process ID to attach to
...
  -pv specifies that any attach should be noninvasive
...
  -y <SymbolsPath> specifies the symbol search path (see _NT_SYMBOL_PATH)
  -z <CrashDmpFile> specifies the name of a crash dump file to debug
...
Environment Variables:

    _NT_SYMBOL_PATH=[Drive:][Path]
        Specify symbol image path.
...
Control Keys:

     <Ctrl-B><Enter> Quit debugger
...
Remember Crtl-B key combination as a way to quit from cdb. I looked as funny as the beginner vi user few times, clicking on everything to get out of that tool...

2. Basic Use of cdb to Process Minidump

Let's assume you've got mysqld.dmp minidump file (a kind of "core" file on UNIX, but better, at least smaller usually) created during some crash. Depending on binaries used, you may need to make sure you have .PDB files in some directory, for the mysqld.exe binary and all .dll files for plugins/extra storage engines used, in some directory. Default path to .PDB files is defined by the _NT_SYMBOL_PATH environment variable and may include multiple directories ad URLs.

Initially I've got advice to set this environment variable as follows:
set _NT_SYMBOL_PATH=srv*c:\symbols*http://msdl.microsoft.com/download/symbols
This assumes that I have a collection of .PDB files in c:\symbols on some locally available server and rely on Microsoft's symbols server for the rest. For anything missing we can always add -y option to point to some directory with additional .PDB files. Note that MariaDB provides .pdb files along with .exe in .msi installer, not only in .zip file with binaries.

So, if your mysqld.dmp file is located in h:\, mysqld.exe for the same version as generated that minidump is located in p:\software and all related .dll files and .pdb files for them all are also there, the command to get basic details about the crash in file h:\out.txt would be the following:
cdb -z h:\mysqld.dmp -i p:\software -y p:\software -logo h:\out.txt -c "!sym prompts;.reload;.ecxr;q"
You can click on every option underlined above to get details. It produces output like this:
C:\Program Files (x86)\Windows Kits\10\Debuggers\x64>cdb -z h:\mysqld.dmp -i p:\
software -y p:\software -logo h:\out.txt -c "!sym prompts;.reload;.ecxr;q"


Microsoft (R) Windows Debugger Version 10.0.16299.91 AMD64
Copyright (c) Microsoft Corporation. All rights reserved.


Loading Dump File [h:\mysqld.dmp]
User Mini Dump File: Only registers, stack and portions of memory are available


************* Path validation summary **************
Response                         Time (ms)     Location
OK                                             p:\software

************* Path validation summary **************
Response                         Time (ms)     Location
OK                                             p:\software
Deferred                                       srv*c:\symbols*http://msdl.micros
oft.com/download/symbols
Symbol search path is: p:\software;srv*c:\symbols*http://msdl.microsoft.com/down
load/symbols
Executable search path is: p:\software
Windows 10 Version 14393 MP (4 procs) Free x64
Product: Server, suite: TerminalServer SingleUserTS
10.0.14393.206 (rs1_release.160915-0644)
Machine Name:
Debug session time: ...
System Uptime: not available
Process Uptime: 0 days X:YY:ZZ.000
............................................
This dump file has an exception of interest stored in it.
The stored exception information can be accessed via .ecxr.
(1658.fd0): Access violation - code c0000005 (first/second chance not available)

ntdll!NtGetContextThread+0x14:
00007fff`804a7d84 c3              ret
0:053> cdb: Reading initial command '!sym prompts;.reload;.ecxr;q'
quiet mode - symbol prompts on
............................................
rax=0000000000000000 rbx=0000000000000000 rcx=0000000000000006
rdx=000001cf0ac2e118 rsi=000001cf0abeeef8 rdi=000001cf0ac2e118
rip=00007fff5f313b0d rsp=000000653804e2b0 rbp=000001cf165c9cc8
 r8=0000000000000000  r9=00007fff5f384448 r10=000000653804ef70
r11=000000653804eb28 r12=0000000000000000 r13=000001cf0ab49d48
r14=0000000000000000 r15=000001cf0b083028
iopl=0         nv up ei pl zr na po nc
cs=0033  ss=002b  ds=002b  es=002b  fs=0053  gs=002b             efl=00010246
ha_spider!spider_db_connect+0xdd:
00007fff`5f313b0d 8b1498          mov     edx,dword ptr [rax+rbx*4] ds:00000000`
00000000=????????
quit:

C:\Program Files (x86)\Windows Kits\10\Debuggers\x64>
that also goes to the file pointed out by the -logo option. Here we have some weird crash in Spider engine of MariaDB that  is not a topic of current post.

If you think the crash is related to some activity of other threads, you can get all unique stack dumps with the following options:
cdb -lines -z h:\mysqld.dmp -i p:\software -y p:\software -logo h:\out.txt -c "!sym prompts;.reload;!uniqstack -p;q"
This is how the backtrace of slave SQL thread may look like, note files with line numbers for each frame (-lines option):
. 44  Id: 1658.1584 Suspend: 0 Teb: 00000065`32185000 Unfrozen
      Priority: 0  Priority class: 32
Child-SP          RetAddr           Call Site
00000065`353fed08 00007fff`8046d119 ntdll!NtWaitForAlertByThreadId+0x14
00000065`353fed10 00007fff`7cbd8d78 ntdll!RtlSleepConditionVariableCS+0xc9
00000065`353fed80 00007ff6`2d7d62e7 KERNELBASE!SleepConditionVariableCS+0x28
00000065`353fedb0 00007ff6`2d446c8e mysqld!pthread_cond_timedwait(struct _RTL_CO
NDITION_VARIABLE * cond = 0x000001ce`66805688, struct _RTL_CRITICAL_SECTION * mu
tex = 0x000001ce`668051b8, struct timespec * abstime = <Value unavailable error>
)+0x27 [d:\winx64-packages\build\src\mysys\my_wincond.c @ 85]
(Inline Function) --------`-------- mysqld!inline_mysql_cond_wait+0x61 [d:\winx6
4-packages\build\src\include\mysql\psi\mysql_thread.h @ 1149]
00000065`353fede0 00007ff6`2d4b1718 mysqld!MYSQL_BIN_LOG::wait_for_update_relay_
log(class THD * thd = <Value unavailable error>)+0xce [d:\winx64-packages\build\
src\sql\log.cc @ 8055]
00000065`353fee90 00007ff6`2d4af03f mysqld!next_event(struct rpl_group_info * rg
i = 0x000001ce`667fe560, unsigned int64 * event_size = 0x00000065`353ff008)+0x2b
8 [d:\winx64-packages\build\src\sql\slave.cc @ 7148]
00000065`353fef60 00007ff6`2d4bb038 mysqld!exec_relay_log_event(class THD * thd
= 0x000001ce`6682ece8, class Relay_log_info * rli = 0x000001ce`66804d58, struct
rpl_group_info * serial_rgi = 0x000001ce`667fe560)+0x8f [d:\winx64-packages\buil
d\src\sql\slave.cc @ 3866
]
00000065`353ff000 00007ff6`2d7d35cb mysqld!handle_slave_sql(void * arg = 0x00000
1ce`66803430)+0xa28 [d:\winx64-packages\build\src\sql\slave.cc @ 5145]
00000065`353ff780 00007ff6`2d852d51 mysqld!pthread_start(void * p = <Value unava
ilable error>)+0x1b [d:\winx64-packages\build\src\mysys\my_winthread.c @ 62]
(Inline Function) --------`-------- mysqld!invoke_thread_procedure+0xe [d:\th\mi
nkernel\crts\ucrt\src\appcrt\startup\thread.cpp @ 91]
00000065`353ff7b0 00007fff`80338364 mysqld!thread_start<unsigned int (void * par
ameter = 0x00000000`00000000)+0x5d [d:\th\minkernel\crts\ucrt\src\appcrt\startup
\thread.cpp @ 115]
00000065`353ff7e0 00007fff`804670d1 kernel32!BaseThreadInitThunk+0x14
00000065`353ff810 00000000`00000000 ntdll!RtlUserThreadStart+0x21
For crash analysis usually !analyze command is also used:
cdb -lines -z h:\mysqld.dmp -i p:\software -y p:\software -logo h:\out.txt -c "!sym prompts;.reload;!analyze -v;q"
It may give some details about the exception happened:
...
FAULTING_IP:
ha_spider!spider_db_connect+dd00007fff`5f313b0d 8b1498          mov     edx,dword ptr [rax+rbx*4]

EXCEPTION_RECORD:  (.exr -1)
ExceptionAddress: 00007fff5f313b0d (ha_spider!spider_db_connect+0x00000000000000
dd)
   ExceptionCode: c0000005 (Access violation)
  ExceptionFlags: 00000000
NumberParameters: 2
   Parameter[0]: 0000000000000000
   Parameter[1]: 0000000000000000
Attempt to read from address 0000000000000000
DEFAULT_BUCKET_ID:  NULL_POINTER_READ

PROCESS_NAME:  mysqld.exe

ERROR_CODE: (NTSTATUS) 0xc0000005 - <Unable to get error code text>
...
STACK_TEXT:
00000065`3804e2b0 00007fff`5f3132ad : 00000000`00000000 000001cf`1741ab68 000001
cf`0b083028 000001cf`0ac2e118 : ha_spider!spider_db_connect+0xdd
00000065`3804e330 00007fff`5f3117f8 : 000001ce`669107c8 000001cf`0ac2e118 000001
cf`1741ab68 00000000`00000001 : ha_spider!spider_db_conn_queue_action+0xad
00000065`3804ea20 00007fff`5f31a1ee : 00000000`00000000 000001cf`0abeeef8 000000
00`00000000 000001cd`c0b30000 : ha_spider!spider_db_before_query+0x108
00000065`3804eaa0 00007fff`5f31a0bf : 00000000`00000000 00000000`00000000 000000
65`3804ec70 00000000`00000038 : ha_spider!spider_db_set_names_internal+0x11e
00000065`3804eb30 00007fff`5f369b4e : 00000000`00000000 00000065`3804ec70 00007f
ff`5f387f08 00000000`00000000 : ha_spider!spider_db_set_names+0x3f
00000065`3804eb70 00007fff`5f32f5f1 : 00000000`00000001 00000065`00000000 41cfff
ff`00000001 00000000`00000001 : ha_spider!spider_mysql_handler::show_table_statu
s+0x15e
00000065`3804ece0 00007fff`5f3222e8 : 00000000`00000001 00000065`00000000 000000
00`5ab175cd 000001cf`0b0886f8 : ha_spider!spider_get_sts+0x201
00000065`3804edb0 00007ff6`2d7d35cb : 00000000`00000057 000001cf`0ab49d48 000000
00`00000000 00007fff`5f321c10 : ha_spider!spider_bg_sts_action+0x6d8
00000065`3804fa30 00007ff6`2d852d51 : 000001cf`17008fe0 000001cf`0aa3fef0 000000
00`00000000 00000000`00000000 : mysqld!pthread_start+0x1b
00000065`3804fa60 00007fff`80338364 : 00000000`00000000 00000000`00000000 000000
00`00000000 00000000`00000000 : mysqld!thread_start<unsigned int (__cdecl*)(void
 * __ptr64)>+0x5d
00000065`3804fa90 00007fff`804670d1 : 00000000`00000000 00000000`00000000 000000
00`00000000 00000000`00000000 : kernel32!BaseThreadInitThunk+0x14
00000065`3804fac0 00000000`00000000 : 00000000`00000000 00000000`00000000 000000
00`00000000 00000000`00000000 : ntdll!RtlUserThreadStart+0x21
...
Finally (for this post), this is how we can get information about a crashing thread, including details about local variables (like full backtrace in gdb). We apply !for_each_frame extension and use dv to "display variable":
cdb -z h:\mysqld.dmp -i p:\software -y p:\software -logo h:\out.txt -c "!sym prompts;.reload;.ecxr;!for_each_frame dv /t;q"
The result will include details about each frame, parameters and local variables, like this:
_ _ _ _ _ _ _ _ _ _ _ _ _ _ _ _
00 00000065`3804e2b0 00007fff`5f3132ad ha_spider!spider_db_connect+0xdd
struct st_spider_share * share = 0x000001cf`165c9cc8
struct st_spider_conn * conn = 0x000001cf`0ac2e118
int link_idx = 0n0
int error_num = <value unavailable>
class THD * thd = 0x000001cf`0abeeef8
int64 connect_retry_interval = <value unavailable>
int connect_retry_count = <value unavailable>
int64 tmp_time = <value unavailable>
_ _ _ _ _ _ _ _ _ _ _ _ _ _ _ _
01 00000065`3804e330 00007fff`5f3117f8 ha_spider!spider_db_conn_queue_action+0xa
d
struct st_spider_conn * conn = 0x000001cf`0ac2e118
int error_num = 0n0
char [1532] sql_buf = char [1532] ""
class spider_string sql_str = class spider_string
class spider_db_result * result = <value unavailable>
struct st_spider_db_request_key request_key = struct st_spider_db_request_key
_ _ _ _ _ _ _ _ _ _ _ _ _ _ _ _
02 00000065`3804ea20 00007fff`5f31a1ee ha_spider!spider_db_before_query+0x108
struct st_spider_conn * conn = 0x000001cf`0ac2e118
int * need_mon = 0x000001cf`1741ab68
int error_num = 0n0
bool tmp_mta_conn_mutex_lock_already = true
class ha_spider * spider = <value unavailable>
bool tmp_mta_conn_mutex_unlock_later = <value unavailable>
_ _ _ _ _ _ _ _ _ _ _ _ _ _ _ _
03 00000065`3804eaa0 00007fff`5f31a0bf ha_spider!spider_db_set_names_internal+0x
11e
struct st_spider_transaction * trx = 0x000001cf`0b083028
struct st_spider_share * share = 0x000001cf`0ab49d48
struct st_spider_conn * conn = 0x000001cf`0ac2e118
int all_link_idx = 0n0
int * need_mon = 0x000001cf`1741ab68
bool tmp_mta_conn_mutex_lock_already = true
_ _ _ _ _ _ _ _ _ _ _ _ _ _ _ _
04 00000065`3804eb30 00007fff`5f369b4e ha_spider!spider_db_set_names+0x3f
class ha_spider * spider = <value unavailable>
struct st_spider_conn * conn = <value unavailable>
int link_idx = <value unavailable>
_ _ _ _ _ _ _ _ _ _ _ _ _ _ _ _
05 00000065`3804eb70 00007fff`5f32f5f1 ha_spider!spider_mysql_handler::show_tabl
e_status+0x15e
class spider_mysql_handler * this = 0x000001cf`0a15dd00
int link_idx = 0n0
int sts_mode = 0n1
unsigned int flag = 1
int error_num = 0n1
struct st_spider_share * share = 0x000001cf`0ab49d48
struct st_spider_conn * conn = 0x000001cf`0ac2e118
class spider_db_result * res = <value unavailable>
unsigned int64 auto_increment_value = 0
unsigned int pos = 0
struct st_spider_db_request_key request_key = struct st_spider_db_request_key
_ _ _ _ _ _ _ _ _ _ _ _ _ _ _ _
06 00000065`3804ece0 00007fff`5f3222e8 ha_spider!spider_get_sts+0x201
struct st_spider_share * share = 0x000001cf`0ab49d48
int link_idx = 0n0
int64 tmp_time = 0n1521579469
class ha_spider * spider = 0x00000065`3804ef70
double sts_interval = 10
int sts_mode = 0n1
int sts_sync = 0n0
int sts_sync_level = 0n2
unsigned int flag = 0x18
int error_num = <value unavailable>
int get_type = 0n1
struct st_spider_patition_handler_share * partition_handler_share = <value unava
ilable>
double tmp_sts_interval = <value unavailable>
struct st_spider_share * tmp_share = <value unavailable>
int tmp_sts_sync = <value unavailable>
class ha_spider * tmp_spider = <value unavailable>
int roop_count = <value unavailable>
int tmp_sts_mode = <value unavailable>
class THD * thd = <value unavailable>
_ _ _ _ _ _ _ _ _ _ _ _ _ _ _ _
07 00000065`3804edb0 00007ff6`2d7d35cb ha_spider!spider_bg_sts_action+0x6d8
void * arg = 0x000001cf`0ab49d48
int error_num = 0n0
class ha_spider spider = class ha_spider
unsigned int * conn_link_idx = 0x000001cf`1741ab78
unsigned char * conn_can_fo = 0x000001cf`1741ab80 "--- memory read error at addr
ess 0x000001cf`1741ab80 ---"
struct st_spider_conn ** conns = 0x000001cf`1741ab70
int * need_mons = 0x000001cf`1741ab68
int roop_count = 0n0
char ** conn_keys = 0x000001cf`1741ab88
class THD * thd = 0x000001cf`0abeeef8
class spider_db_handler ** dbton_hdl = 0x000001cf`1741ab90
struct st_spider_transaction * trx = 0x000001cf`0b083028
struct st_mysql_mutex spider_global_trx_mutex = <value unavailable>
_ _ _ _ _ _ _ _ _ _ _ _ _ _ _ _
08 00000065`3804fa30 00007ff6`2d852d51 mysqld!pthread_start+0x1b
void * p = <value unavailable>
void * arg = 0x000001cf`0ab49d48
<function> * func = 0x00007fff`5f321c10
_ _ _ _ _ _ _ _ _ _ _ _ _ _ _ _
09 (Inline Function) --------`-------- mysqld!invoke_thread_procedure+0xe
void * context = 0x000001cf`17008fe0
_ _ _ _ _ _ _ _ _ _ _ _ _ _ _ _
0a 00000065`3804fa60 00007fff`80338364 mysqld!thread_start<unsigned int (__cdecl
*)(void * __ptr64)>+0x5d
void * parameter = 0x00000000`00000000
<function> * procedure = 0x00007ff6`2d7d35b0
_ _ _ _ _ _ _ _ _ _ _ _ _ _ _ _
0b 00000065`3804fa90 00007fff`804670d1 kernel32!BaseThreadInitThunk+0x14
Unable to enumerate locals, Win32 error 0n87
Private symbols (symbols.pri) are required for locals.
Type ".hh dbgerr005" for details.
_ _ _ _ _ _ _ _ _ _ _ _ _ _ _ _
0c 00000065`3804fac0 00000000`00000000 ntdll!RtlUserThreadStart+0x21
Unable to enumerate locals, Win32 error 0n87
Private symbols (symbols.pri) are required for locals.
Type ".hh dbgerr005" for details.
--- 

Stay tuned. I keep working on complex MySQL/MariaDB problems under Windows, so soon will have few more findings and links to share.

Reading Amazon RDS MySQL/Aurora log file from terminal.

$
0
0

Introduction:

At Mydbops we support a good number of clients on AWS cloud (Aurora and RDS).

Amazon Relational Database Service (RDS) is providing the cloud based database service. It is the cost-efficient, resize able & ease to manage. As in any other DBaaS, If you need to analyse the log files (Error log / Slow log), you need to login the console and manually download the files.

Logging into the console seems simple, But this is a bit complex operation when it comes to incorporate that in a day to day operation and automation. In this blog i would like to share my experience in making this into a straightforward process for downloading the log files directly from command line without console GUI.

Prerequisites:

Following tools are to be installed for this operation.

  • awscli – Cli utility for AWS Cloud
  • jq – Utility For Parse And Format JSON Data, Just like SED for JSON
for linux,
yum install -y awscli jq

for Ubuntu,
apt-get install awscli jq


Step 1 – ( Configuring the AWS account )

After the installation, the Server should be configured with the respective AWS account as well as region using aws configure command.

Output –

[sakthi@mydbops_labs ~]$ aws configure
AWS Access Key ID : xxxxxxxxxxxxxx
AWS Secret Access Key : yyyyyyyyy/zzzzzzzzzz
Default region name : us-west-2
Default output format : json

To find the exact region name you can use this link.  My Server is on Oregon, so i have used “us-west-2”.


Step 2 – ( Check the available Instances and their Status )

The Flag describe-db-instances is used to find the instances details and status.

# aws rds describe-db-instances

Output:

[sakthi@mydbops_labs ~]$ aws rds describe-db-instances | jq ' .DBInstances[] | select( .Engine ) | .DBInstanceIdentifier + ": " + .DBInstanceStatus'
"localmaster: available"
"mysql-rds: available"
"slave-tuning: available"


Step 3 – ( Check the available log files for specific Instance )

describe-db-log-files command is used to get the log details. It can be provided with the db instance identifier to get the log files for that instance.

# aws rds describe-db-log-files –db-instance-identifier localmaster

Output:

[sakthi@mydbops_labs ~]$  aws rds describe-db-log-files --db-instance-identifier localmaster | jq
{
  "DescribeDBLogFiles": [
    {
      "LastWritten": 1518969300000,
      "LogFileName": "error/mysql-error-running.log",
      "Size": 0
    },
    {
      "LastWritten": 1501165840000,
      "LogFileName": "mysqlUpgrade",
      "Size": 3189
    },
    {
      "LastWritten": 1519032900000,
      "LogFileName": "slowquery/mysql-slowquery.log",
      "Size": 1392
    }

Note: Size is given in bytes

Step 4 – ( Download the specific log file )

download-db-log-file-portion command is used to download the log files, It has to be given along with the db-instance-identifier and log-file-name, we have identified on the previous step and output type.

[sakthi@mydbops_labs ~]$ aws rds download-db-log-file-portion --db-instance-identifier localmaster --log-file-name "slowquery/mysql-slowquery.log.13" --output text > rds_slow.log
[sakthi@mydbops_labs ~]$ ls -lrth | grep -i rds_slow.log
-rw-rw-r--.  1 sakthi sakthi  34K Feb 19 09:43 rds_slow.log

–output determines the output type of the file to be downloaded, It will support the following options.

  • JSON
  • TABLE
  • TEXT

Output Examples –

Table Output -
| LogFileData| 
2018-03-23 11:55:11 47633684932352 [Warning] Aborted connection 425753 to db: 'unconnected' user: 'rdsadmin' host: 'localhost' (Got timeout reading communication packets)

JSON Output -
{
 "LogFileData": "2018-03-23 11:55:11 47633684932352 [Warning] Aborted connection 425753 to db: 'unconnected' user: 'rdsadmin' host: 'localhost' (Got timeout reading communication packets)

TEXT Output -
2018-03-23 11:55:11 47633684932352 [Warning] Aborted connection 425753 to db: 'unconnected' user: 'rdsadmin' host: 'localhost' (Got timeout reading communication packets)


Implementing In Production:

I have given some use case scenario explanations with examples of production implementation for effective database operation.

Scenario 1: ( Integrating with Pt-query-digest )

We can easily manipulate the slow log files with Percona tool pt-query-digest by making the simple automation scripts. Below is a sample script to analyse the slow logs with Percona toolkit from my local master server.

Script: digest_rds_slow_log.sh

#bin/bash

path="/home/sakthi"
echo -en "\navailable Instances - \n\n"
info=$(aws rds describe-db-instances | jq ' .DBInstances[] | select( .Engine ) | .DBInstanceIdentifier + ": " + .DBInstanceStatus' | awk '{ print $1, $2 }' | sed 's/\"//g' | sed 's/,//g' | sed 's/://g' | nl )
echo "$info"
echo -en "\n";read -p "enter instance name : " instance

if [[ $(echo "$info" | grep -sw "$instance" | wc -l) -eq 1 ]]; then
 rds_node=$(echo "$info" | grep -sw "$instance" | awk '{print $2}');
else
 echo "Instance not found";
 exit;
fi

echo -en "\navailable slow logs for $rds_node \n\n"
log_files=`aws rds describe-db-log-files --db-instance-identifier $rds_node | grep slowquery | awk '{ print $2 }' | sed 's/\"//g' | sed 's/,//g' | head -n5`

if [[ $(echo "$log_files" | wc -c) -gt 1 ]]; then
 echo "$log_files"
else
 echo -en "\nno slow log files .. exiting the script [script]\n"
 exit
fi

echo -en "\n";read -p "enter slow log file : " log_file
aws rds download-db-log-file-portion --db-instance-identifier $rds_node --log-file-name $log_file --output text > $path/recent.log

if [[ -f /usr/bin/pt-query-digest || -f /bin/pt-query-digest ]]; then

pt-query-digest --limit=95% --set-vars='ssl_verify_mode='SSL_VERIFY_NONE'' $path/recent.log > $path/slow_pt_result.log
echo -en "\n\nstatus ... [done] \n\no/p file - $path/slow_pt_result.log\n\nBye\n"

else
echo "pt-query-digest not found [exit]\n"
fi

exit
Output:

[sakthi@mydbops_labs ~]$ bash digest_rds_slow_log.sh

available Instances -

 1 localmaster available
 2 slave-tuning available
 3 mysql-rds available

enter instance name : 2  #choosing the respective number

available slow logs for localmaster

slowquery/mysql-slowquery.log
slowquery/mysql-slowquery.log.0
slowquery/mysql-slowquery.log.1
slowquery/mysql-slowquery.log.10
slowquery/mysql-slowquery.log.11

enter slow log file : slowquery/mysql-slowquery.log.10
status ... [done]
o/p file - /home/sakthi/slow_pt_result.log
Bye


Scenario 2 – ( Accessing the latest ERROR log from any Server in the region )

We can easily check the Server’s recent ERROR log files in a single command. This will be really helpful in case of any MySQL crash happens.

We will be reading the running log

[sakthi@mydbops_labs ~]$ cat read_rds_error

#bin/bash
path="/home/sakthi"
echo -en "\navailable Instances - \n\n"
aws rds describe-db-instances | jq ' .DBInstances[] | select( .Engine ) | .DBInstanceIdentifier + ": " + .DBInstanceStatus' | awk '{ print $1 }' | sed 's/\"//g' | sed 's/,//g' | sed 's/://g'
echo -en "\n";read -p "enter instance name : " instance
aws rds download-db-log-file-portion --db-instance-identifier $instance --log-file-name "error/mysql-error-running.log" --output text | less

Output -

[sakthi@mydbops_labs ~]$ read_rds_error

available Instances -
localmaster
mysql-rds
slave-tuning

enter instance name : localmaster


Conclusion –

I believe this blog post will help you in handling day to day DBA  tasks easier on your RDS Environment. We are keep testing the new things on Amazon RDS Cloud, will be coming back with new stuff soon.

Photo Credits

Viewing all 18816 articles
Browse latest View live


<script src="https://jsc.adskeeper.com/r/s/rssing.com.1596347.js" async> </script>