Quantcast
Channel: Planet MySQL
Viewing all 18801 articles
Browse latest View live

MariaDB AX Distributed Tarball Installation

$
0
0
MariaDB AX Distributed Tarball Installation Faisal Wed, 08/01/2018 - 08:13

This guide is meant to help set up a MariaDB AX cluster using TARBALL tar.gz binary image instead of RPM files with a non-root account on CentOS 7 machines. But we still need to install some dependencies using root and yum repository manager.

By the end of this, we will have a 2 User Modules (UM), 3 Performance Module (PM) node cluster running on local storage.

Summary

Download the latest tarball binaries for MariaDB AX.

The following is the summary of tasks to be performed:

  • VMs OS prerequisites setup
    • We will be using CentOS 7, it should be identical for Red Hat Enterprise Linux as well.
  • Create MariaDB ColumnStore owner account and a group as mcsadm and set its password.
  • Setup the /etc/hosts file on all the nodes with IP - HostName mapping for easier access.
  • Download the ColumnStore TARBALL and extract it under /home/mcsadm.
  • Generate ssh key on PM1 using mcsadm user and copy the key to all the nodes.
  • Generate ssh key on UM1 and copy the public key to UM1 and UM2.
    • This is used for UM1 to UM2 data replication.
  • Generate ssh key on UM2 and copy the public key to UM2 and UM1.
    • This is used for UM2 to UM1 data replication.
  • Server preparation
    • Using the root user
      • Install the ColumnStore dependencies on all nodes using yum
      • setup umask on all nodes
      • setup sudo access on all nodes for mcsadm user
      • setup ulimit on all nodes for mcsadm user
  • Test the setup using the ClusterTest tool using mcsadm user

Preparing the VM OS

There are a few important things that are required before we start the installations.

Note: the following steps must be performed and validated on all the VMs

Disable SELinux

For this we will edit the SELinux configuration, in the file /etc/selinux/config, make sure to change SELINUX=disabled and it should look like this:

# This file controls the state of SELinux on the system.
# SELINUX= can take one of these three values:
#     enforcing - SELinux security policy is enforced.
#     permissive - SELinux prints warnings instead of enforcing.
#     disabled - No SELinux policy is loaded.
SELINUX=disabled
# SELINUXTYPE= can take one of these two values:
#     targeted - Targeted processes are protected,
#     minimum - Modification of targeted policy. Only selected processes are protected.
#     mls - Multi Level Security protection.
SELINUXTYPE=targeted

After saving and exiting, we will need to reboot the VM to take permanent effect. Check if the SELinux has actually been disabled, use either of the two commands (sestatus/getenforce) to confirm:

[root@localhost ~] sestatus
SELinux status:                 disabled

[root@localhost ~] getenforce
Disabled

Disable firewalld

Firewalld is a standard service that is disabled using the command systemctl on the RHEL 7 / CentOS 7. Disable it on all the nodes and check its status using the systemctl status firewalld:

[root@localhost ~] systemctl stop firewalld

[root@localhost ~] systemctl disable firewalld
Removed symlink /etc/systemd/system/multi-user.target.wants/firewalld.service.
Removed symlink /etc/systemd/system/dbus-org.fedoraproject.FirewallD1.service.

[root@localhost ~] systemctl status firewalld
● firewalld.service - firewalld - dynamic firewall daemon
   Loaded: loaded (/usr/lib/systemd/system/firewalld.service; disabled; vendor preset: enabled)
   Active: inactive (dead)
     Docs: man:firewalld(1)

Change localedef

Execute the following on all the nodes to make sure proper character set across the cluster.

[root@localhost ~] localedef -i en_US -f UTF-8 en_US.UTF-8

Performance optimization considerations

Following are some of the network-related optimizations that we can do, please also consult with your network/OS administrators for other optimizations that might be beneficial.

GbE NIC settings:

Modify /etc/rc.d/rc.local to include the following:

/sbin/ifconfig eth0 txqueuelen 10000
Modify /etc/sysctl.conf for the following:
# increase TCP max buffer size

net.core.rmem_max = 16777216

net.core.wmem_max = 16777216

# increase Linux autotuning TCP buffer limits

# min, default, and max number of bytes to use

net.ipv4.tcp_rmem = 4096 87380 16777216

net.ipv4.tcp_wmem = 4096 65536 16777216

# don't cache ssthresh from previous connection

net.ipv4.tcp_no_metrics_save = 1

# recommended to increase this for 1000 BT or higher

net.core.netdev_max_backlog = 2500

# for 10 GigE, use this

net.core.netdev_max_backlog = 30000

NOTE: Make sure there is only 1 setting of net.core.netdev_max_backlog in the /etc/sysctl.conf file.

Cache memory settings

To optimize Linux to cache directories and inodes the vm.vfs_cache_pressure can be set to a lower value than 100 to attempt to retain caches for inode and directory structures. This will help improve read performance. A value of 10 is suggested. The following commands must all be run as the root user or with sudo.

To check the current value:

cat /proc/sys/vm/vfs_cache_pressure

Add the following to /etc/sysctl.conf to make the cache changes permanent.

vm.vfs_cache_pressure = 10

Create mcsadm account

Now we are ready to create the MariaDB ColumnStore owner account mcsadm which will be used for the installation of the tarball.

The mcsadm user and group are required to be created on all the nodes. sudo privilege to the mcsadm user is also mandatory, this requirement of sudo access is being removed in future releases of ColumnStore.

Following this, all steps will be done using mcsadm user with the help of sudo unless specified differently.

Remember to set mcsadm user's password as it will be required later on for key exchange.

[root@localhost ~] groupadd mcsadm
[root@localhost ~] useradd -g mcsadm mcsadm

[root@localhost ~] passwd mcsadm
Changing password for user mcsadm.
New password:
Retype new password:
passwd: all authentication tokens updated successfully.

Setup /etc/hosts file

Add the following to the file /etc/hosts on all the nodes. This will ensure all nodes are accessible by their respective hostnames.

192.168.56.104 UM1
192.168.56.105 UM2
192.168.56.106 PM1
192.168.56.107 PM2
192.168.56.108 PM3

Download

In this case, we are going to download the tar file directly from the server, but feel free to download it externally and transfer to the server using your favorite secure file transfer tools.

[mcsadm@pm1 ~]$ wget https://downloads.mariadb.com/MariaDB/mariadb-columnstore/latest/centos/x86_64/7/mariadb-columnstore-1.1.5-1-centos7.x86_64.bin.tar.gz
--2018-06-30 14:02:50--  https://downloads.mariadb.com/MariaDB/mariadb-columnstore/latest/centos/x86_64/7/mariadb-columnstore-1.1.5-1-centos7.x86_64.bin.tar.gz
Resolving downloads.mariadb.com (downloads.mariadb.com)... 51.255.94.155, 2001:41d0:1004:249b::
Connecting to downloads.mariadb.com (downloads.mariadb.com)|51.255.94.155|:443... connected.
HTTP request sent, awaiting response... 200 OK
Length: 489245964 (467M) [application/octet-stream]
Saving to: ‘mariadb-columnstore-1.1.5-1-centos7.x86_64.bin.tar.gz’

100%[================================================================>] 489,245,964 5.54MB/s   in 2m 16s

2018-06-30 14:05:13 (3.44 MB/s) - ‘mariadb-columnstore-1.1.5-1-centos7.x86_64.bin.tar.gz’ saved [489245964/489245964]

[mcsadm@pm1 ~]$ ls -rlt
total 477780
-rw-rw-r-- 1 mcsadm mcsadm 489245964 Jun 15 16:45 mariadb-columnstore-1.1.5-1-centos7.x86_64.bin.tar.gz

[mcsadm@pm1 downloads]$ tar -zxf mariadb-columnstore-1.1.5-1-centos7.x86_64.bin.tar.gz

[mcsadm@pm1 ~]$ ls -rlt
total 0
drwxr-xr-x 3 mcsadm mcsadm 25 Jun 11 19:29 mariadb
-rw-rw-r-- 1 mcsadm mcsadm 489245964 Jun 15 16:45 mariadb-columnstore-1.1.5-1-centos7.x86_64.bin.tar.gz

[mcsadm@pm1 ~]$ pwd
/home/mcsadm

Generating SSH Keys

Once the tarball is downloaded and extracted under /home/mcsadm folder, generate the Key on PM1 node using ssh-keygen and then copy it to all the nodes using ssh-copyid -i

[mcsadm@pm1 ~]$ ssh-keygen
Generating public/private rsa key pair.
Enter file in which to save the key (/home/mcsadm/.ssh/id_rsa):
Enter passphrase (empty for no passphrase):
Enter same passphrase again:
Your identification has been saved in /home/mcsadm/.ssh/id_rsa.
Your public key has been saved in /home/mcsadm/.ssh/id_rsa.pub.
The key fingerprint is:
SHA256:IcAWtetlQw8vHS3QwAgS4vphvY22HdCJaCHYqRHa1ab mcsadm@um1
The key's randomart image is:
+---[RSA 2048]----+
|. . o..-.+ .=.   |
|o= + .B.+ +o *.  |
|= B .+.-. .+B.o  |
| * X o o E.+o-   |
|  * + o S .      |
| -+ o == . E     |
|  E o o--B       |
|    - + .        |
|    o .          |
+----[SHA256]-----+

[mcsadm@pm1 ~]$ ssh-copy-id -i ~/.ssh/id_rsa.pub pm1
/bin/ssh-copy-id: INFO: Source of key(s) to be installed: "/home/mcsadm/.ssh/id_rsa.pub"
The authenticity of host 'pm1 (192.168.56.106)' can't be established.
ECDSA key fingerprint is SHA256:Jle/edRpKz9ysV8xp1K9TlIGvbg8Sb1p+GbDob3Id0g.
ECDSA key fingerprint is MD5:a1:ce:9d:58:80:c6:ed:5a:95:7b:33:82:68:cb:0f:40.
Are you sure you want to continue connecting (yes/no)? yes
/bin/ssh-copy-id: INFO: attempting to log in with the new key(s), to filter out any that are already installed
/bin/ssh-copy-id: INFO: 1 key(s) remain to be installed -- if you are prompted now it is to install the new keys
mcsadm@pm1's password: ******

Number of key(s) added: 1

Now try logging into the machine, with:   "ssh 'pm1'"
and check to make sure that only the key(s) you wanted were added.

[mcsadm@pm1 ~]$ ssh pm1
Last login: Sat Jun 30 13:37:50 2018
[mcsadm@pm1 ~]$ exit
logout
Connection to pm1 closed.

[mcsadm@pm1 ~]$ ssh-copy-id -i ~/.ssh/id_rsa.pub pm2
/bin/ssh-copy-id: INFO: Source of key(s) to be installed: "/home/mcsadm/.ssh/id_rsa.pub"
The authenticity of host 'pm2 (192.168.56.107)' can't be established.
ECDSA key fingerprint is SHA256:Jle/edRpKz9ysV8xp1K9TlIGvbg8Sb1p+GbDob3Id0g.
ECDSA key fingerprint is MD5:a1:ce:9d:58:80:c6:ed:5a:95:7b:33:82:68:cb:0f:40.
Are you sure you want to continue connecting (yes/no)? yes
/bin/ssh-copy-id: INFO: attempting to log in with the new key(s), to filter out any that are already installed
/bin/ssh-copy-id: INFO: 1 key(s) remain to be installed -- if you are prompted now it is to install the new keys
mcsadm@pm2's password: ******

Number of key(s) added: 1

Now try logging into the machine, with:   "ssh 'pm2'"
and check to make sure that only the key(s) you wanted were added.

[mcsadm@pm1 ~]$ ssh pm2
[mcsadm@pm2 ~]$ exit
logout
Connection to pm2 closed.

[mcsadm@pm1 ~]$ ssh-copy-id -i ~/.ssh/id_rsa.pub pm3
/bin/ssh-copy-id: INFO: Source of key(s) to be installed: "/home/mcsadm/.ssh/id_rsa.pub"
The authenticity of host 'pm3 (192.168.56.108)' can't be established.
ECDSA key fingerprint is SHA256:Jle/edRpKz9ysV8xp1K9TlIGvbg8Sb1p+GbDob3Id0g.
ECDSA key fingerprint is MD5:a1:ce:9d:58:80:c6:ed:5a:95:7b:33:82:68:cb:0f:40.
Are you sure you want to continue connecting (yes/no)? yes
/bin/ssh-copy-id: INFO: attempting to log in with the new key(s), to filter out any that are already installed
/bin/ssh-copy-id: INFO: 1 key(s) remain to be installed -- if you are prompted now it is to install the new keys
mcsadm@pm3's password: ******

Number of key(s) added: 1

Now try logging into the machine, with:   "ssh 'pm3'"
and check to make sure that only the key(s) you wanted were added.

[mcsadm@pm1 ~]$ ssh pm3
[mcsadm@pm3 ~]$ exit
logout
Connection to pm3 closed.

[mcsadm@pm1 ~]$ ssh-copy-id -i ~/.ssh/id_rsa.pub um1
/bin/ssh-copy-id: INFO: Source of key(s) to be installed: "/home/mcsadm/.ssh/id_rsa.pub"
The authenticity of host 'um1 (192.168.56.104)' can't be established.
ECDSA key fingerprint is SHA256:Jle/edRpKz9ysV8xp1K9TlIGvbg8Sb1p+GbDob3Id0g.
ECDSA key fingerprint is MD5:a1:ce:9d:58:80:c6:ed:5a:95:7b:33:82:68:cb:0f:40.
Are you sure you want to continue connecting (yes/no)? yes
/bin/ssh-copy-id: INFO: attempting to log in with the new key(s), to filter out any that are already installed
/bin/ssh-copy-id: INFO: 1 key(s) remain to be installed -- if you are prompted now it is to install the new keys
mcsadm@um1's password:

Number of key(s) added: 1

Now try logging into the machine, with:   "ssh 'um1'"
and check to make sure that only the key(s) you wanted were added.

[mcsadm@pm1 ~]$ ssh um1
[mcsadm@um1 ~]$ exit
logout
Connection to um1 closed.
[mcsadm@pm1 ~]$ ssh-copy-id -i ~/.ssh/id_rsa.pub um2
/bin/ssh-copy-id: INFO: Source of key(s) to be installed: "/home/mcsadm/.ssh/id_rsa.pub"
The authenticity of host 'um2 (192.168.56.105)' can't be established.
ECDSA key fingerprint is SHA256:Jle/edRpKz9ysV8xp1K9TlIGvbg8Sb1p+GbDob3Id0g.
ECDSA key fingerprint is MD5:a1:ce:9d:58:80:c6:ed:5a:95:7b:33:82:68:cb:0f:40.
Are you sure you want to continue connecting (yes/no)? yes
/bin/ssh-copy-id: INFO: attempting to log in with the new key(s), to filter out any that are already installed
/bin/ssh-copy-id: INFO: 1 key(s) remain to be installed -- if you are prompted now it is to install the new keys
mcsadm@um2's password:

Number of key(s) added: 1

Now try logging into the machine, with:   "ssh 'um2'"
and check to make sure that only the key(s) you wanted were added.

[mcsadm@pm1 ~]$ ssh um2
[mcsadm@um2 ~]$ exit
logout
Connection to um2 closed.
[mcsadm@pm1 ~]$

Key Exchange between UM1 and UM2

Generate an SSH key on UM1 and copy in both UM1 and UM2, similarly generate another SSH key on UM2 and copy it to UM2 and UM1 respectively.

UM1:

[mcsadm@um1 ~]$ ssh-keygen
Generating public/private rsa key pair.
Enter file in which to save the key (/home/mcsadm/.ssh/id_rsa):
Enter passphrase (empty for no passphrase):
Enter same passphrase again:
Your identification has been saved in /home/mcsadm/.ssh/id_rsa.
Your public key has been saved in /home/mcsadm/.ssh/id_rsa.pub.
The key fingerprint is:
SHA256:IcXWteJlQw8vHK3YwAgS4vphvY2bHdCJaCHYqRHa1ro mcsadm@um1
The key's randomart image is:
+---[RSA 2048]----+
|. . o..o.+ .=.   |
|o= + . .+ +o *.  |
|= B . ... .+B.o  |
| * = o o o.+oo   |
|o * + o S .      |
| + o =           |
|  E o o          |
|     + .         |
|    o .          |
+----[SHA256]-----+
[mcsadm@um1 ~]$ ssh-copy-id -i ~/.ssh/id_rsa.pub um1
/bin/ssh-copy-id: INFO: Source of key(s) to be installed: "/home/mcsadm/.ssh/id_rsa.pub"
The authenticity of host 'um1 (192.168.56.104)' can't be established.
ECDSA key fingerprint is SHA256:Jle/edRpKz9ysV8xp1K9TlIGvbg8Sb1p+GbDob3Id0g.
ECDSA key fingerprint is MD5:a1:ce:9d:58:80:c6:ed:5a:95:7b:33:82:68:cb:0f:40.
Are you sure you want to continue connecting (yes/no)? yes
/bin/ssh-copy-id: INFO: attempting to log in with the new key(s), to filter out any that are already installed
/bin/ssh-copy-id: INFO: 1 key(s) remain to be installed -- if you are prompted now it is to install the new keys
mcsadm@um1's password:
Permission denied, please try again.
mcsadm@um1's password:

Number of key(s) added: 1

Now try logging into the machine, with:   "ssh 'um1'"
and check to make sure that only the key(s) you wanted were added.

[mcsadm@um1 ~]$ ssh-copy-id -i ~/.ssh/id_rsa.pub um2
/bin/ssh-copy-id: INFO: Source of key(s) to be installed: "/home/mcsadm/.ssh/id_rsa.pub"
The authenticity of host 'um2 (192.168.56.105)' can't be established.
ECDSA key fingerprint is SHA256:Jle/edRpKz9ysV8xp1K9TlIGvbg8Sb1p+GbDob3Id0g.
ECDSA key fingerprint is MD5:a1:ce:9d:58:80:c6:ed:5a:95:7b:33:82:68:cb:0f:40.
Are you sure you want to continue connecting (yes/no)? yes
/bin/ssh-copy-id: INFO: attempting to log in with the new key(s), to filter out any that are already installed
/bin/ssh-copy-id: INFO: 1 key(s) remain to be installed -- if you are prompted now it is to install the new keys
mcsadm@um2's password:

Number of key(s) added: 1

Now try logging into the machine, with:   "ssh 'um2'"
and check to make sure that only the key(s) you wanted were added.

[mcsadm@um1 ~]$ ssh um2
[mcsadm@um2 ~]$ exit
logout
Connection to um2 closed.
[mcsadm@um1 ~]$

UM2:

[mcsadm@um2 ~]$ ssh-keygen
Generating public/private rsa key pair.
Enter file in which to save the key (/home/mcsadm/.ssh/id_rsa):
Enter passphrase (empty for no passphrase):
Enter same passphrase again:
Your identification has been saved in /home/mcsadm/.ssh/id_rsa.
Your public key has been saved in /home/mcsadm/.ssh/id_rsa.pub.
The key fingerprint is:
SHA256:VSiUVyGkQQYcQE/WxeNP6wiWIWtNOfpSqzdEG/uImA8 mcsadm@um2
The key's randomart image is:
+---[RSA 2048]----+
|   .oo=*==+o+.   |
|     +..+o=o     |
|      . .=..     |
|      . B.. .    |
|       BSB o .   |
|      + X   o    |
|    E+ * = o     |
|    o.o * o .    |
|     .o+ .       |
+----[SHA256]-----+
[mcsadm@um2 ~]$ ssh-copy-id -i ~/.ssh/id_rsa.pub um2
/bin/ssh-copy-id: INFO: Source of key(s) to be installed: "/home/mcsadm/.ssh/id_rsa.pub"
The authenticity of host 'um2 (192.168.56.105)' can't be established.
ECDSA key fingerprint is SHA256:Jle/edRpKz9ysV8xp1K9TlIGvbg8Sb1p+GbDob3Id0g.
ECDSA key fingerprint is MD5:a1:ce:9d:58:80:c6:ed:5a:95:7b:33:82:68:cb:0f:40.
Are you sure you want to continue connecting (yes/no)? yes
/bin/ssh-copy-id: INFO: attempting to log in with the new key(s), to filter out any that are already installed
/bin/ssh-copy-id: INFO: 1 key(s) remain to be installed -- if you are prompted now it is to install the new keys
mcsadm@um2's password:
Permission denied, please try again.
mcsadm@um2's password:

Number of key(s) added: 1

Now try logging into the machine, with:   "ssh 'um2'"
and check to make sure that only the key(s) you wanted were added.

[mcsadm@um2 ~]$ ssh-copy-id -i ~/.ssh/id_rsa.pub um1
/bin/ssh-copy-id: INFO: Source of key(s) to be installed: "/home/mcsadm/.ssh/id_rsa.pub"
The authenticity of host 'um1 (192.168.56.104)' can't be established.
ECDSA key fingerprint is SHA256:Jle/edRpKz9ysV8xp1K9TlIGvbg8Sb1p+GbDob3Id0g.
ECDSA key fingerprint is MD5:a1:ce:9d:58:80:c6:ed:5a:95:7b:33:82:68:cb:0f:40.
Are you sure you want to continue connecting (yes/no)? yes
/bin/ssh-copy-id: INFO: attempting to log in with the new key(s), to filter out any that are already installed
/bin/ssh-copy-id: INFO: 1 key(s) remain to be installed -- if you are prompted now it is to install the new keys
mcsadm@um1's password:

Number of key(s) added: 1

Now try logging into the machine, with:   "ssh 'um1'"
and check to make sure that only the key(s) you wanted were added.

Install Dependencies and Configurations

Using user root, install all the required packages, set  umask, sudo privileges and ulimit for mcsadm user. All these are required by ColumnStore on all the nodes.

[root@pm1 local] yum -y install boost expect perl perl-DBI openssl zlib file sudo  libaio rsync snappy net-tools perl-DBD-MySQL
[root@pm1 local] echo "umask 022" >> /etc/profile
[root@pm1 local] echo "mcsadm ALL=(ALL)       NOPASSWD: ALL" >> /etc/sudoers
[root@pm1 local] echo "@mcsadm hard nofile 65536" >> /etc/security/limits.conf
[root@pm1 local] echo "@mcsadm soft nofile 65536" >> /etc/security/limits.conf

Cluster test

Once the dependencies have been set up along with ssh key exchange, execute the Columnstore cluster tester tool from PM1 node using mcsadm user.

[mcsadm@pm1 ~]$ ./mariadb/columnstore/bin/columnstoreClusterTester.sh

*** This is the MariaDB Columnstore Cluster System Test Tool ***

** Validate local OS is supported

Local Node OS System Name : CentOS Linux 7 (Core)

** Run Non-root User directory permissions check on Local Node

Local Node permission test on /tmp : Passed
Local Node permission test on /dev/shm : Passed

** Run MariaDB Console Password check

Passed, no problems detected with a MariaDB password being set without an associated /root/.my.cnf

** Run MariaDB ColumnStore Dependent Package Check

Local Node - Passed, all dependency packages are installed
Failed, Local Node package mariadb-libs is installed, please un-install

Failure occurred, do you want to continue? (y,n) > y


*** Finished Validation of the Cluster, Failures occurred. Check for Error/Failed test results ***

[mcsadm@pm1 ~]$ rpm -qa | grep mariadb
mariadb-libs-5.5.56-2.el7.x86_64
[mcsadm@pm1 ~]$

The above shows a failed cluster test as the default MariaDB libraries that are provided within the Linux distribution are already installed, we need to uninstall these for a clean ColumnStore Installation.

Remove the MariaDB 5.5 libraries and execute the cluster test one more time.

[mcsadm@pm1 ~]$ sudo rpm -e --nodeps mariadb-libs-5.5.56-2.el7.x86_64
[mcsadm@pm1 ~]$ ./mariadb/columnstore/bin/columnstoreClusterTester.sh

*** This is the MariaDB Columnstore Cluster System Test Tool ***

** Validate local OS is supported

Local Node OS System Name : CentOS Linux 7 (Core)

** Run Non-root User directory permissions check on Local Node

Local Node permission test on /tmp : Passed
Local Node permission test on /dev/shm : Passed

** Run MariaDB Console Password check

Passed, no problems detected with a MariaDB password being set without an associated /root/.my.cnf

** Run MariaDB ColumnStore Dependent Package Check

Local Node - Passed, all dependency packages are installed
Local Node - Passed, all packages that should not be installed aren't installed


*** Finished Validation of the Cluster, all Tests Passed ***

[mcsadm@pm1 ~]$

All the tests are cleared, now its time to configure ColumnStore for a 2 UM and 3 PM nodes.

Post Install

Once the cluster test tool is successful, execute post-install and follow the instruction for a distributed install, the user inputs are as follows:

  • Select the type of Data Storage [1=internal, 2=external] () > 1
    • Internal means local disk
  • Enter number of User Modules [1,1024] () > 2

    • Since we are doing a 2UM Nodes setup

  • Enter Nic Interface #1 Host Name () > um1

    • Enter "um1" here based on the /etc/hosts file setup

  • Enter Nic Interface #1 IP Address of um1 (192.168.56.104) >

    • Just press enter to accept the IP already identified by the setup

  • Enter Nic Interface #2 Host Name (unassigned) >

    • Press Enter without any value here as we are only configuring 1 network interface per node

  • The above 3 will repeat depending on the number of UM nodes specified

  • Enter number of Performance Modules [1,1024] () > 3

    • Since we are doing a 3 PM nodes

  • Enter Nic Interface #1 Host Name () > pm1

    • Enter "pm1" here based on the /etc/hosts setup

  • Enter Nic Interface #1 IP Address of pm1 (192.168.56.106) >

    • Just press enter to accept the IP already identified by the setup

  • Enter Nic Interface #2 Host Name (unassigned) >

    • Press Enter without any value here as we are only configuring 1 network interface per node

  • The above three will be repeated depending on the number of PM nodes specified

[mcsadm@pm1 ~]$ ./mariadb/columnstore/bin/post-install --installdir=$HOME/mariadb/columnstore
The next steps are:

If installing on a pm1 node:

export COLUMNSTORE_INSTALL_DIR=/home/mcsadm/mariadb/columnstore
export LD_LIBRARY_PATH=/home/mcsadm/mariadb/columnstore/lib:/home/mcsadm/mariadb/columnstore/mysql/lib/mysql:/home/mcsadm/mariadb/columnstore/lib:/home/mcsadm/mariadb/columnstore/mysql/lib:/home/mcsadm/mariadb/columnstore/lib:/home/mcsadm/mariadb/columnstore/mysql/lib:/home/mcsadm/mariadb/columnstore/lib:/home/mcsadm/mariadb/columnstore/mysql/lib
/home/mcsadm/mariadb/columnstore/bin/postConfigure -i /home/mcsadm/mariadb/columnstore

If installing on a non-pm1 using the non-distributed option:

export COLUMNSTORE_INSTALL_DIR=/home/mcsadm/mariadb/columnstore
export LD_LIBRARY_PATH=/home/mcsadm/mariadb/columnstore/lib:/home/mcsadm/mariadb/columnstore/mysql/lib/mysql:/home/mcsadm/mariadb/columnstore/lib:/home/mcsadm/mariadb/columnstore/mysql/lib:/home/mcsadm/mariadb/columnstore/lib:/home/mcsadm/mariadb/columnstore/mysql/lib:/home/mcsadm/mariadb/columnstore/lib:/home/mcsadm/mariadb/columnstore/mysql/lib
/home/mcsadm/mariadb/columnstore/bin/columnstore start

Copy the above export scripts in the ~/.bashrc script for PM1 node install Make sure the tar.gz file is under /home/mcsadm/ home folder before executing postConfigure.

[mcsadm@pm1 ~]$ /home/mcsadm/mariadb/bin/postConfigure -i /home/mcsadm/mariadb/columnstore

This is the MariaDB ColumnStore System Configuration and Installation tool.
It will Configure the MariaDB ColumnStore System and will perform a Package
Installation of all of the Servers within the System that is being configured.

IMPORTANT: This tool should only be run on the Parent OAM Module
           which is a Performance Module, preferred Module #1

Prompting instructions:

        Press 'enter' to accept a value in (), if available or
        Enter one of the options within [], if available, or
        Enter a new value


===== Setup System Server Type Configuration =====

There are 2 options when configuring the System Server Type: single and multi

  'single'  - Single-Server install is used when there will only be 1 server configured
              on the system. It can also be used for production systems, if the plan is
              to stay single-server.

  'multi'   - Multi-Server install is used when you want to configure multiple servers now or
              in the future. With Multi-Server install, you can still configure just 1 server
              now and add on addition servers/modules in the future.

Select the type of System Server install [1=single, 2=multi] (2) > 2


===== Setup System Module Type Configuration =====

There are 2 options when configuring the System Module Type: separate and combined

  'separate' - User and Performance functionality on separate servers.

  'combined' - User and Performance functionality on the same server

Select the type of System Module Install [1=separate, 2=combined] (1) > 1

Seperate Server Installation will be performed.

NOTE: Local Query Feature allows the ability to query data from a single Performance
      Module. Check MariaDB ColumnStore Admin Guide for additional information.

Enable Local Query feature? [y,n] (n) > n

NOTE: The MariaDB ColumnStore Schema Sync feature will replicate all of the
      schemas and InnoDB tables across the User Module nodes. This feature can be enabled
      or disabled, for example, if you wish to configure your own replication post installation.

MariaDB ColumnStore Schema Sync feature is Enabled, do you want to leave enabled? [y,n] (y) > y


NOTE: MariaDB ColumnStore Replication Feature is enabled

Enter System Name (columnstore-1) >


===== Setup Storage Configuration =====


----- Setup Performance Module DBRoot Data Storage Mount Configuration -----

There are 2 options when configuring the storage: internal or external

  'internal' -    This is specified when a local disk is used for the DBRoot storage.
                  High Availability Server Failover is not Supported in this mode

  'external' -    This is specified when the DBRoot directories are mounted.
                  High Availability Server Failover is Supported in this mode.

Select the type of Data Storage [1=internal, 2=external] (1) > 1

===== Setup Memory Configuration =====

NOTE: Setting 'NumBlocksPct' to 70%
      Setting 'TotalUmMemory' to 50%

===== Setup the Module Configuration =====


----- User Module Configuration -----

Enter number of User Modules [1,1024] (2) > 2

*** User Module #1 Configuration ***

Enter Nic Interface #1 Host Name (um1) > um1
Enter Nic Interface #1 IP Address of um1 (192.168.56.104) >
Enter Nic Interface #2 Host Name (unassigned) >

*** User Module #2 Configuration ***

Enter Nic Interface #1 Host Name (um2) > um2
Enter Nic Interface #1 IP Address of um2 (192.168.56.105) >
Enter Nic Interface #2 Host Name (unassigned) >

----- Performance Module Configuration -----

Enter number of Performance Modules [1,1024] (3) > 3

*** Parent OAM Module Performance Module #1 Configuration ***

Enter Nic Interface #1 Host Name (pm1) > pm1
Enter Nic Interface #1 IP Address of pm1 (192.168.56.106) >
Enter Nic Interface #2 Host Name (unassigned) >
Enter the list (Nx,Ny,Nz) or range (Nx-Nz) of DBRoot IDs assigned to module 'pm1' (1) > 1

*** Performance Module #2 Configuration ***

Enter Nic Interface #1 Host Name (pm2) > pm2
Enter Nic Interface #1 IP Address of pm2 (192.168.56.107) >
Enter Nic Interface #2 Host Name (unassigned) >
Enter the list (Nx,Ny,Nz) or range (Nx-Nz) of DBRoot IDs assigned to module 'pm2' (2) > 2

*** Performance Module #3 Configuration ***

Enter Nic Interface #1 Host Name (pm3) > pm3
Enter Nic Interface #1 IP Address of pm3 (192.168.56.108) >
Enter Nic Interface #2 Host Name (unassigned) >
Enter the list (Nx,Ny,Nz) or range (Nx-Nz) of DBRoot IDs assigned to module 'pm3' (3) > 3

===== System Installation =====

System Configuration is complete.
Performing System Installation.

Performing a MariaDB ColumnStore System install using a Binary package
located in the /home/mcsadm directory.


Next step is to enter the password to access the other Servers.
This is either your password or you can default to using a ssh key
If using a password, the password needs to be the same on all Servers.

Enter password, hit 'enter' to default to using a ssh key, or 'exit' >


----- Performing Install on 'um1 / um1' -----

Install log file is located here: /tmp/um1_binary_install.log


----- Performing Install on 'um2 / um2' -----

Install log file is located here: /tmp/um2_binary_install.log


----- Performing Install on 'pm2 / pm2' -----

Install log file is located here: /tmp/pm2_binary_install.log


----- Performing Install on 'pm3 / pm3' -----

Install log file is located here: /tmp/pm3_binary_install.log


MariaDB ColumnStore Package being installed, please wait ...  DONE

===== Checking MariaDB ColumnStore System Logging Functionality =====

The MariaDB ColumnStore system logging is setup and working on local server

===== MariaDB ColumnStore System Startup =====

System Configuration is complete.
Performing System Installation.

----- Starting MariaDB ColumnStore on local server -----

MariaDB ColumnStore successfully started

MariaDB ColumnStore Database Platform Starting, please wait ...................... DONE

Run MariaDB ColumnStore Replication Setup..  DONE

MariaDB ColumnStore Install Successfully Completed, System is Active

Enter the following command to define MariaDB ColumnStore Alias Commands

. /home/mcsadm/mariadb/columnstore/bin/columnstoreAlias

Enter 'mcsmysql' to access the MariaDB ColumnStore SQL console
Enter 'mcsadmin' to access the MariaDB ColumnStore Admin console

NOTE: The MariaDB ColumnStore Alias Commands are in /etc/profile.d/columnstoreAlias.sh

[mcsadm@pm1 ~]$

The above indicates a successful installation of MariaDB AX and ColumnStore.

In case of any errors, the log files for all the nodes are located under PM 1's /tmp folder with node-specific file names.

Test ColumnStore by using mcsmysql from UM1 node

[mcsadm@um1 ~]$ mcsmysql
Welcome to the MariaDB monitor.  Commands end with ; or \g.
Your MariaDB connection id is 40
Server version: 10.2.15-MariaDB-log Columnstore 1.1.5-1

Copyright (c) 2000, 2018, Oracle, MariaDB Corporation Ab and others.

Type 'help;' or '\h' for help. Type '\c' to clear the current input statement.

MariaDB [(none)]> show databases;
+---------------------+
| Database            |
+---------------------+
| calpontsys          |
| columnstore_info    |
| infinidb_querystats |
| infinidb_vtable     |
| information_schema  |
| mysql               |
| performance_schema  |
| test                |
+---------------------+
8 rows in set (0.00 sec)

MariaDB [(none)]> create database testdb;
Query OK, 1 row affected (0.00 sec)

MariaDB [(none)]> use testdb;
Database changed
MariaDB [testdb]> show tables;
Empty set (0.00 sec)

MariaDB [testdb]> create table tab(id int, name varchar(100));
Query OK, 0 rows affected (0.01 sec)

MariaDB [testdb]> show create table tab\G
*************************** 1. row ***************************
       Table: tab
Create Table: CREATE TABLE `tab` (
  `id` int(11) DEFAULT NULL,
  `name` varchar(100) DEFAULT NULL
) ENGINE=InnoDB DEFAULT CHARSET=latin1
1 row in set (0.00 sec)

MariaDB [testdb]> create table tab_cs(id int, name varchar(100)) engine=columnstore;
Query OK, 0 rows affected (0.39 sec)

MariaDB [testdb]> show create table tab_cs\G
*************************** 1. row ***************************
       Table: tab_cs
Create Table: CREATE TABLE `tab_cs` (
  `id` int(11) DEFAULT NULL,
  `name` varchar(100) DEFAULT NULL
) ENGINE=Columnstore DEFAULT CHARSET=latin1
1 row in set (0.00 sec)

MariaDB [testdb]> insert into tab_cs select rand()*10000, column_name from information_schema.columns;
Query OK, 1921 rows affected (1.70 sec)
Records: 1921  Duplicates: 0  Warnings: 0

MariaDB [testdb]> select count(*) from tab_cs;
+----------+
| count(*) |
+----------+
|     1921 |
+----------+
1 row in set (0.08 sec)

MariaDB [testdb]>

This concludes a successful MariaDB AX distributed tarball install.

Conclusion

MariaDB ColumnStore is a powerful distributed analytical storage engine available as part of MariaDB AX along with MariaDB MaxScale. Installation using a tarball is quite an easy task.

Summary:

  • Create a new user/group mcsadm
  • Download and untar the tarball tar.gz file under /home/mcsadm 
  • Perform SSH Key Exchange between PM1 and all nodes
  • Perform SSH Key Exchange between UM1 and UM2 and vice versa
  • Perform a Cluster Test to ensure no problems
  • Execute Post Install
  • Execute Post Configure

References

This blog is about setting up a MariaDB AX Cluster with 2 UM and 3 PM nodes on a CentOS 7 Cluster. We will be using a tarball binary image non-root installation.

Login or Register to post comments


Saving With MyRocks in The Cloud

$
0
0

The main focus of a previous blog post was the performance of MyRocks when using fast SSD devices. However, I figured that MyRocks would be beneficial for use in cloud workloads, where storage is either slow or expensive.

In that earlier post, we demonstrated the benefits of MyRocks, especially for heavy IO workloads. Meanwhile, Mark wrote in his blog that the CPU overhead in MyRocks might be significant for CPU-bound workloads, but this should not be the issue for IO-bound workloads.

In the cloud the cost of resources is a major consideration. Let’s review the annual cost for the processing and storage resources.

 Resource cost/year, $   IO cost $/year   Total $/year 
c5.9xlarge  7881    7881
1TB io1 5000 IOPS  1500  3900    5400
1TB io1 10000 IOPS  1500  7800    9300
1TB io1 15000 IOPS  1500  11700  13200
1TB io1 20000 IOPS  1500  15600  17100
1TB io1 30000 IOPS  1500  23400  24900
3.4TB GP2 (10000 IOPS)  4800    4800


The scenario

The server version is Percona Server 5.7.22

For instances, I used c5.9xlarge instances. The reason for c5 was that it provides high performance Nitro virtualization: Brendan Gregg describes this in his blog post. The rationale for 9xlarge instances was to be able to utilize io1 volumes with a 30000 IOPS throughput – smaller instances will cap io1 throughput at a lower level.

I also used huge gp2 volumes: 3400GB, as this volume provides guaranteed 10000 IOPS even if we do not use io1 volumes. This is a cheaper alternative to io1 volumes to achieve 10000 IOPS.

For the workload I used sysbench-tpcc 5000W (50 tables * 100W), which for InnoDB gave about 471GB in storage used space.

For the cache I used 27GB and 54G buffer size, so the workload is IO-heavy.

I wanted to compare how InnoDB and RocksDB performed under this scenario.

If you are curious I prepared my terraform+ansible deployment files here: https://github.com/vadimtk/terraform-ansible-percona

Before jumping to the results, I should note that for MyRocks I used LZ4 compression for all levels, which in its final size is 91GB. That is five times less than InnoDB size. This alone provides operational benefits—for example to copy InnoDB files (471GB) from a backup volume takes longer than 1 hour, while it is much faster (five times) for MyRocks.

The benchmark results

So let’s review the results.

InnoDB versus MyRocks throughput in the cloud

Or presenting average throughput in a tabular form:

cachesize IOPS engine avg TPS
27 5000 innodb 132.66
27 5000 rocksdb 481.03
27 10000 innodb 285.93
27 10000 rocksdb 1224.14
27 10000gp2 innodb 227.19
27 10000gp2 rocksdb 1268.89
27 15000 innodb 436.04
27 15000 rocksdb 1839.66
27 20000 innodb 584.69
27 20000 rocksdb 2336.94
27 30000 innodb 753.86
27 30000 rocksdb 2508.97
54 5000 innodb 197.51
54 5000 rocksdb 667.63
54 10000 innodb 433.99
54 10000 rocksdb 1600.01
54 10000gp2 innodb 326.12
54 10000gp2 rocksdb 1559.98
54 15000 innodb 661.34
54 15000 rocksdb 2176.83
54 20000 innodb 888.74
54 20000 rocksdb 2506.22
54 30000 innodb 1097.31
54 30000 rocksdb 2690.91


We can see that MyRocks outperformed InnoDB in every single combination, but it is also important to note the following:

MyRocks on io1 5000 IOPS showed the performance that InnoDB showed in io1 15000 IOPS.

That means that InnoDB requires three times more in storage throughput. If we take a look at the storage cost, it corresponds to three times more expensive storage. Given that MyRocks requires less storage, it is possible to save even more on storage capacity.

On the most economical storage (3400GB gp2, which will provide 10000 IOPS) MyRocks showed 4.7 times better throughput.

For the 30000 IOPS storage, MyRocks was still better by 2.45 times.

However it is worth noting that MyRocks showed a greater variance in throughput during the runs. Let’s review the charts with 1 sec resolution for GP2 and io1 30000 IOPS storage:Throughput 1 sec resolution for GP2 and io1 30000 IOPS storage MyROCKS versus InnoDB

Such variance might be problematic for workloads that require stable throughput and where periodical slowdowns are unacceptable.

Conclusion

MyRocks is suitable and beneficial not only for fast SSD, but also for cloud deployments. By requiring less IOPS, MyRocks can provide better performance and save on the storage costs.

However, before evaluating MyRocks, make sure that your workload is IO-bound i.e. the working set is much bigger than available memory. For CPU-intensive workloads (where the working set fits into memory), MyRocks will be less beneficial or even perform worse than InnoDB (as described in the blog post A Look at MyRocks Performance)


The post Saving With MyRocks in The Cloud appeared first on Percona Database Performance Blog.

Mastering Continuent Clustering Series: Converting a standalone cluster to a Composite Primary/DR topology using INI configuration

$
0
0

In this blog post, we demonstrate how to convert a single standalone cluster into a Composite Primary/DR topology running in two data centers.

Our example starting cluster has 5 nodes (1 master and 4 slaves) and uses service name alpha. Our target cluster will have 6 nodes (3 per cluster) in 2 member clusters alpha_east and alpha_west in composite service alpha.

This means that we will reuse the existing service name alpha as the name of the new composite service, and create two new service names, one for each cluster (alpha_east and alpha_west).

Below is an INI file extract example for our starting standalone cluster with 5 nodes:

[defaults]
...

[alpha]
connectors=db1,db2,db3,db4,db5
master=db1
members=db1,db2,db3,db4,db5
topology=clustered

To convert the above configuration to a Composite Primary/DR:

  1. First you must stop all services on all existing nodes:
    shell> stopall
    
  2. Update tungsten.ini on all nodes.
    Create the two new services and put the correct information into all three stanzas.
    For example, below is an INI file extract example for our target composite cluster with 6 nodes:
    [defaults]
    start-and-report=false
    start=false
    ...
    
    [alpha_east]
    connectors=db1,db2,db3
    master=db1
    members=db1,db2,db3
    topology=clustered
    
    [alpha_west]
    connectors=db4,db6
    master=db4
    members=db4,db5,db6
    topology=clustered
    relay-source=alpha_east
    
    [alpha]
    composite-datasources=alpha_east,alpha_west
    
  3. Invoke the conversion using the tpm command from the software extraction directory:
    shell> tpm query staging
    shell> cd {software_staging_dir_from_tpm_query}
    shell> ./tools/tpm update --replace-release
    shell> rm /opt/cont/tung/cluster-home/conf/cluster/*/datasource/*
    
  4. Finally, start all services on all existing nodes.
    shell> startall
    

In future articles, we will continue to cover more advanced subjects of interest!

Questions? Contact Continuent

Lock elision, pthreads and MySQL

$
0
0
Yesterday I learned that lock elision is supported in recent versions of glibc for pthread mutex and rw-lock. I am curious if anyone has results for MySQL with it. My memory is that InnoDB can suffer from contention on a rw-lock, but that is a custom rw-lock not the one included with glibc. But code above the storage engine uses mutex and maybe rw-lock from glibc.

A rw-lock where reads dominate can suffer from contention because it has at least twice the memory writes per lock/unlock pair compared to a mutex. So when the lock hold time is short a mutex wins even when exclusive access isn't required. This can often be seen in PMP output where there are convoys and the worst-case is when a thread gets stuck trying to get the internal latch during unlock, but the InnoDB custom rw-lock might not have that problem. Lock elision for the rw-lock might be a big deal in this case.

RocksDB might also benefit from this change.

One of the challenges with glibc pthreads is documentation. I previously wrote about the difficulty of finding documentation for PTHREAD_MUTEX_ADAPTIVE_NP. The problem continues. There isn't much about pthreads in a recent version of the glibc manual. From Google searches I wasn't able to find recent docs elsewhere, except for man pages. But man pages don't document PTHREAD_MUTEX_ADAPTIVE_NP.  With lock elision we get new options -- PTHREAD_MUTEX_ELISION_NP and PTHREAD_MUTEX_NO_ELISION_MP. Google searches will take you to bits of source code and email list discussions. I hope this can be improved. Given the lack of docs you might need to read the source. I hope that the community (web-scale companies) can sponsor a tech writer to provide the missing docs.

There has been drama because the introduction of this feature failed when it encountered buggy microcode on certain CPUs. Then there was more drama when it broke buggy software that worked despite the bugs, until lock elision made the bugs serious. Google searches find many of the stories.

One of my favorite perks at work is getting answers from experts. In this case the expert is Nathan Bronson (thank you). A summary of the glibc 2.23 implementation per the expert is:
  • NPTL lock elision is performed using TSX's RTM (Restricted Transactional Memory) instructions XBEGIN, XEND, and XABORT, rather than TSX's HLE (Hardware Lock Elision) instructions XACQUIRE and XRELEASE
  • On x86, elision support is always present when detected by HAS_CPU_FEATURE(RTM)
  • pthread_rwlock_t always attempts elision if the hardware has it (both for .._rdlock and .._wrlock)
  • pthread_rwlock_t uses an adaptive strategy for falling back to the non-TSX implementation. If the lock is held in a non-TSX mode, there is a transaction conflict, or the transaction exceeds TSX's (undocumented) capacity, then the current lock acquisition and the 3 following use the non-TXN code path. This means that once a lock falls off the elision path it needs several uncontended acquisitions before a transaction it will be attempted again. This seems quite conservative
  • pthread_rwlock_rdlock -> pthread_rwlock_unlock with a successful transaction is about twice as fast as the non-TSX implementation under no contention, and massively better under contention

A Nice Introduction to MySQL Window Functions III

$
0
0
Windowing Functions can get quite complex very quickly when you start taking advantage of the frame clause. Ranges and rows can get confusing.  So for review lets look at how the specification looks:

Window_spec:
   [window name] [partition clause] [order clause] [frame clause]

That looks simple. And them come terms like UNBOUNDED PRECEDING that could put a knot in your gut.  The manual is not exactly written to help novices in this area get up to speed.  But don't panic.  If you work through the examples that follow (and please do the preceding part of this series before trying these examples) you will have a better appreciation of what is going on with window function.

The Frame Clause


So the frame clause is optional in the window function.  A frame is considered a subset of the current partition and defines that subset.  Frames are determined with respect to the current row. This allows grouping of data within a partition depending on the current row in the partition.  If the frame is defined as all rows  from the start of the end of the partition you can computer running totals for each row.  Or the frame can be defined as extending a desired number of rows  either side of the current row which lets you compute rolling averages.

The first example in this series had the window defined as W OVER() which does not have a frame clause and computes over the entire column.

mysql> select x, 
              sum(x) over() from x;
+------+---------------+
| x    | sum(x) over() |
+------+---------------+
|    1 |            55 |
|    2 |            55 |
|    3 |            55 |
|    4 |            55 |
|    5 |            55 |
|    6 |            55 |
|    7 |            55 |
|    8 |            55 |
|    9 |            55 |
|   10 |            55 |
+------+---------------+
10 rows in set (0.00 sec)

Unbounded

There is usually more than one way to do things. OVER() can also be written as WINDOW w AS (ROWS BETWEEN UNBOUNDED PRECEDING AND UNBOUNDED FOLLOWING) or WINDOW w AS (RANGE BETWEEN UNBOUNDED PRECEDING AND UNBOUNDED FOLLOWING).

Uh, wha, huh?

Besides the confusion of windows/frames and range/rows, the wording gets tricky.   UNBOUNDED should be taken to mean as 'everything' so UNBOUNDED BEFORE means everything before and UNBOUNDED AFTER means everything after.


mysql> SELECT x, 
             sum(x) over() as 'over', 
             sum(x) OVER a as 'row',
             sum(x) OVER b AS 'range' 
             FROM x 
             window 
a AS (rows between unbounded preceding and unbounded following),    b AS (range between unbounded preceding and unbounded following);
+------+------+------+-------+
| x    | over | row  | range |
+------+------+------+-------+
|    1 |   55 |   55 |    55 |
|    2 |   55 |   55 |    55 |
|    3 |   55 |   55 |    55 |
|    4 |   55 |   55 |    55 |
|    5 |   55 |   55 |    55 |
|    6 |   55 |   55 |    55 |
|    7 |   55 |   55 |    55 |
|    8 |   55 |   55 |    55 |
|    9 |   55 |   55 |    55 |
|   10 |   55 |   55 |    55 |
+------+------+------+-------+
10 rows in set (0.01 sec)

So in the above example the windows are framed so that all the rows are used for the summation of the column when using rows and range.

ROW vs RANGE

Right now you are probably wondering what the difference is between RANGE and ROW.  Let's modify the last example slightly. So we replace between current row and unbounded following as the core of the frame specification.

mysql> SELECT x, 
         sum(x) over() as 'over', 
         sum(x) OVER a as 'row', 
         sum(x) OVER b AS 'range' 
         FROM x 
  window a AS (rows between current row and unbounded following), 
         b AS (range between current row and unbounded following);
+------+------+------+-------+
| x    | over | row  | range |
+------+------+------+-------+
|    1 |   55 |   55 |    55 |
|    2 |   55 |   54 |    55 |
|    3 |   55 |   52 |    55 |
|    4 |   55 |   49 |    55 |
|    5 |   55 |   45 |    55 |
|    6 |   55 |   40 |    55 |
|    7 |   55 |   34 |    55 |
|    8 |   55 |   27 |    55 |
|    9 |   55 |   19 |    55 |
|   10 |   55 |   10 |    55 |
+------+------+------+-------+
10 rows in set (0.00 sec)

The row column now counts down while the range column is unchanged.  What happened? So rows have a frame defined by the beginning and ending row position.  The first row has a sum of all ten items in the column. But the second row has a sum starting with the value of 2 and ending at 10, the third row sums 3 to 10, etcetera.

For range, the frame is defined by rows within a value range of an ORDER BY clause.  But where is the ORDER BY??  Well in this case it is implied to be the entire partition so it takes all the column values.

Range gets a little more differentiated when you use it a little more creatively.

mysql> SELECT x,
             sum(x) over() as 'over', 
             sum(x) OVER a as 'row', 
             sum(x) OVER b AS 'range' 
             FROM x 
             window 
               a AS (rows between current row and 1 following), 
               b AS (order by x 
                     range between current row and 1 following);
+------+------+------+-------+
| x    | over | row  | range |
+------+------+------+-------+
|    1 |   55 |    3 |     3 |
|    2 |   55 |    5 |     5 |
|    3 |   55 |    7 |     7 |
|    4 |   55 |    9 |     9 |
|    5 |   55 |   11 |    11 |
|    6 |   55 |   13 |    13 |
|    7 |   55 |   15 |    15 |
|    8 |   55 |   17 |    17 |
|    9 |   55 |   19 |    19 |
|   10 |   55 |   10 |    10 |
+------+------+------+-------+
10 rows in set (0.06 sec)

The above will sum the current row and the next row.  With row the frame becomes rows between current row and 1 following.  But this time for range the order has to be specified and the frame becomes  order by x range between current row and 1 following. 

It is possible to specify bigger ranges.  

mysql> SELECT x, 
          sum(x) over() as 'over', 
           sum(x) OVER a as 'row', 
           sum(x) OVER b AS 'range' 
          FROM x 
      window a AS (rows between 1 preceding and 3 following), 
        b AS (order by x range between 1 preceding and 3 following);
+------+------+------+-------+
| x    | over | row  | range |
+------+------+------+-------+
|    1 |   55 |   10 |    10 |
|    2 |   55 |   15 |    15 |
|    3 |   55 |   20 |    20 |
|    4 |   55 |   25 |    25 |
|    5 |   55 |   30 |    30 |
|    6 |   55 |   35 |    35 |
|    7 |   55 |   40 |    40 |
|    8 |   55 |   34 |    34 |
|    9 |   55 |   27 |    27 |
|   10 |   55 |   19 |    19 |
+------+------+------+-------+
10 rows in set (0.00 sec)


Hopefully this takes a little bit of the mystery out of windowing functions for novices.

Next time I hope to look into some time series data and windowing functions.

Configuring the MySQL Shell Prompt

$
0
0

With the introduction of MySQL Shell 8.0, the second major version of the new command-line tool for MySQL, a new and rich featured prompt was introduced. Unlike the prompt of the traditional mysql command-line client, it does not just say mysql> by default. Instead it comes in a colour coded spectacle.

The default prompt is great, but for one reason or another it may be that you want to change the prompt. Before getting to that, let’s take a look at the default prompt, so the starting point is clear.

The Default Prompt

An example of the default prompt can be seen in the screen shot below. As you can see, there are several parts to the prompt, each carrying its information.

MySQL Shell with the default font.

MySQL Shell with the default font.

There are six parts. From left to right, they are:

  • Status: Whether it is a production system or whether the connection is lost. This part is not included in the above screen shot.
  • MySQL: Just a reminder that you are working with a MySQL database.
  • Connection: Which host you are connected to (localhost), which port (33060 – to the X protocol port), and that SSL is being used.
  • Schema: The current default schema.
  • Mode: Whether you are using JavaScript (JS), Python (Py), or SQL (SQL) to enter commands.
  • End: As per tradition, the prompt ends with a >.

Depending on your current status one or more of the parts may be missing. For example, the configuration options will only be present, when you have an active connection to a MySQL Server instance.

The prompt works well on a black background and thus brightly coloured text as in the screen shot, but for some other background and text colours, it is not so – or you may simply want different colours to signify which whether you are connected to a development or production system. You may also find the prompt too verbose, if you are recording a video or writing training material. So, let’s move on and find out how the prompt is configured.

The Prompt Configuration

Since the prompt is not just a simple string, it is also somewhat more complex to configure it than just setting an option. The configuration is done in a JSON object stored in a file named prompt.json (by default – you can change this – more about that later).

The location of prompt.json depends on your operating system:

  • Linux and macOS: ~/.mysqlsh/prompt.json – that is in the .mysqlsh directory in the user’s home directory.
  • Microsoft Windows: %AppData%\MySQL\mysqlsh\prompt.json – that is in AppData\Roaming\MySQL\mysqlsh directory from the user’s home directory.

If the file does not exist, MySQL Shell falls back on a system default. For example, on Oracle Linux 7 installation, the file /usr/share/mysqlsh/prompt/prompt_256.json is used. This is also the template that is copied to %AppData%\MySQL\mysqlsh\prompt.json on Microsoft Windows 10 installation.

The MySQL Shell installation includes several templates that you can choose from. These are:

  • json: A coloured prompt limited to use 16/8 color ANSI colours and attributes.
  • json: The prompt uses 256 indexed colours. This is the one that are used by default both on Oracle Linux 7 and Microsoft Windows 10.
  • json: Similar to prompt_256.json, but with an “invisible” background colour (it just uses the same as for the terminal) and with different foreground colours.
  • json: Same as prompt_256.json but with extra. This Powerline patched font such as the one that is installed with the Powerline project. This will add a padlock with the prompt when you use SSL to connect to MySQL and use “arrow” separators.
  • prompt_256pl+aw.json: Same as prompt_256pl.json but with “awesome symbols”. This additionally requires the awesome symbols to be included in the Powerline font.
  • json: This is a very basic prompt that just shows mysql-js>, mysql-py>, or mysql-sql> based on the mode in use.
  • json: Gives the full prompt information, but completely without colours. An example of a prompt is: MySQL [localhost+ ssl/world] JS>

These are templates that you can use as is or modify to suite yours needs and preferences. One way to pick a theme is to copy the template file into the location of your user’s prompt definition. The templates can be found in the prompt directory of the installation, for example:

  • Oracle Linux 7 RPM: /usr/share/mysqlsh/prompt/
  • Microsoft Windows: C:\Program Files\MySQL\MySQL Shell 8.0\share\mysqlsh\prompt

Another option is to define the MYSQLSH_PROMPT_THEME environment variable to point to the file you want to use. The value should be the full path to the file. This is particularly useful if you want to try the different template to see what works best for you. For example, to use the prompt_256inv.json template from the command prompt on Microsoft Windows:

C:\>set MYSQLSH_PROMPT_THEME=C:\Program Files\MySQL\MySQL Shell 8.0\share\mysqlsh\prompt\prompt_256pl.json

Which gives the prompt:

The prompt when using the prompt_256pl.json template.

The prompt when using the prompt_256pl.json template.

If none of the templates work for you, you can also dive in at the deep end of the pool and create your own configuration.

Creating Your Own Configuration

It is not completely trivial to create your own configuration, but if you use the template that is closest to the configuration you want as a starting point, it is not difficult either.

A good source of help to create the perfect prompt is also the README.prompt file that is located in the same directory as the template files. The README.prompt file contains the specification for the configuration.

Instead of going through the specification in details, let’s take a look at the prompt_256.json template and discuss some parts of it. Let’s start at the end of the file:

"segments": [
	{
	  "classes": ["disconnected%host%", "%is_production%"]
	},
    {
      "text": " My",
      "bg": 254,
      "fg": 23
    },
    {
      "separator": "",
      "text": "SQL ",
      "bg": 254,
      "fg": 166
    },
    {
      "classes": ["disconnected%host%", "%ssl%host%session%"],
      "shrink": "truncate_on_dot",
      "bg": 237,
      "fg": 15,
      "weight": 10,
      "padding" : 1
    },
    {
      "classes": ["noschema%schema%", "schema"],
      "bg": 242,
      "fg": 15,
      "shrink": "ellipsize",
      "weight": -1,
      "padding" : 1
    },
    {
      "classes": ["%Mode%"],
      "text": "%Mode%",
      "padding" : 1
    }
  ]
}

This is where the elements of the prompt is defined. There are a few things that is interesting to note here.

First, notice that there is an object with the classes disconnected%host% and %is_production%. The names inside the %s are variables defined in the same file or that comes from MySQL Shell itself (it has variables such as the host and port). For example, is_production is defined as:

"variables" : {
    "is_production": {
        "match" : {
            "pattern": "*;%host%;*",
            "value": ";%env:PRODUCTION_SERVERS%;"
        },
        "if_true" : "production",
        "if_false" : ""
    },

So, a host is considered to be a production instance if it is included in the environment variable PRODUCTION_SERVERS. When there is a match, and additional element is inserted at the beginning of the prompt to make it clear, you are working on with a production system:

Connected to a production system.

Connected to a production system.

The second thing to note about the list of elements is that there are some special functions such as shrink which can be used to define how the text is kept relatively short. For example, the host uses truncate_on_dot, so only the part before the first dot in the hostname is displayed if the full hostname is too long. Alternatively ellipsize can be used to add … after the truncated value.

Third, the background and foreground colours are defined using the bg and fg elements respectively. This allows you to completely customize the prompt to your liking with respect to colours. The colour can be specified in one of the following ways:

  • By Name: There are a few colours that are known by name: black, red, green, yellow, blue, magenta, cyan, white.
  • By Index: A value between 0 and 255 (both inclusive) where 0 is black, 63 light blue, 127 magenta, 193 yellow, and 255 is white.
  • By RGB: Use a value in the #rrggbb format. Requires the terminal supports TrueColor colours.
Tip: If you want to do more than make a few tweaks to an existing template, read the README.prompt file to see the full specification including a list of supported attributes and built-in variables. These may change in the future as more features are added.

One group of built-in variables that deserve an example are the ones that in some way depend on the environment or the MySQL instance you are connected to. These are:

  • %env:varname%: This uses an environment variable. The way that it is determined whether you are connected to a production server is an example of how an environment variable
  • %sysvar:varname%: This uses the value of a global system variable from MySQL. That is, the value returned by SELECT @@global.varname.
  • %sessvar:varname%: Similar to the previous but using a session system variable.
  • %status:varname%: This uses the value of a global status variable from MySQL. That is, the value returned by SELECT VARIABLE_VALUE FROM performance_schema.global_status WHERE VARIABLE_NAME = ‘varname’.
  • %status:varname%: Similar to the previous, but using a session status variable.

If you for example want to include the MySQL version (of the instance you are connected to) in the prompt, you can add an element like:

{
      "separator": "",
      "text": "%sysvar:version%",
      "bg": 250,
      "fg": 166
    },

The resulting prompt is:

Including the MySQL Server version in the prompt.

Including the MySQL Server version in the prompt.

What next? Now it is your turn to play with MySQL Shell. Enjoy.

Amazon RDS Multi-AZ Deployments and Read Replicas

$
0
0
RDS Multi-AZ

Amazon RDS is a managed relational database service that makes it easier to set up, operate, and scale a relational database in the cloud. One of the common questions that we get is “What is Multi-AZ and how it’s different from Read Replica, do I need both?”.  I have tried to answer this question in this blog post and it depends on your application needs. Are you looking for High Availability (HA), read scalability … or both?

Before we go to into detail, let me explain two common terms used with Amazon AWS.

Region – an AWS region is a separate geographical area like US East (N. Virginia), Asia Pacific (Mumbai), EU (London) etc. Each AWS Region has multiple, isolated locations known as Availability Zones.

Availability Zone (AZ) – AZ is simply one or more data centers, each with redundant power, networking and connectivity, housed in separate facilities. Data centers are geographically isolated within the same region.

What is Multi-AZ?

Amazon RDS provides high availability and failover support for DB instances using Multi-AZ deployments.

In a Multi-AZ deployment, Amazon RDS automatically provisions and maintains a synchronous standby replica of the master DB in a different Availability Zone. The primary DB instance is synchronously replicated across Availability Zones to the standby replica to provide data redundancy, failover support and to minimize latency during system backups. In the event of planned database maintenance, DB instance failure, or an AZ failure of your primary DB instance, Amazon RDS automatically performs a failover to the standby so that database operations can resume quickly without administrative intervention.

You can check in the AWS management console if a database instance is configured as Multi-AZ. Select the RDS service, click on the DB instance and review the details section.

AWS management console showing that instance is Multi-AZ

This screenshot from AWS management console (above) shows that the database is hosted as Multi-AZ deployment and the standby replica is deployed in us-east-1a AZ.

Benefits of Multi-AZ deployment:

  • Replication to a standby replica is synchronous which is highly durable.
  • When a problem is detected on the primary instance, it will automatically failover to the standby in the following conditions:
    • The primary DB instance fails
    • An Availability Zone outage
    • The DB instance server type is changed
    • The operating system of the DB instance is undergoing software patching.
    • A manual failover of the DB instance was initiated using Reboot with failover.
  • The endpoint of the DB instance remains the same after a failover, the application can resume database operations without manual intervention.
  • If a failure occurs, your availability impact is limited to the time that the automatic failover takes to complete. This helps to achieve increased availability.
  • It reduces the impact of maintenance. RDS performs maintenance on the standby first, promotes the standby to primary master, and then performs maintenance on the old master which is now a standby replica.
  • To prevent any negative impact of the backup process on performance, Amazon RDS creates a backup from the standby replica.

Amazon RDS does not failover automatically in response to database operations such as long-running queries, deadlocks or database corruption errors. Also, the Multi-AZ deployments are limited to a single region only, cross-region Multi-AZ is not currently supported.

Can I use an RDS standby replica for read scaling?

The Multi-AZ deployments are not a read scaling solution, you cannot use a standby replica to serve read traffic. Multi-AZ maintains a standby replica for HA/failover. It is available for use only when RDS promotes the standby instance as the primary. To service read-only traffic, you should use a Read Replica instead.

What is Read Replica?

Read replicas allow you to have a read-only copy of your database.

When you create a Read Replica, you first specify an existing DB instance as the source. Then Amazon RDS takes a snapshot of the source instance and creates a read-only instance from the snapshot. You can use MySQL native asynchronous replication to keep Read Replica up-to-date with the changes. The source DB must have automatic backups enabled for setting up read replica.

Benefits of Read Replica

  • Read Replica helps in decreasing load on the primary DB by serving read-only traffic.
  • A Read Replica can be manually promoted as a standalone database instance.
  • You can create Read Replicas within AZ, Cross-AZ or Cross-Region.
  • You can have up to five Read Replicas per master, each with own DNS endpoint. Unlike a Multi-AZ standby replica, you can connect to each Read Replica and use them for read scaling.
  • You can have Read Replicas of Read Replicas.
  • Read Replicas can be Multi-AZ enabled.
  • You can use Read Replicas to take logical backups (mysqldump/mydumper) if you want to store the backups externally to RDS.
  • Read Replica helps to maintain a copy of databases in a different region for disaster recovery.

At AWS re:Invent 2017, AWS announced the preview for Amazon Aurora Multi-Master, this will allow users to create multiple Aurora writer nodes and helps in scaling reads/writes across multiple AZs. You can sign up for preview here.

Conclusion

While both (Multi-AZ and Read replica) maintain a copy of database but they are different in nature. Use Multi-AZ deployments for High Availability and Read Replica for read scalability. You can further set up a cross-region read replica for disaster recovery.

The post Amazon RDS Multi-AZ Deployments and Read Replicas appeared first on Percona Database Performance Blog.

Easy and Effective Way of Building External Dictionaries for ClickHouse with Pentaho Data Integration Tool

$
0
0

pentaho pdt with clickhouseIn this post, I provide an illustration of how to use Pentaho Data Integration (PDI) tool to set up external dictionaries in MySQL to support ClickHouse. Although I use MySQL in this example, you can use any PDI supported source.

ClickHouse

ClickHouse is an open-source column-oriented DBMS (columnar database management system) for online analytical processing. Source: wiki.

Pentaho Data Integration

Information from the Pentaho wiki: Pentaho Data Integration (PDI, also called Kettle) is the component of Pentaho responsible for the Extract, Transform and Load (ETL) processes. Though ETL tools are most frequently used in data warehouses environments, PDI can also be used for other purposes:

  • Migrating data between applications or databases
  • Exporting data from databases to flat files
  • Loading data massively into databases
  • Data cleansing
  • Integrating applications

PDI is easy to use. Every process is created with a graphical tool where you specify what to do without writing code to indicate how to do it; because of this, you could say that PDI is metadata oriented.

External dictionaries

You can add your own dictionaries from various data sources. The data source for a dictionary can be a local text or executable file, an HTTP(s) resource, or another DBMS. For more information, see “Sources for external dictionaries“.

ClickHouse:

  • Fully or partially stores dictionaries in RAM.
  • Periodically updates dictionaries and dynamically loads missing values. In other words, dictionaries can be loaded dynamically.

The configuration of external dictionaries is located in one or more files. The path to the configuration is specified in the dictionaries_config parameter.

Dictionaries can be loaded at server startup or at first use, depending on the dictionaries_lazy_load setting.

Source: dictionaries.

Example of external dictionary

In two words, dictionary is a key(s)-value(s) mapping that could be used for storing some value(s) which will be retrieved using a key. It is a way to build a “star” schema, where dictionaries are dimensions:

example external dictionary

Using dictionaries you can lookup data by key(customer_id in this example). Why do not use tables for simple JOIN? Here is what documentation says:

If you need a JOIN for joining with dimension tables (these are relatively small tables that contain dimension properties, such as names for advertising campaigns), a JOIN might not be very convenient due to the bulky syntax and the fact that the right table is re-accessed for every query. For such cases, there is an “external dictionaries” feature that you should use instead of JOIN. For more information, see the section “External dictionaries”.

Main point of this blog post:

Demonstrating filling a MySQL table using PDI tool and connecting this table to ClickHouse as an external dictionary. You can create a scheduled job for loading or updating this table.

Filling dictionaries during the ETL process is a challenge. Of course you can write a script (or scripts) that will do all of this, but I’ve found a better way. Benefits:

  • Self-documented: you see what exactly PDI job does;
  • Easy to modify(see example below)
  • Built-in logging
  • Very flexible
  • If you use the Community Edition you will not pay anything.

Pentaho Data Integration part

You need a UI for running/developing ETL, but it’s not necessary to use the UI for running a transformation or job. Here’s an example of running it from a Linux shell(read PDI’s docs about jobs/transformation):

${PDI_FOLDER}/kitchen.sh -file=${PATH_TO_PDI_JOB_FILE}.kjb [-param:SOMEPARAM=SOMEVALUE]
${PDI_FOLDER}/pan.sh -file=${PATH_TO_PDI_TRANSFORMATION_FILE}.ktr [-param:SOMEPARAM=SOMEVALUE]

Here is a PDI transformation. In this example I use three tables as a source of information, but you can create very complex logic:

PDI transformation

“Datasource1” definition example

datasource definition example

Dimension lookup/update is a step that updates the MySQL table (in this example, it could be any database supported by PDI output step). It will be the source for ClickHouse’s external dictionary:

dimension lookup update id

Fields definition:dimension fields definition

Once you have done this, you hit the “SQL” button and it will generate the DDL code for D_CUSTOMER table. You can manage the algorithm of storing data in the step above: update or insert new record(with time_start/time_end fields). Also, if you use PDI for ETL, then you can generate a “technical key” for your dimension and store this key in ClickHouse, this is a different story… For this example, I will use “id” as a key in the ClickHouse dictionary.

The last step is setting up external dictionary in ClickHouse’s server config.

The ClickHouse part

External dictionary config, in this example you’ll see that I use MySQL:

<dictionaries>
<dictionary>
    <name>customers</name>
    <source>
      <!-- Source configuration -->
      <mysql>
      <port>3306</port>
      <user>MySQL_User</user>
      <password>MySQL_Pass</password>
      <replica>
          <host>MySQL_host</host>
          <priority>1</priority>
      </replica>
      <db>DB_NAME</db>
      <table>D_CUSTOMER</table>
      </mysql>
    </source>
    <layout>
      <!-- Memory layout configuration -->
	<flat/>
    </layout>
    <structure>
        <id>
		<name>id</name>
	</id>
    <attribute>
        <name>name</name>
                <type>String</type>
                <null_value></null_value>
        </attribute>
    <attribute>
        <name>address</name>
                <type>String</type>
                <null_value></null_value>
    </attribute>
    <!-- Will be uncommented later
    <attribute>
        <name>phone</name>
                <type>String</type>
                <null_value></null_value>
    </attribute>
    -->
   </structure>
    <lifetime>
            <min>3600</min>
            <max>86400</max>
    </lifetime>
</dictionary>
</dictionaries>

Creating the fact table in ClickHouse:

Create table in ClickHouse

Some sample data:

Sample data

Now we can fetch data aggregated against the customer name:

aggregated data with customer name

Dictionary modification

Sometimes, it happens that you need to modify your dimensions. In my example I am going to add phone number to the “customers” dictionary. Not a problem at all. You update your datasource in PDI job:

dictionary modification add new field

Open the “Dimension lookup/update” step and add the phone field:

Add a field

And hit the SQL button.

alter table statement

Also add the “phone” field in ClickHouse’s dictionary config:

   <attribute>
       <name>phone</name>
               <type>String</type>
               <null_value></null_value>
   </attribute>

ClickHouse will update a dictionary on the fly and we are ready to go—if not please check the logs. Now you can run the query without a modification of fact_table:

query without modifying fact

Also, note that PDI job is an XML file that could be put under version source control tools, so it is easy to track or rollback if needed.

Please do not hesitate to ask if you have questions!

The post Easy and Effective Way of Building External Dictionaries for ClickHouse with Pentaho Data Integration Tool appeared first on Percona Community Blog.


Database Objects migration to RDS/ Aurora (AWS)

$
0
0

The world of application and its related services are migrating more towards cloud, because of availability, Elasticity, Manageability etc. While moving the entire stack we need to be very cautious while migrating the database part.

Migration of DB servers is not a simple lift and shift operation, Rather it would require a proper planning and more cautious in maintaining data consistency with existing DB server and cloud server by means of native replication or by using any third party tools.

The best way to migrate the existing MySQL database to RDS, in my opinion, is by using “logical backup“. Some of the logical backup tools as below,

Mysqldump — single threaded (widely used)
Mysqlpump — Multithreaded
Mydumper — Multithreaded

In this blog, we will see about a simple workaround and best practices to migrate DB objects such as procedures, triggers, etc from a existing database server on premises to Amazon RDS (MySQL), which is a fully managed relational database service provided by AWS.

In order to provide managed services, RDS restricts certain privileges at the user level. Below are the list of restricted privileges in RDS.

  • SUPER – Enable use of other administrative operations such as CHANGE MASTER TO, KILL (any connection), PURGE BINARY LOGS, SET GLOBAL, and mysqladmin debug command. Level: Global.
  • SHUTDOWN – Enable use of mysqladmin shutdown. Level: Global.
  • FILE – Enable the user to cause the server to read or write files. Level: Global.
  • CREATE TABLESPACE – Enable tablespaces and log file groups to be created, altered, or dropped. Level: Global.

All stored programs (procedures, functions, triggers, and events) and views can have a DEFINER attribute that names a MySQL account. As shown below.

DELIMITER ;;
CREATE DEFINER=`xxxxx`@`localhost` PROCEDURE `prc_hcsct_try`(IN `contactId` INT, IN `section` VARCHAR(255))
BEGIN
IF NOT EXISTS (SELECT 1 FROM contacts_details WHERE contact_id = contactId) THEN
INSERT INTO contacts_details (contact_id, last_touch_source, last_touch_time) VALUES (contactId, section, NOW());
ELSE
UPDATE contacts_details SET last_touch_source = section, last_touch_time = NOW() WHERE contact_id = contactId;
END IF;
END ;;
DELIMITER ;

While restoring same on to the RDS server, since the RDS doesn’t provide a SUPER privilege to its user, The restoration fails with the below error, since it fails

ERROR 1227 (42000) at line 15316: Access denied; you need (at least one of) the SUPER privilege(s) for this operation

This will be very annoying since the restore fails at the end,

To overcome this below is the simple one-liner piped with the mysqldump command, which replaces the “DEFINER=`xxxxx`@`localhost`”, So when you are restoring the dump file, the definer will be a user which is used to restore

mysqldump -u user -p -h 'testdb.xcvadshkgfd..us-east-1.rds.amazonaws.com' --single-transaction --quick --triggers --routines --no-data --events testdb | perl -pe 's/\sDEFINER=`[^`]+`@`[^`]+`//' > test_dump.sql

Below is the content from the dump file after ignoring the default “DEFINER”, the same can also be done vis AWK and SED commands too.

DELIMITER ;;
CREATE PROCEDURE `prc_contact_touch`(IN `contactId` INT, IN `section` VARCHAR(255))
BEGIN
IF NOT EXISTS (SELECT 1 FROM contacts_details WHERE contact_id = contactId) THEN
INSERT INTO contacts_details (contact_id, last_touch_source, last_touch_time) VALUES (contactId, section, NOW());
ELSE
UPDATE contacts_details SET last_touch_source = section, last_touch_time = NOW() WHERE contact_id = contactId;
END IF;
END ;;
DELIMITER ;

As you can see from the above the DEFINER section is completely removed.

Best practices for RDS migration,

1, Restore dump files from EC2 within the same VPC and RDS to have minimal network latency
2, Increase max_allowed_packet to 1G(max), to accommodate bigger packets
3, Dump data in parallel ,based on the instance capacity.
4, Bigger redo-log files can enhance the write performance
5, Make innodb_flush_log_at_trx_commit=2 for faster write with a little compromise to durability.


Query Macroeconomics

$
0
0

I studied some macroeconomics in school.  I’m still interested in it 20 years hence.  I was recently in a discussion about query optimization and how to prioritize what to fix first.  My pen and paper started graphing things, and here we are with an abstract thought.  Bear with me.  This is for entertainment purposes, mostly, but may actually have a small amount of value in your thought processes around optimizing queries.  This is a riff on various supply, demand graphs from macroeconomics.

In the graph below:

  • Axes:
    • Vertical: number of distinct problem queries
    • Horizontal: Database “query load capacity” gains (from optimization)
  • Lines:
    • LIRQ (long and/or infrequently run queries)
    • SFRQ (short, frequently run queries)
    • AC: Absolute capacity (the point at which you’re going as fast as I/O platform you run on will let you and your query capacity bottlenecks have less to do with queries and more to do with not enough IOPS).
  • Point:
    • E (subscript) O: Equilibrium of optimization

On LIRQ: Simply put, on a typical OLTP workload, you may have several long and infrequently running queries on the database that are “problems” for overall system performance.  If you optimize those queries, your performance gain in load capacity is sometimes fairly small.

ON SFRQ: Conversely, optimizing short running but very very frequently run “problem queries” can sometimes create very large gains in query load capacity.  Example: a covering index that takes a query that’s run many thousands of times a minute from 10 milliseconds down to < 1 millisecond by ensuring the data is in the bufferpool can give you some serious horsepower back.

On AC: Working on optimizing often run queries that are not creating an I/O logjam do not return any benefits.  You can only go as fast as your platform will let you, so if you are getting close to the point where your database is so well optimized that you really can’t read or write to disk any faster, then you have hit the wall and you will produce little ROI with your optimization efforts unless you make the platform faster (which moves the red line to the right).

On EO:  Often run long (or somewhat long) queries are the low hanging fruit.  They should stand out naturally and be a real “apparent pain” in the processlist or in application response times without even bothering to pt-query-digest.

Speaking of pt-query-digest: digests of the slow query log (when log_query_time is set to 0) are a good way to figure out what types of queries are taking up the lion’s share of your database load. You will be able to tell via the ranking and the total time and percentiles shown in the digest what queries are taking up your database’s valuable time.  I wish for you that you have SFRQ, so that your optimization effort may produce high rewards in capacity gain.

Thanks for bearing with me on my database capacity economics.


Global Read-Scaling using Continuent Clustering

$
0
0

Did you know that Continuent Clustering supports having clusters at multiple sites world-wide with either active-active or active-passive replication meshing them together?

Not only that, but we support a flexible hybrid model that allows for a blended architecture using any combination of node types. So mix-and-match your highly available database layer on bare metal, Amazon Web Services (AWS), Azure, Google Cloud, VMware, etc.

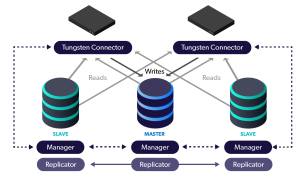
In this article we will discuss using the Active/Passive model to scale reads worldwide.

The model is simple: select one site as the Primary where all writes will happen. The rest of the sites will pull events as quickly as possible over the WAN and make the data available to all local clients. This means your application gets the best of both worlds:

  • Simple deployment with no application changes needed. All writes are sent the the master node in the Primary site cluster. Multimaster topologies can be more difficult to deploy due to conflicting writes.
  • Application clients are able to read data locally, so response time is much better
  • Ideal for Read-heavy/Write-light applications

The possibilities are endless, as is the business value. This distributed topology allows you to have all the benefits of high availability with centralized writes and local reads for all regions. Latency is limited only by the WAN link and the speed of the target node.

This aligns perfectly with the distributed Software-as-a-Service (SaaS) model where customers and data span the globe. Applications have access to ALL the data in ALL regions while having the ability to scale reads across all available slave nodes, giving you the confidence that operations will continue in the face of disruption.

Continuent Clustering incorporates the asynchronous Tungsten Replicator to distribute events from the write master to all read slaves. The loosely-coupled nature of this method allows for resilience in the face of uncertain global network communications and speeds. The Replicator intelligently picks up where it left off in the event of a network outage. Not only that, performance is enhanced by the asynchronous nature of the replication because the master does not need to wait for any slave to acknowledge the write.

Overall, Continuent Clustering is the most flexible, performant global database layer available today – use it underlying your SaaS offering as a strong base upon which to grow your worldwide business!

Click here for more online information on Continuent Clustering solutions

Want to learn more or run a POC? Contact us.

Databook: Turning Big Data into Knowledge with Metadata at Uber

MariaDB Cluster 5.5.61 and updated connectors now available

$
0
0
MariaDB Cluster 5.5.61 and updated connectors now available dbart Fri, 08/03/2018 - 12:00

The MariaDB project is pleased to announce the immediate availability of MariaDB Cluster 5.5.61 and updated MariaDB C/C++ and ODBC connectors. See the release notes and changelogs for details and visit mariadb.com/downloads to download.

Download MariaDB Cluster 5.5.61

Release Notes Changelog What is MariaDB Cluster?


Download MariaDB C/C++ and ODBC Connectors

MariaDB Connector/C 3.0.6 Release Notes MariaDB Connector/ODBC 3.0.6 Release Notes

The MariaDB project is pleased to announce the immediate availability of MariaDB Galera Cluster 5.5.61 and updated MariaDB Connectors C/C++ and ODBC. See the release notes and changelogs for details.

Login or Register to post comments

MariaDB Galera Cluster 5.5.61, MariaDB Connector/C 3.0.6 and MariaDB Connector/ODBC 3.0.6 now available

$
0
0

The MariaDB Foundation is pleased to announce the availability of MariaDB Galera Cluster 5.5.61 as well as MariaDB Connector/C 3.0.6 and MariaDB Connector/ODBC 3.0.6 all stable releases. See the release notes and changelogs for details. Download MariaDB Galera Cluster 5.5.61 Release Notes Changelog What is MariaDB Galera Cluster? Download MariaDB Connector/C 3.0.6 Release Notes Changelog […]

The post MariaDB Galera Cluster 5.5.61, MariaDB Connector/C 3.0.6 and MariaDB Connector/ODBC 3.0.6 now available appeared first on MariaDB.org.

Congrats to Duo Security!

$
0
0

Zack Duo Cisco 1
Congratulations to Duo Security, which announced that it is to be acquired by Cisco Systems for $2.35b. This is a great outcome for all involved, and I'm very proud of what the team has accomplished.

I worked with Duo for about three years, initially as an advisor and ultimately as Chief Operating Officer running Sales, Marketing, Products, Engineering and Services. I helped grow the company from around $7m in Annual Recurring Revenue (ARR) to about $100m. The company has continued to grow to 700 employees, 12,000 customers and revenues that I estimate could exceed $200m ARR by year end, based on prior published numbers.

Duo is the fastest growing company I've been a part of; faster even than Zendesk or MySQL. When a company grows this quickly, it becomes a different organization every year. The early sub-$10m revenue company is quite different from where Duo is today. I would always tell new employees to be prepared for change. What remained constant was an underlying set of midwestern values of hard work, customer care and innovation that made Duo special. (Also we had a really good fun band called "Louder Than Necessary.")

It's a testament to the founders' vision and the management skills of the leaders we recruited that the company scaled so well. I remain especially proud of the many people we hired, promoted and developed to become the future leaders in the company. As news of the acquisition came out, many people have asked me about the deal, so here are my thoughts...

First of all, this should be recognized as an absolute success for the management team. To grow a company to this size and value is very rare. Less than 1% of venture-backed companies get to a valuation of $1 billion. It's also one of the biggest software successes in the midwest and proves that you don't have to be in Silicon Valley to win big. (Duo has in fact expanded into San Mateo, Austin, London and Detroit. Part of Duo's success is due to these multiple locations, but that's a another story.) 

Secondly, this deal creates a larger force in the industry. There is no doubt that Duo could have proceeded towards an IPO in 2019; they had in fact hired several new executives to lead these efforts in recent months. But the combination of Cisco and Duo together is more significant than Duo on its own. There has been a large amount of consolidation in the security space in the last few years and I believe Cisco will emerge as a leader. They have the respect and attention of Global 2000 CISOs and CIOs, a strong worldwide sales machine and a large number of related products. In a few years time, it will be clear that Microsoft isn't the only company that is capable of reinvention. 

Duo-arr-growth-chartThirdly, this represents an opportunity for further growth for the team at Duo. Cisco plays on a larger global stage than Duo could on its own. But Duo's executives, managers, engineers, security experts, sales people, support engineers, product team and marketing organization have a lot of mojo to contribute. Duo has become one of the fastest growing SaaS companies on the planet and they know a thing or two about making security easy. The company has a Net Promoter Score (NPS) of 68, one of the highest in the industry!

And that is the key to why this deal makes sense to me. The combination gives Duo scale. But it also injects speed and innovation into an industry that needs it. The old approach to security, locking down your network with a VPN and using old-fogey security tokens doesn't work when your applications are in the cloud, employees are mobile and hackers are targeting everyone and every thing. I believe Duo is well positioned to lead with a modern new approach to security.

There's also a fourth point, which in the long term could become even more significant. Duo's success injects a large amount of capital in the Ann Arbor / Detroit area. The company has also developed tremendous expertise in building a SaaS company at scale. That combination of capital and talent will result in the creation of additional startups in coming years. Duo's investors (Benchmark, GV, Index, Redpoint,Rennaissance, True Ventures...) did very well and are likely to be open to investing in new startups in the region alongside other firms focused on the midwest such as Drive Capital, eLab Ventures, Steve Case's Revolution, RPM Ventures and others. This acquisition shines a spotlight on Michigan's growing tech scene and that will have all kinds of positive impact on investment, innovation and job creation.

To all my friends at Duo, this is a vote of confidence in all that you have created. I wish you congratulations on achieving this milestone. Now there's an even bigger opportunity to take this product line, security expertise and company culture to a bigger audience than we ever thought possible.

Go Duo!  


Fun with Bugs #70 - On MySQL Bug Reports I am Subscribed to, Part VIII

$
0
0
More than 2 months passed since my previous review of active MySQL bug reports I am subscribed to, so it's time to describe what I was interested in this summer.

Let's start with few bug reports that really surprised me:
  • Bug #91893 - "LOAD DATA INFILE throws error with NOT NULL column defined via SET". The bug was reported yesterday and seem to be about a regression in MySQL 8.0.12 vs older versions. At least I have no problem to use such a way to generate columns for LOAD DATA with MariaDB 10.3.7.
  • Bug #91847 - "Assertion `thread_ids.empty()' failed.". As usual, Roel Van de Paar finds funny corner cases and assertion failures of all kinds. This time in MySQL 8.0.12.
  • Bug #91822 - "incorrect datatype in RBR event when column is NULL and not explicit in query". Ernie Souhrada found out that the missing column is given the datatype of the column immediately preceding it, at least according to mysqlbinlog output.
  • Bug #91803 - "mysqladmin shutdown does not wait for MySQL to shut down anymore". My life will never be the same as before after this. How can we trust anything when even shutdown command is no longer works as expected? I hope this bug is not confirmed after all, it's still "Open".
  • Bug #91769 - "mysql_upgrade return code is '0' even after errors". Good luck to script writers! The bug is still "Open".
  • Bug #91647 - "wrong result while alter an event". Events may just disappear when you alter them. Take care!
  • Bug #91610 - "5.7 or later returns an error on strict mode when del/update with error func". Here Meiji Kimura noted a case when the behavior of strict sql_mode differs in MySQL 5.6 vs never versions.
  • Bug #91585 - "“dead” code inside the stored proc or function can significantly slow it down". This was proved by Alexander Rubin from Percona.
  • Bug #91577 - "INFORMATION_SCHEMA.INNODB_FOREIGN does not return a correct TYPE". This is a really weird bug in MySQL 8.
  • Bug #91377 - "Can't Initialize MySQl if internal_tmp_disk_storage_engine is set to MYISAM". It seems Oracle tries really hard to get rid of MyISAM by all means in MySQL 8 :)
  • Bug #91203 - "For partitions table, deal with NULL with is mismatch with reference guide". All version affected. maybe manual is wrong, but then we see weird results in information_schema as well. So, let's agree for now that it's a "Verified" bug in partitioning...
As usual, I am interested in InnoDB-related bugs:
  • Bug #91861 - "The buf_LRU_free_page function may leak some memory in a particular scenario". This is a very interesting bug report about the memory leak that happens when tables are compressed. It shows how to use memory instrumentation in performance_schema to pinpoint the leak. This bug report is still "Open".
  • Bug #91630 - "stack-use-after-scope in innobase_convert_identifier() detected by ASan". Yura Sorokin from Percona had not only reported this problem, but also contributed a patch.
  • Bug #91120 - "MySQL8.0.11: ibdata1 file size can't be more than 4G". Why nobody tries to do anything about this "Verified" bug reported 2 months ago?
  • Bug #91048 - "ut_basename_noext now dead code". This was reported by Laurynas Biveinis.
Replication problems are also important to know about:
  • Bug #91744 - "START SLAVE UNTIL going further than it should." This scary bug in cyclic replication setup was reported by  Jean-François Gagné 2 weeks ago and is still "Open" at the moment.
  • Bug #91633 - "Replication failure (errno 1399) on update in XA tx after deadlock". On top of all other problems with XA transactions we have in MySQL, it seems that replication may break upon executing a row update immediately after a forced transaction rollback due to a deadlock being detected while in an XA transaction.
Some optimizer bugs also caught my attention:
  • Bug #91486 - "Wrong column type , view , binary". We have a "Verified" regression bug here without a "regression" tag or exact versions checked. Well done, Sinisa Milivojevic!
  • Bug #91386 - "Index for group-by is not used with primary key for SELECT COUNT(DISTINCT a)". Yet another case where a well known bug reporter, Monty Solomon, had  to apply enormous efforts to get it "Verified" as a feature request.
  • Bug #91139 - "use index dives less often". A "Verified" feature request from Mark Callaghan.
The last but not the least, documentation bugs. We have one today (assuming I do not care that much about group replication):
  • Bug #91074 - "INSTANT add column undocumented". It was reported by my former colleague in Percona, Jaime Crespo. The bug is still "Verified" as of now, but since MySQL 8.0.12 release I think it's no longer valid. I see a lot of related details here, for example. But nobody cares to close this bug properly and provide the links to manual that were previously missing.
That's all for today, folks! Stay tuned.

5 Easy Ways To Improve Your Database Performance

$
0
0

In many cases, developers, DBAs and data analysts struggle with bad application performance and are feeling quite frustrated when their SQL queries are extremely slow, which can cause the entire database to perform poorly.

Luckily, there is a solution to this problem! In this article, we will briefly cover a few ways you can use to improve the overall database performance. In many cases, you’ll need to use one or more of these paths to resolve database performance issues.

Optimize Queries

In most cases, performance issues are caused by poor SQL queries performance. When trying to optimize those queries, you’ll run into many dilemmas, such as whether to use IN or EXISTS, whether to write a subquery or a join. While you can pay good dime on consulting services, you can also speed up SQL queries using query optimizers such as EverSQL Query Optimizer, which will both speed up the query and explain the recommendations, so you could learn for the future.

Essentially, EverSQL is one of the most effective online SQL query optimizers currently available; it is capable of optimizing not just MySQL, but MariaDB and PerconaDB queries as well – and you can try it out entirely for free!

Create optimal indexes

Indexing, when done properly, can help to optimize your query execution duration and increase overall database performance. Indexes accomplish this by implementing a data structure that helps to keep things organized and makes locating information easier; basically, indexing speeds up the data retrieval process and makes it more efficient, thereby saving you (and your system) time and effort.

Get a stronger CPU

The better your CPU, the faster and more efficient your database will be. Therefore, if your database underperforms, you should consider upgrading to a higher class CPU unit; the more powerful your CPU is, the less strain it will be under when tasked with multiple applications and requests. Also, when assessing CPU performance it’s important to keep track of all aspects of CPU performance, including CPU ready times (which can tell you about the times your system attempted to use the CPU but couldn’t because all of the CPU’s resources were too busy or otherwise occupied).

Allocate more memory

Similar to how having a CPU that’s not powerful enough can impact the efficiency of a database, so too can lack of memory. After all, when there is not enough memory available in the database to perform the work that is being asked of, database performance is understandably going to take a hit. Basically, having more memory available will help to boost the system’s efficiency and overall performance. A good way to check if you need more memory is to look at how many page faults your system has; if the number of faults is high (in the thousands, for example) it means that your hosts are running low on (or potentially entirely out of) available memory space. Therefore, when trying to improve database performance it’s important to both look at how much memory you have total as well as page faults (to determine if you need additional memory to improve efficiency).
In addition, you can consider increasing the amount of memory used by MySQL. Our recommendation is allow it to allocate 70% of the total memory (assuming the database is the only application on that server). You can modify the amount of memory allocated to the database using the innodb_buffer_pool_size key in MySQL’s configuration file, my.cnf.


Data defragmentation

If you’re having trouble with a slow database, another possible solution is data defragmentation. When many records are written to the database and time goes by, the records are fragmented in MySQL’s internal data files and on the disk itself. The defragmentation of the disk will allow grouping the relevant data together, so I/O related operations will run faster, which will directly impact on overall query and database performance. Also, on a somewhat related note it’s also important to have enough disk space in general when running a database; if you’re looking to truly optimize database performance, make sure to utilize disk defragmentation while also keeping plenty of free disk space available for your database.


Summary

Ultimately, whether you choose to utilize one or more of these methods, you can rest assured that there are plenty of options for improving your database performance. Test them one by one to see which one will have the largest impact on your database.

What Does I/O Latencies and Bytes Mean in the Performance and sys Schemas?

$
0
0

The Performance Schema and sys schema are great for investigating what is going on in MySQL including investigating performance issues. In my work in MySQL Support, I have a several times heard questions whether a peak in the InnoDB Data File I/O – Latency graph in MySQL Enterprise Monitor (MEM) or some values from the corresponding tables and view in the Performance Schema and sys schema are cause for concern. This blog will discuss what these observations means and how to use them.
The MEM InnoDB File I/O Graphs showing a peak in latency and bytes at 12:31.

The Tables and Views Involved

This blog will look into three sources in the Performance Schema for I/O latencies, so let’s first take a look at those tables. The three Performance Schema tables are:

  • events_waits_summary_global_by_event_name: with the event name set to wait/io/table/sql/handler or wait/io/file/%. This is the table used for the waits_global_by_latency and wait_classes_global_by_% views in the sys schema.
  • table_io_waits_summary_by_table: this is the table used for the schema_table_statistics% views in the sys schema.
  • file_summary_by_instance: this is the table used for the io_global_by_file_by% views in the sys schema.

These are also the sources used in MySQL Enterprise Monitor for the InnoDB Data File I/O graphs shown above. Let’s take a look at an example of each of the tables.

events_waits_summary_global_by_event_name

The events_waits_summary_global_by_event_name has aggregate data for wait events grouped by the event name. For the purpose of this discussion it is the table and file wait/io events that are of interested. An example of the data returned is:

mysql> SELECT *
         FROM performance_schema.events_waits_summary_global_by_event_name
        WHERE EVENT_NAME = 'wait/io/table/sql/handler'
              OR EVENT_NAME LIKE 'wait/io/file/%'
        ORDER BY SUM_TIMER_WAIT DESC
        LIMIT 5;
+--------------------------------------+------------+----------------+----------------+----------------+----------------+
| EVENT_NAME                           | COUNT_STAR | SUM_TIMER_WAIT | MIN_TIMER_WAIT | AVG_TIMER_WAIT | MAX_TIMER_WAIT |
+--------------------------------------+------------+----------------+----------------+----------------+----------------+
| wait/io/file/innodb/innodb_log_file  |    4003029 | 97371921796204 |        5371684 |       24324412 |   180878537324 |
| wait/io/table/sql/handler            |    4049559 | 43338753895440 |         494128 |       10702072 |   138756437188 |
| wait/io/file/innodb/innodb_data_file |      25850 | 11395061934996 |              0 |      440814508 |    43029060332 |
| wait/io/file/sql/binlog              |      20041 |  1316679917820 |              0 |       65699088 |    25816580304 |
| wait/io/file/sql/io_cache            |       2439 |    68212824648 |        1448920 |       27967360 |      628484180 |
+--------------------------------------+------------+----------------+----------------+----------------+----------------+
5 rows in set (0.00 sec)

mysql> SELECT EVENT_NAME, COUNT_STAR,
              sys.format_time(SUM_TIMER_WAIT) AS SumTimerWait,
              sys.format_time(MIN_TIMER_WAIT) AS MinTimeWait,
              sys.format_time(AVG_TIMER_WAIT) AS AvgTimerWait,
              sys.format_time(MAX_TIMER_WAIT) AS MaxTimerWait
         FROM performance_schema.events_waits_summary_global_by_event_name
        WHERE EVENT_NAME = 'wait/io/table/sql/handler'
              OR EVENT_NAME LIKE 'wait/io/file/
%' ORDER BY SUM_TIMER_WAIT DESC LIMIT 5;
+--------------------------------------+------------+--------------+-------------+--------------+--------------+
| EVENT_NAME                           | COUNT_STAR | SumTimerWait | MinTimeWait | AvgTimerWait | MaxTimerWait |
+--------------------------------------+------------+--------------+-------------+--------------+--------------+
| wait/io/file/innodb/innodb_log_file  |    4003029 | 1.62 m       | 5.37 us     | 24.32 us     | 180.88 ms    |
| wait/io/table/sql/handler            |    4049559 | 43.34 s      | 494.13 ns   | 10.70 us     | 138.76 ms    |
| wait/io/file/innodb/innodb_data_file |      25853 | 11.40 s      | 0 ps        | 440.78 us    | 43.03 ms     |
| wait/io/file/sql/binlog              |      20041 | 1.32 s       | 0 ps        | 65.70 us     | 25.82 ms     |
| wait/io/file/sql/io_cache            |       2439 | 68.21 ms     | 1.45 us     | 27.97 us     | 628.48 us    |
+--------------------------------------+------------+--------------+-------------+--------------+--------------+
5 rows in set (0.01 sec)

mysql> SELECT *
         FROM sys.waits_global_by_latency
        WHERE events = 'wait/io/table/sql/handler'
              OR events LIKE 'wait/io/file/%'
        LIMIT 5;
+--------------------------------------+---------+---------------+-------------+-------------+
| events                               | total   | total_latency | avg_latency | max_latency |
+--------------------------------------+---------+---------------+-------------+-------------+
| wait/io/file/innodb/innodb_log_file  | 4003029 | 1.62 m        | 24.32 us    | 180.88 ms   |
| wait/io/table/sql/handler            | 4049559 | 43.34 s       | 10.70 us    | 138.76 ms   |
| wait/io/file/innodb/innodb_data_file |   25874 | 11.43 s       | 441.88 us   | 43.03 ms    |
| wait/io/file/sql/binlog              |   20131 | 1.32 s        | 65.66 us    | 25.82 ms    |
| wait/io/file/sql/io_cache            |    2439 | 68.21 ms      | 27.97 us    | 628.48 us   |
+--------------------------------------+---------+---------------+-------------+-------------+
5 rows in set (0.01 sec)

These three queries show the same data, just obtained and displayed in different ways.

In the result there are two groups of events. The wait/io/table events (the wait/io/table/sql/handler is the only event of this group which is why it can be listed explicitly) and the wait/io/file group.

The table events are for accessing data in tables. It does not matter whether the data is cached in the buffer pool or is accessed on disk. In this table and view, there is no distinguishing between different types of access (read, write, etc.).

The file events are, as the name suggest, for actually accessing files. There is one file event per file type. For example, in he output there are the wait/io/file/innodb/innodb_log_file event for accessing the InnoDB redo log files, the wait/io/file/innodb/innodb_data_file event for accessing the InnoDB data files themselves, the wait/io/file/sql/binlog event for the binary log files, etc.

In the second query, all of the timings are wrapped in the sys.format_time() function. The timings returned by the Performance Schema are in picoseconds (10^-12 second) which are somewhat hard for us humans to read. The sys.format_time() function converts the picoseconds to human readable strings. When you sort, however, make sure you sort by the original non-converted values.

Tip: Use the sys.format_time() function to convert the picoseconds to a human readable value, but do only so for the returned row; sort and filter by the original values. The Performance Schema always returns timings in picoseconds irrespective of the timer used internally for the event.

The sys schema by default returns the timing as human readable values. If you need the values in picoseconds prefix the table name with x$, for example sys.x$waits_global_by_latency. The sys schema includes an ORDER BY clause in most views. For the waits_global_by_latency view, the default ordering is by the total latency, so there is no need to add an ORDER BY clause in this example.

table_io_waits_summary_by_table

The table_io_waits_summary_by_table Peformance Schema table and schema_table_statistics% sys schema views are related to the wait/io/table/sql/handler event just discussed. These provide information about the amount of time spent per table. Unlike querying the wait/io/table/sql/handler in the wait_events_% tables, it split the time spent into whether it is used for reads, writes, fetch, insert, update, or delete. The read and write columns are the aggregates for the corresponding read and write operations, respectively. Since fetch is the only read operation, the read and fetch columns will have the same values.

The table and view show the table I/O, i.e. the access to table data irrespective of whether the data is accessed in-memory or on disk. This is similar to the wait/io/table/sql/handler event. An example of the result of querying the table and view for the employees.salaries table is:

mysql> SELECT *
         FROM performance_schema.table_io_waits_summary_by_table
        WHERE OBJECT_SCHEMA = 'employees'
              AND OBJECT_NAME = 'salaries'\
*************************** 1. row ***************************
     OBJECT_TYPE: TABLE
   OBJECT_SCHEMA: employees
     OBJECT_NAME: salaries
      COUNT_STAR: 2844047
  SUM_TIMER_WAIT: 31703741623644
  MIN_TIMER_WAIT: 4975456
  AVG_TIMER_WAIT: 11147072
  MAX_TIMER_WAIT: 138756437188
      COUNT_READ: 0
  SUM_TIMER_READ: 0
  MIN_TIMER_READ: 0
  AVG_TIMER_READ: 0
  MAX_TIMER_READ: 0
     COUNT_WRITE: 2844047
 SUM_TIMER_WRITE: 31703741623644
 MIN_TIMER_WRITE: 4975456
 AVG_TIMER_WRITE: 11147072
 MAX_TIMER_WRITE: 138756437188
     COUNT_FETCH: 0
 SUM_TIMER_FETCH: 0
 MIN_TIMER_FETCH: 0
 AVG_TIMER_FETCH: 0
 MAX_TIMER_FETCH: 0
    COUNT_INSERT: 2844047
SUM_TIMER_INSERT: 31703741623644
MIN_TIMER_INSERT: 4975456
AVG_TIMER_INSERT: 11147072
MAX_TIMER_INSERT: 138756437188
    COUNT_UPDATE: 0
SUM_TIMER_UPDATE: 0
MIN_TIMER_UPDATE: 0
AVG_TIMER_UPDATE: 0
MAX_TIMER_UPDATE: 0
    COUNT_DELETE: 0
SUM_TIMER_DELETE: 0
MIN_TIMER_DELETE: 0
AVG_TIMER_DELETE: 0
MAX_TIMER_DELETE: 0
1 row in set (0.00 sec)

mysql> SELECT *
         FROM sys.schema_table_statistics
        WHERE table_schema = 'employees'
              AND table_name = 'salaries'\G
*************************** 1. row ***************************
     table_schema: employees
       table_name: salaries
    total_latency: 31.70 s
     rows_fetched: 0
    fetch_latency: 0 ps
    rows_inserted: 2844047
   insert_latency: 31.70 s
     rows_updated: 0
   update_latency: 0 ps
     rows_deleted: 0
   delete_latency: 0 ps
 io_read_requests: 493
          io_read: 7.70 MiB
  io_read_latency: 611.04 ms
io_write_requests: 8628
         io_write: 134.91 MiB
 io_write_latency: 243.19 ms
 io_misc_requests: 244
  io_misc_latency: 2.50 s
1 row in set (0.05 sec)

In this case it shows that there has been mostly writes – inserts – for the table. The sys schema view effectively joins on the performance_schema.file_summary_by_instance for the read columns, so for the schema.table_statistics view fetch and read are not synonyms.

So, what is it the file_summary_by_instance table shows that is different table the “table I/O” that has been the topic of the first two tables? Let’s see.

file_summary_by_instance

Unlike the two previous tables, the file_summary_by_instance shows how much time is spent on actual file I/O and how much data is accessed. This makes the file_summary_by_instance table and the corresponding sys schema views very useful for determining where time is spent doing disk I/O and which files have the most data accesses on disk.

An example of using the Performance Schema and two of the sys schema views is:

mysql> SELECT *
         FROM performance_schema.file_summary_by_instance
        WHERE FILE_NAME LIKE '%\\\\employees\\\\salaries.ibd'\G
*************************** 1. row ***************************
                FILE_NAME: C:\ProgramData\MySQL\MySQL Server 8.0\Data\employees\salaries.ibd
               EVENT_NAME: wait/io/file/innodb/innodb_data_file
    OBJECT_INSTANCE_BEGIN: 2230271392896
               COUNT_STAR: 9365
           SUM_TIMER_WAIT: 3351594917896
           MIN_TIMER_WAIT: 11970500
           AVG_TIMER_WAIT: 357885020
           MAX_TIMER_WAIT: 40146113948
               COUNT_READ: 493
           SUM_TIMER_READ: 611040652056
           MIN_TIMER_READ: 65421052
           AVG_TIMER_READ: 1239433224
           MAX_TIMER_READ: 16340582272
 SUM_NUMBER_OF_BYTES_READ: 8077312
              COUNT_WRITE: 8628
          SUM_TIMER_WRITE: 243186542696
          MIN_TIMER_WRITE: 11970500
          AVG_TIMER_WRITE: 28185588
          MAX_TIMER_WRITE: 1984546920
SUM_NUMBER_OF_BYTES_WRITE: 141459456
               COUNT_MISC: 244
           SUM_TIMER_MISC: 2497367723144
           MIN_TIMER_MISC: 154910196
           AVG_TIMER_MISC: 10235113564
           MAX_TIMER_MISC: 40146113948
1 row in set (0.00 sec)

mysql> SELECT *
         FROM sys.io_global_by_file_by_latency
        WHERE file = '@@datadir\\employees\\salaries.ibd'\G
*************************** 1. row ***************************
         file: @@datadir\employees\salaries.ibd
        total: 9365
total_latency: 3.35 s
   count_read: 493
 read_latency: 611.04 ms
  count_write: 8628
write_latency: 243.19 ms
   count_misc: 244
 misc_latency: 2.50 s
1 row in set (0.09 sec)

mysql> SELECT *
         FROM sys.io_global_by_file_by_bytes
         WHERE file = '@@datadir\\employees\\salaries.ibd'\G
*************************** 1. row ***************************
         file: @@datadir\employees\salaries.ibd
   count_read: 493
   total_read: 7.70 MiB
     avg_read: 16.00 KiB
  count_write: 8628
total_written: 134.91 MiB
    avg_write: 16.01 KiB
        total: 142.61 MiB
    write_pct: 94.60
1 row in set (0.10 sec)

This example is from Microsoft Windows, and as always when backslashes are in play, it is fun to try to determine the appropriate number of backslashes to use. When specifying the file name with LIKE, you need four backslashes per backslash in the file name; when using = you need two backslashes.

Again, the values are split into reads and writes (though not as detailed as before with fetch, insert, update, and delete – that is not known at the level where the file I/O happens). The miscellaneous values include everything that is not considered reads or write; this includes opening and closing the file.

The sys schema queries not only have formatted the timings, but also the path and the bytes. This has been done using the sys.format_path() and sys.format_bytes() functions, respectively.

From the output, it can be seen that despite no rows were ever fetched (read) from the employees.salaries table (that was found in the previous output), there has still been some read file I/O. This was what the sys.schema_table_statistics view reflected.

So, what does all of this mean? The graph in MySQL Enterprise Monitor showed that there was six seconds file I/O latency for the InnoDB data files. Is that bad? As often with these kinds of questions, the answer is: “it depends”.

What to Make of the Values

In this case we have a case where the graphs in MySQL Enterprise Monitor show a peak for the latency and bytes used doing I/O on the InnoDB data files. This is actually disk I/O. But what exactly does that means and should the alarm sound?

Let’s first refresh our memory on how the graphs looked:
The MEM InnoDB File I/O Graphs showing a peak in latency and bytes at 12:31.If you are not using MySQL Enterprise Monitor, you may have similar graphs from your monitoring solution, or you have obtained latency and bytes values from the tables and views discussed in this blog.

The latency graph shows that we have done six seconds if I/O. What does that mean? It is the aggregate I/O during the period the data was collected. In this case, the data is plotted for every minute, so in the one minute around 12:51, of the 60 seconds a total of six seconds was spent doing I/O. Now, the six seconds suddenly do no sound so bad. Similar for the bytes, around 4.6MiB of data was read or written.

In general, the values obtained either from the monitoring graphs or from the underlying tables cannot be used to conclude whether the is a problem or not. They just show how much I/O was done at different times.

Similar for the values from the Performance Schema. On their own they do not tell much. You can almost say they are too neutral – they just state how much work was done, not whether it was too much or too little.

A more useful way to use this data is in case a problem is reported. This can be that system administrator reports the disks are 100% utilized or that end users report the system is slow. Then, you can go and look at what happened. If the disk I/O was unusually high at that point in time, then that is likely related, and you can continue your investigation from there.

There are more reports in MySQL Enterprise Monitor both as time series graphs and as point-in-time snapshots. The point-in-time snapshots are often using the sys schema views but allows sorting. An example is the Database File I/O reports:
MEM's Database File I/O ReportMySQL Workbench also provides performance reports based on the sys scheme. The equivalent to the previous report is the Top File I/O Activity Report:
MySQL Workbench's Top File I/O Activity ReportThe MySQL Workbench performance reports also allows you to export the report or copy the query used to generate the report, so you can execute it manually.

With respect to the wait/io/table/sql/handler events, then remember that I/O here does not mean disk I/O, but table I/O. So, all it means that time is accumulating for these events – including when looking at the per table is that the data in the table is used. There are also per index values in table_io_waits_summary_by_index_usage Performance Schema table and the schema_index_statistics sys view which have the same meaning. Whether a given usage is too high depends on many things. However, it can again be useful to investigate what is causing problems.

For the example data from this blog, it was triggered by loading the employees sample database. So, there was no problem. If you want to put data into your database, it must necessarily be written to the data file, otherwise it will not be persisted. However, if you think the data import took too long, you can use the data as part of your investigation on how to make the import faster.

The conclusion is that you should not panic if you see the I/O latencies peak. On their own they just mean that more work was done during that period that usual. Without context a peak is no worse than a dip (which could indicate something is preventing work from being done or that there is a natural slow period). Instead use the I/O latencies and bytes together with other observations to understand where MySQL is spending time and for which files data is being read and written.

References

I will recommend you look at the following references, if you want to understand more about the Performance Schema tables and sys schema views discussed in this blog:

The GitHub repository for the sys schema includes all the definitions of the views (and other objects). Since these are written in plain SQL, they are very useful to see in more depth where the data is coming from. The GitHub website allows you to browse through each of the files. Each sys schema object is defined in its own file.

Vitess Weekly Digest

$
0
0
This week, we kick off our new weekly blog updates — bringing you the best of Vitess questions and topics on our Slack discussions. The goal is to show the most interesting topics and requests so those of you just getting started can see highlights of what has been covered.

Since this is our first ever digest, we’re going to go back in time and publish a little more than what happened last week.

Large result sets

Alejandro [Jul 2nd at 9:54 AM]
Good morning, we are trying to move away from interacting with Vitess through gRPC and instead using the MySQL binary protocol and I was just wondering if anyone here could let me know if Vitess supports unbuffered/streaming queries (returning more than 10K rows) over the MySQL binary protocol, or if that is just a gRPC feature? Thanks in advance. (edited)

sougou [29 days ago]
@Alejandro set workload='olap' should do it (for mysql protocol)

Naming shards

Deepak [9:36 AM]
Hello everyone, I have a small doubt can someone please help me with it? I have four shards in Vitess cluster but all the data are going in just one shard. One of the difference in the setup is shard nomenclature. Instead of giving -80, 80- etc as shard names (params to -init_shard flag to vttablet) I have given names 0, 1, 2, 3. Can this be the cause of all data going to just one shard?

sougou [10:11 AM]
@Deepak yeah. shards have to be named by their keyrange

DB config parameters simplified


sougou [10:06 AM]
yay. no more long list of db command line options for vttablet: https://github.com/vitessio/vitess/pull/4088

all db-config-XXX options are now deprecated.

acharis [10:08 AM]
but will still work?

sougou [10:08 AM]
yes

acharis [10:08 AM]
great

sougou [10:08 AM]
till 3.0, then I'll delete them

MySQL 8.0 support

hrishy [7:33 PM]
does vitess support mysql 5.8 and the native json in particular

sougou [7:41 PM]
@hrishy I assume you mean 8.0. Although it hasn't been tried, we think it should work.


derekperkins [7:49 PM]
the new 8.0 JSON functions won’t work yet, those have to get added to the parser, but if that’s a blocker for you, it’s pretty easy to add

derekperkins [8 days ago]
https://github.com/vitessio/vitess/issues/4099

Replica chicken-and-egg

faut [1:01 AM]
Hello. I need some help migrating to vitess. I have a baremetal master running mysql 5.6 and vttablet pointing to that master. I can query the master through vttablet and vtgate. The replicas however are still empty and cannot replicate because they don’t have the correct schema. I thought I could try make it a rdonly tablet and do the copy but that says no storage method implemented (assuming because it is not managed by mysqlctld) I’m not sure what the best approach from here is.

sougou [6:21 AM]
@faut you can setup the replicas independent of vitess: manually copy the schema and point them at the master, just like you would to a regular mysql replica
mysqlctl is good only if you want vitess to manage the mysqls from the ground up.
but if you want to spin up a brand new replica, you first need to take a backup through vtctl
then spinning up a vttablet against an empty mysql will restore from that backup and automatically point it to the master

faut [6:24 AM]
yea, I’m stuck at the point of making the backup through vtctl. I want to try get away from managed the sql servers. 
If I had a replica/rdonly with the schema manually copied would it manage to copy all the data from the existing master?
I am able to do a GetSchema off the master but cannot just restore that schema to the rdonly/replica.

sougou [6:26 AM]
there is a chicken-and-egg problem here
because you can't take a backup from a master

faut [6:26 AM]
Yes :joy:

sougou [6:26 AM]
so, you need to manually bring up one rdonly replica
and take a backup using that
after that you can spin up more
(we need to fix that limitation). there's an issue for it

Vitess auto-fixes replication

sjmudd [5:52 AM]
Hi all. I was a bit surprised by something I saw today in Vitess. I had a master which was configured on “the wrong port”, so to simplify things I adjusted the configuration and restarted vttablet and mysqld.  Clearly changing the port the master was listening on broke replication so I went to fix the replica configurations by doing a stop slave and was going to do a change master to master_port = xxx only to find it had given me an error: replication was already running. It looks like vttablet will “fix” the master host:port configuration if replication is stopped and restart replication.
Wasn’t bad but was unexpected.

sjmudd [5:52 AM]
Is this expected? (I’d guess so). What other magic type behaviour does vitess do and when? @sougou?

sougou [6 days ago]
vttablet will try to fix replication by default. You can disable it with the -disable_active_reparents flag. If you're managing mysql externally to vitess, this should be specified for vttablet as well as vtctld.

skyler [6:08 AM]
Is there a document anywhere that lists the kinds of SQL queries that are incompatible with Vitess?

derekperkins [6:24 AM]
@skyler it depends whether your queries are single shard or not
single shard supports most any query since it is just passed through to the underlying MySQL instance
cross-shard is much more limited

sjmudd [7.12 AM]
also there are several things even a single shard won’t handle well: e.g. setting/querying session/global variables

use of query hints.
many of these things may not be a concern.
but if you use them can require code changes.

Sougou: while it is configurable I think you should probably show the default vitess version as 5.7.X as 5.5.X is rather antique right now.

I’ve changed my setup to advertise as 5.7.X. Is there a need to show such a low version?  iirc this can lead replication to behave differently as the i/o thread sometimes takes the remote version into account. I’d guess most other things may not care.

sougou [8:09 AM]
yeah. we can change the default now. most people are on 5.7 now

acharis [9:17 AM]
i think vtexplain might be what you're looking for

skyler [6 days ago]
nice! Thank you. I was unaware of that.

derekperkins [6 days ago]
Thanks, I couldn't remember for sure what the current iteration was called

Joomla! and MySQL 8.0.12

$
0
0

As other CMS using MySQL and PHP, Joomla! is not yet 100% ready to work with MySQL 8.0 out of the box.

I’ve been contacted by Brian Teeman to give my opinion and some tips… so here is the blog post 😉

For Joomla!, I’ve tried the latest 4.0.0 Alpha 4 available for download. I’m also using PHP 7.0.31 and the new MySQL 8.0.12.

Database and User Creation

First let’s create a user (joomla/joomla) and a database. I won’t change the authentication method yet and let the default:

Joomla! Installation Wizard

And now we can start Joomla!’s installation wizard:

So far, all good, let’s jump the the database settings:

And when we click on “Install Joomla >“….

Expected problem… as of course PHP is not supporting the new default ‘caching_sha2_password‘ authentication method (check this previous post to know more about it).

So let’s change the authentication method for our user joomla:

Let’s try again…

KABOUM, again the same error…, we also need to change my.cnf to let know the server that the default authentication method is ‘mysql_native_password‘.

So in my.cnf, in the [mysqld] section we add:

default_authentication_plugin = mysql_native_password

And we restart mysqld.

Let’s try again to clik on “Install Joomla >“….

Wooohooo it works \o/

However this is not yet enough… as if you click on “Complete & Open Site“, we can see that there is a problem:

We should see more… we don’t see the complete site.

As explained in the Joomla! wiki page for MySQL 8, we need to run a specific query:

Now we can refresh our Joomla! page and…

Taaaadaaam ! It works ! Not that complicated after all 😀

Conclusion

So, in conclusion, to run Joomla! with MySQL 8.0 you need:

  • to use mysql_native_password as authentication method as default in the server
  • be sure your created user uses mysql_native_password as authentication method
  • run one UPDATE query as described in the Joomla! wiki page.

You can easily verify the authentication method for a user running:


and the default authentication method like this:

That’s all for now and enjoy Joomla! with MySQL 8.0 !

Viewing all 18801 articles
Browse latest View live


<script src="https://jsc.adskeeper.com/r/s/rssing.com.1596347.js" async> </script>