Quantcast
Channel: Planet MySQL
Viewing all 18840 articles
Browse latest View live

System Performance Theory

$
0
0

Note: this event isn’t open to the public. In college Henrik Ingo got to do an exercise on queueing theory: how to optimize the number of cash registers and bathroom stalls in a McDonalds restaurant. After graduating he never worked in a McDonalds and forgot all about this. It was only through some writings of Baron Schwartz that he realized that queueing theory also applies directly to database performance (and systems performance). So to start a series of internal talks at MongoDB about performance, there was no better way than to have Baron give an introduction to Queueing theory, Amdahl’s law and the Universal Scalability Law.

Baron Schwartz became known as a database performance expert when working at Percona, where he was one of their first employees. In addition to numerous conference talks and blogs, he is also co-author of the 2nd to 3rd editions of the book High Performance MySQL. Over time his methodology developed into a more data and statistics driven approach. In one publication he reviewed and categorized the root causes for database outages in all Percona support incidents over one year. Many of his methods and ideas were added to and popularized in the Percona Toolkit, which is the mtools of the MySQL world. The culmination of this path was the founding of his own company VividCortex, which provides a database monitoring service for open source databases (including MongoDB). In addition to standard performance monitoring and query analyzer dashboards, VividCortex includes fault detection algorithms based on—wait for it—queueing theory.


Percona Live Europe Tutorial: Elasticsearch 101

$
0
0

Elasticsearch markFor Percona Live Europe, I’ll be presenting the tutorial Elasticsearch 101 alongside my colleagues and fellow presenters from ObjectRocket Alex Cercel, DBA, and Mihai Aldoiu, Data Engineer. Here’s a brief overview of our tutorial.

Elasticsearch® is well known as a highly scalable search engine that stores data in a structure optimized for language based searches but its capabilities and use cases don’t stop there. In this tutorial, we’ll give you a hands-on introduction to Elasticsearch and give you a glimpse at some of the fundamental concepts. We’ll cover various administrative topics like installation and configuration, Cluster/Node management, indexes management and monitoring cluster health. We will also look at developer-oriented topics like mappings and analysis, aggregations and schema design that will help you build a robust application. There will be lab sessions too – bring a laptop!

Why’s it exciting? Well, although my main focus is on MongoDB, I am a huge fan of polyglot persistence. I start dealing with Elasticsearch, like, a year ago to overcome some MongoDB hard limits, and I must admit I entered a whole new world. Before working with Elasticsearch I was under the misconception “it’s for full-text search only“. The truth is that the product offers way more than that. I am looking forward to sharing my experience through this presentation.

Alex and Mihai are senior Elasticsearch data engineers who’ll share their deep knowledge and expertise with the attendees.

Who would get the most from this talk?

Well, everyone could benefit but if I wanted to make it a little bit more specific those with most to gain are:

  • those who know nothing about Elasticsearch or you fall under the same misconception as I did 🙂
  • someone who wants to start a new project and consider Elasticsearch as an option
  • if you are already dealing with Elasticsearch and you want to develop more knowledge of its operations and internals.
  • those running Elasticsearch in production and you are facing any type of challenge

What presentations am I most looking forward to?

At Percona conferences, I wish I was Jamie Madrox. I wish I could create “dupes” of myself and attend every presentation. I will try to attend all MongoDB related talks since it’s my primary focus. However, this year I will also watch out for postgres-related talks. Postgres made huge steps forward since the last time I worked with it—it’s become “hot” again in the database world.

Antonios Giannopoulos in PL tee
Editor: Thanks to Antonios for modelling a past Percona Live tee. Come join in the tutorial and pick up one of your own.

Register Now

Percona Live conferences provide the open source database community with an opportunity to discover and discuss the latest open source trends, technologies and innovations. The conference includes the best and brightest innovators and influencers in the open source database industry so don’t delay? Register now!


The post Percona Live Europe Tutorial: Elasticsearch 101 appeared first on Percona Community Blog.

New White Paper on State-of-the-Art Database Management: ClusterControl - The Guide

$
0
0

Today we’re happy to announce the availability of our first white paper on ClusterControl, the only management system you’ll ever need to automate and manage your open source database infrastructure!

Download ClusterControl - The Guide!

Most organizations have databases to manage, and experience the headaches that come with that: managing performance, monitoring uptime, automatically recovering from failures, scaling, backups, security and disaster recovery. Organizations build and buy numerous tools and utilities for that purpose.

ClusterControl differs from the usual approach of trying to bolt together performance monitoring, automatic failover and backup management tools by combining – in one product – everything you need to deploy and operate mission-critical databases in production. It automates the entire database environment, and ultimately delivers an agile, modern and highly available data platform based on open source.

All-in-one management software - the ClusterControl features set:

Since the inception of Severalnines, we have made it our mission to provide market-leading solutions to help organisations achieve optimal efficiency and availability of their open source database infrastructures.

With ClusterControl, as it stands today, we are proud to say: mission accomplished!

Our flagship product is an integrated deployment, monitoring, and management automation system for open source databases, which provides holistic, real-time control of your database operations in an easy and intuitive experience, incorporating the best practices learned from thousands of customer deployments in a comprehensive system that helps you manage your databases safely and reliably.

Whether you’re a MySQL, MariaDB, PostgreSQL or MongoDB user (or a combination of these), ClusterControl has you covered.

Deploying, monitoring and managing highly available open source database clusters is not a small feat and requires either just as highly specialised database administration (DBA) skills … or professional tools and systems that non-DBA users can wield in order to build and maintain such systems, though these typically come with an equally high learning curve.

The idea and concept for ClusterControl was born out of that conundrum that most organisations face when it comes to running highly available database environments.

It is the only solution on the market today that provides that intuitive, easy to use system with the full set of tools required to manage such complex database environments end-to-end, whether one is a DBA or not.

The aim of this Guide is to make the case for comprehensive open source database management and the need for cluster management software. And explains in a just as comprehensive fashion why ClusterControl is the only management system you will ever need to run highly available open source database infrastructures.

Download ClusterControl - The Guide!

Finding Table Differences on Nullable Columns Using MySQL Generated Columns

$
0
0
MySQL generated columns

MySQL generated columns
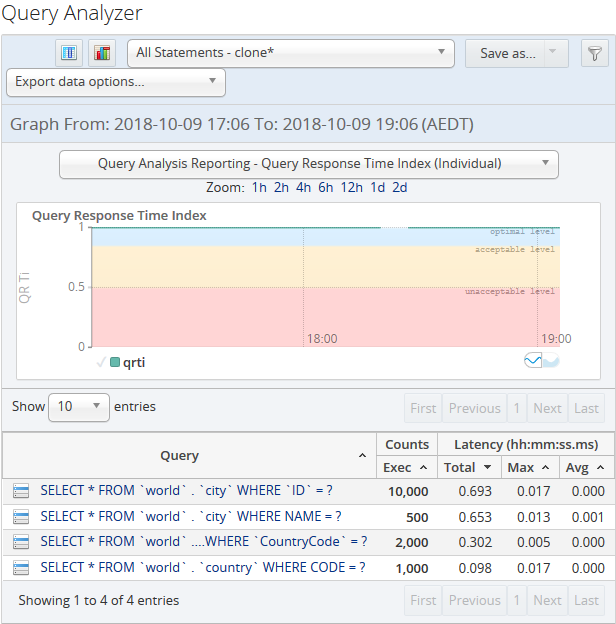
Some time ago, a customer had a performance issue with an internal process. He was comparing, finding, and reporting the rows that were different between two tables. This is simple if you use a LEFT JOIN and an 

IS NULL
  comparison over the second table in the WHERE clause, but what if the column could be null? That is why he used UNION, GROUP BY and a HAVING clauses, which resulted in poor performance.

The challenge was to be able to compare each row using a LEFT JOIN over NULL values.

The challenge in more detail

I’m not going to use the customer’s real table. Instead, I will be comparing two sysbench tables with the same structure:

CREATE TABLE `sbtest1` (
  `id` int(10) unsigned NOT NULL AUTO_INCREMENT,
  `k` int(10) unsigned DEFAULT NULL,
  `c` char(120) DEFAULT NULL,
  `pad` char(60) DEFAULT NULL,
  PRIMARY KEY (`id`),
  KEY `k` (`k`,`c`,`pad`)
) ENGINE=InnoDB

It is sightly different from the original sysbench schema, as this version can hold NULL values. Both tables have the same number of rows. We are going to set to NULL one row on each table:

update sbtest1 set k=null where limit 1;
update sbtest2 set k=null where limit 1;

If we execute the comparison query, we get this result:

mysql> select "sbtest1",a.* from
    -> sbtest1 a left join
    -> sbtest2 b using (k,c,pad)
    -> where b.id is null union
    -> select "sbtest2",a.* from
    -> sbtest2 a left join
    -> sbtest1 b using (k,c,pad)
    -> where b.id is null;
+---------+------+------+-------------------------------------------------------------------------------------------------------------------------+-------------------------------------------------------------+
| sbtest1 | id   | k    | c                                                                                                                       | pad                                                         |
+---------+------+------+-------------------------------------------------------------------------------------------------------------------------+-------------------------------------------------------------+
| sbtest1 | 4462 | NULL | 64568100364-99474573987-46567807085-85185678273-10829479379-85901445105-43623848418-63872374080-59257878609-82802454375 | 07052127207-33716235481-22978181904-76695680520-07986095803 |
| sbtest2 | 4462 | NULL | 64568100364-99474573987-46567807085-85185678273-10829479379-85901445105-43623848418-63872374080-59257878609-82802454375 | 07052127207-33716235481-22978181904-76695680520-07986095803 |
+---------+------+------+-------------------------------------------------------------------------------------------------------------------------+-------------------------------------------------------------+
2 rows in set (3.00 sec)

As you can see, column k is NULL. In both cases it failed and reported those rows to be different. This is not new in MySQL, but it would be nice to have a way to sort this issue out.

Solution

The solution is based on GENERATED COLUMNS with a hash function (md5) and stored in a binary(16) column:

ALTER TABLE sbtest1
ADD COLUMN `real_id` binary(16) GENERATED ALWAYS AS (unhex(md5(concat(ifnull(`k`,'NULL'),ifnull(`c`,'NULL'),ifnull(`pad`,'NULL'))))) VIRTUAL,
ADD INDEX (real_id);
ALTER TABLE sbtest2
ADD COLUMN `real_id` binary(16) GENERATED ALWAYS AS (unhex(md5(concat(ifnull(`k`,'NULL'),ifnull(`c`,'NULL'),ifnull(`pad`,'NULL'))))) VIRTUAL,
ADD INDEX (real_id);

Adding the index is also part of the solution. Now, let’s execute the query using the new column to join the tables:

mysql> select "sbtest1",a.k,a.c,a.pad from
    -> sbtest1 a left join
    -> sbtest2 b using (real_id)
    -> where b.id is null union
    -> select "sbtest2",a.k,a.c,a.pad from
    -> sbtest2 a left join
    -> sbtest1 b using (real_id)
    -> where b.id is null;
Empty set (2.31 sec)

We can see an improvement in the query performance—it now takes 2.31 sec whereas before it was 3.00 sec—and that the result is as expected. We could say that that’s all, and no possible improvement can be made. However, is not true. Even though the query is running faster, it is possible to optimize it in this way:

mysql> select "sbtest1",a.k,a.c,a.pad
    -> from sbtest1 a
    -> where a.id in (select a.id
    ->   from sbtest1 a left join
    ->   sbtest2 b using (real_id)
    ->   where b.id is null) union
    -> select "sbtest2",a.k,a.c,a.pad
    -> from sbtest2 a
    -> where a.id in (select a.id
    ->   from sbtest2 a left join
    ->   sbtest1 b using (real_id)
    ->   where b.id is null);
Empty set (1.60 sec)

Why is this faster? The first query is performing two subqueries. Each subquery is very similar. Let’s check the explain plan:

mysql> explain select "sbtest1",a.k,a.c,a.pad from
    -> sbtest1 a left join
    -> sbtest2 b using (real_id)
    -> where b.id is null;
+----+-------------+-------+------------+------+---------------+---------+---------+------------------+--------+----------+--------------------------------------+
| id | select_type | table | partitions | type | possible_keys | key     | key_len | ref              | rows   | filtered | Extra                                |
+----+-------------+-------+------------+------+---------------+---------+---------+------------------+--------+----------+--------------------------------------+
|  1 | SIMPLE      | a     | NULL       | ALL  | NULL          | NULL    | NULL    | NULL             | 315369 |   100.00 | NULL                                 |
|  1 | SIMPLE      | b     | NULL       | ref  | real_id       | real_id | 17      | sbtest.a.real_id |     27 |    10.00 | Using where; Not exists; Using index |
+----+-------------+-------+------------+------+---------------+---------+---------+------------------+--------+----------+--------------------------------------+

As you can see, it is performing a full table scan over the first table and using real_id to join the second table. The real_id is a generated column, so it needs to execute the function to get the value to join the second table. That means that it’s going to take time.

If we analyze the subquery of the second query:

mysql> explain select "sbtest1",a.k,a.c,a.pad
    -> from sbtest1 a
    -> where a.id in (select a.id
    ->   from sbtest1 a left join
    ->   sbtest2 b using (real_id)
    ->   where b.id is null);
+----+--------------+-------------+------------+--------+---------------+------------+---------+------------------+--------+----------+--------------------------------------+
| id | select_type  | table       | partitions | type   | possible_keys | key        | key_len | ref              | rows   | filtered | Extra                                |
+----+--------------+-------------+------------+--------+---------------+------------+---------+------------------+--------+----------+--------------------------------------+
|  1 | SIMPLE       | a           | NULL       | index  | PRIMARY       | k          | 187     | NULL             | 315369 |   100.00 | Using where; Using index             |
|  1 | SIMPLE       | <subquery2> | NULL       | eq_ref | <auto_key>    | <auto_key> | 4       | sbtest.a.id      |      1 |   100.00 | NULL                                 |
|  2 | MATERIALIZED | a           | NULL       | index  | PRIMARY       | real_id    | 17      | NULL             | 315369 |   100.00 | Using index                          |
|  2 | MATERIALIZED | b           | NULL       | ref    | real_id       | real_id    | 17      | sbtest.a.real_id |     27 |    10.00 | Using where; Not exists; Using index |
+----+--------------+-------------+------------+--------+---------------+------------+---------+------------------+--------+----------+--------------------------------------+

We are going to see that it is performing a full index scan over the first table, and that the generated column has never been executed. That is how we can go from an inconsistent result of three seconds, to a consistent result of 2.31 seconds, to finally reach a performant query using the faster time of 1.60 seconds.

Conclusions

This is not the first blog post that I’ve done about generated columns. I think that it is a useful feature for several scenarios where you need to improve performance. In this particular case, it’s also presenting a workaround to expected inconsistencies with LEFT JOINS with NULL values. It is also important to mention that this improved a process in a real world scenario.

The post Finding Table Differences on Nullable Columns Using MySQL Generated Columns appeared first on Percona Database Performance Blog.

MySQL : InnoDB Transparent Tablespace Encryption

$
0
0

From MySQL 5.7.11, encryption is supported for InnoDB (file-per-table) tablespaces. This is called Transparent Tablespace Encryption or sometimes referred as Encryption at Rest. This blog post aims to give the internal details of InnoDB Tablespace Encryption.

Keyring Plugin : Why What How ?

MySQL Meetup in Dubai

$
0
0

We are happy to announce that there will be a MySQL Day/MySQL Community Meetup hold in Oracle Buliding in Dubai on October 17th. Please find more details below:

  • Date: Wednesday, October 17, 2018
  • Time: 6pm 
  • Address: Oracle Office Bulding #6, Dubai, Internet City 
  • Meeting room: will be confirmed soon.
  • Agenda: 
    • "Oracle MySQL 8 - The next big thing!" by Carsten Thalheimer the Master Principal Sales Consultant
    • Discussion & pizza
  • More information & Registration

Setting up MySQL Group Replication with MySQL Docker images

$
0
0

MySQL Group Replication (GR) is a MySQL Server plugin that enables you to create elastic, highly-available, fault-tolerant replication topologies. Groups can operate in a
single-primary mode with automatic primary election, where only one server accepts updates at a time. Alternatively, groups can be deployed in multi-primary mode, where all servers can accept updates, even if they are issued concurrently.…

The Importance of mysqlbinlog –version

$
0
0
Importance of MySQL binlog version

Importance of MySQL binlog versionWhen deciding on your backup strategy, one of the key components for Point In Time Recovery (PITR) will be the binary logs. Thankfully, the mysqlbinlog command allows you to easily take binary log backups, including those that would otherwise be encrypted on disk using encrypt_binlog=ON.

When

mysqlbinlog
  is used with
--raw --read-from-remote-server --stop-never --verify-binlog-checksum
  then it will retrieve binary logs from whichever master it is pointed to, and store them locally on disk in the same format as they were written on the master. Here is an example with the extra arguments that would normally be used:
/usr/bin/mysqlbinlog --raw --read-from-remote-server \
 --stop-never --connection-server-id=1234 \
 --verify-binlog-checksum \
 --host=localhost --port=3306 mysql-bin.000024

This would retrieve the localhost binary logs (starting from mysql-bin.000024) reporting as server_id 1234, verify the checksum and then write each of them to disk.

Changes to the mysqlbinlog source code are relatively infrequent, except for when developing for a new major version, so you may be fooled into thinking that the specific version that you use is not so important—a little like the client version. This is something that is more likely to vary when you are taking remote backups.

Here is the result from the 5.7 branch of mysql-server to show the history of commits by year:

$ git blame --line-porcelain client/mysqlbinlog.cc | egrep "^(committer-time|committer-tz)" | cut -f2 -d' ' | while read ct; do read ctz; date --date "Jan 1, 1970 00:00:00 ${ctz} + ${ct} seconds" --utc +%Y; done | sort -n | uniq -c
   105 2000
    52 2001
    52 2002
   103 2003
   390 2004
   113 2005
    58 2006
   129 2007
   595 2008
    53 2009
   349 2010
   151 2011
   382 2012
   191 2013
   308 2014
   404 2015
    27 2016
    42 2017
    15 2018

Since the first GA release of 5.7 (October 2015), there haven’t been too many bugs and so if you aren’t using new features then you may think that it is OK to keep using the same version as before:

$ git log --regexp-ignore-case --grep bug --since="2015-10-19" --oneline client/mysqlbinlog.cc
1ffd7965a5e Bug#27558169 BACKPORT TO 5.7 BUG #26826272: REMOVE GCC 8 WARNINGS [noclose]
17c92835bb3 Bug #24674276 MYSQLBINLOG -R --HEXDUMP CRASHES FOR INTVAR,                   USER_VAR, OR RAND EVENTS
052dbd7b079 BUG#26878022 MYSQLBINLOG: ASSERTION `(OLD_MH->M_KEY == KEY) ||              (OLD_MH->M_KEY == 0)' FAILED
543129a577c BUG#26878022 MYSQLBINLOG: ASSERTION `(OLD_MH->M_KEY == KEY) || (OLD_MH->M_KEY == 0)' FAILED
ba1a99c5cd7 Bug#26825211 BACKPORT FIX FOR #25643811 TO 5.7
1f0f4476b28 Bug#26117735: MYSQLBINLOG READ-FROM-REMOTE-SERVER NOT HONORING REWRITE_DB FILTERING
12508f21b63 Bug #24323288: MAIN.MYSQLBINLOG_DEBUG FAILS WITH A LEAKSANITIZER ERROR
e8e5ddbb707 Bug#24609402 MYSQLBINLOG --RAW DOES NOT GET ALL LATEST EVENTS
22eec68941f Bug#23540182:MYSQLBINLOG DOES NOT FREE THE EXISTING CONNECTION BEFORE OPENING NEW REMOTE ONE
567bb732bc0 Bug#22932576 MYSQL5.6 DOES NOT BUILD ON SOLARIS12
efc42d99469 Bug#22932576 MYSQL5.6 DOES NOT BUILD ON SOLARIS12
6772eb52d66 Bug#21697461 MEMORY LEAK IN MYSQLBINLOG

However, this is not always the case and some issues are more obvious than others! To help show this, here are a couple of the issues that you might happen to notice.

Warning: option ‘stop-never-slave-server-id’: unsigned value <xxxxxxxx> adjusted to <yyyyy>

The server_id that is used by a server in a replication topology should always be unique within the topology. One of the easy ways to ensure this is to use a conversion of the external IPv4 address to an integer, such as INET_ATON , which provides you with an unsigned integer.

The introduction of

--connection-server-id
 (which deprecates

--stop-never-slave-server-id
 ) changes the behaviour here (for the better). Prior to this you may experience warnings where your server_id was cast to the equivalent of an UNSIGNED SMALLINT. This didn’t seem to be a reported bug, just fixed as a by-product of the change.

ERROR: Could not find server version: Master reported unrecognized MySQL version ‘xxx’

When running mysqlbinlog, the version of MySQL is checked so that the event format is set correctly. Here is the code from MySQL 5.7:

switch (*version) {
 case '3':
   glob_description_event= new Format_description_log_event(1);
   break;
 case '4':
   glob_description_event= new Format_description_log_event(3);
   break;
 case '5':
   /*
     The server is soon going to send us its Format_description log
     event, unless it is a 5.0 server with 3.23 or 4.0 binlogs.
     So we first assume that this is 4.0 (which is enough to read the
     Format_desc event if one comes).
   */
   glob_description_event= new Format_description_log_event(3);
   break;
 default:
   glob_description_event= NULL;
   error("Could not find server version: "
         "Master reported unrecognized MySQL version '%s'.", version);
   goto err;
 }

This section of the code last changed in 2008, but of course there is another vendor that no longer uses a 5-prefixed-version number: MariaDB. With MariaDB, it is impossible to take a backup without using a MariaDB version of the program, as you are told that the version is unrecognised. The MariaDB source code contains a change to this section to resolve the issue when the version was bumped to 10:

83c02f32375b client/mysqlbinlog.cc (Michael Widenius    2012-05-31 22:39:11 +0300 1900) case 5:
83c02f32375b client/mysqlbinlog.cc (Michael Widenius    2012-05-31 22:39:11 +0300 1901) case 10:

Interestingly, MySQL 8.0 gets a little closer to not producing an error (although it still does), but finally sees off those rather old ancestral relatives:

 switch (*version) {
   case '5':
   case '8':
   case '9':
     /*
       The server is soon going to send us its Format_description log
       event.
     */
     glob_description_event = new Format_description_log_event;
     break;
   default:
     glob_description_event = NULL;
     error(
         "Could not find server version: "
         "Master reported unrecognized MySQL version '%s'.",
         version);
     goto err;
 }

These are somewhat trivial examples. In fact, you are more likely to suffer from more serious differences, perhaps ones that do not become immediately apparent, if you are not matching the mysqlbinlog version to the one provided by the version for the server producing the binary logs.

Sadly, it is not so easy to check the versions as the reported version was seemingly left unloved for quite a while (Ver 3.4), so you should check the binary package versions (e.g. using Percona-Server-client-57-5.7.23 with Percona-Server-server-57-5.7.23). Thankfully, the good news is that MySQL 8.0 fixes it!

So reduce the risk and match your package versions!

The post The Importance of mysqlbinlog –version appeared first on Percona Database Performance Blog.


Master-Slave Replication with MySQL 8.0 in 2 mins

$
0
0

There are multiple way to setup replication with MySQL 8.0 and our replication offer as never been so rich: asynchronous, semi-synchronous, group replication, multi-source, … and much more options !

But if you want to setup a very quick Master-Slave environment from scratch for a quick test (you can always use dbdeployer), here are some commands to make it right the first time 😉

Requirements

You need to have MySQL 8.0 installed and running on both servers and with the same initial data (a fresh install for example). Here we use mysql1 and mysql2. We will also use GTID as it’s much more convenient.

Servers Configuration

Let’s setup mysql1 first:

mysql1> SET PERSIST server_id=1; 
mysql1> SET PERSIST_ONLY gtid_mode=ON; 
mysql1> SET PERSIST_ONLY enforce_gtid_consistency=true; 
mysql1> RESTART;

And now mysql2:

mysql2> SET PERSIST server_id=2; 
mysql2> SET PERSIST_ONLY gtid_mode=ON; 
mysql2> SET PERSIST_ONLY enforce_gtid_consistency=true; 
mysql2> RESTART;

Replication User

On mysql1 that will act as master we do:

mysql1> CREATE USER 'repl'@'%' IDENTIFIED BY 'password' REQUIRE SSL; 
mysql1> GRANT REPLICATION SLAVE ON *.* TO 'repl'@'%';

Starting the Slave

And on mysql2, we just configure and start replication:

mysql2> CHANGE MASTER TO MASTER_HOST='mysql1', 
        MASTER_PORT=3306, MASTER_USER='repl', 
        MASTER_PASSWORD='password', MASTER_AUTO_POSITION=1, MASTER_SSL=1;
mysql2> START SLAVE;

Done !

Very easy, and of course don’t forget to check the manual for much more options !

Shinguz: MariaDB/MySQL Schulungstermine 2019

$
0
0

Jetzt sind auch noch die letzten MariaDB und MySQL Schulungstermine für 2019 festgelegt und veröffentlicht.

Mit unseren drei Schulungspartnern in Essen, Köln und Berlin bietet FromDual zur Zeit insgesamt 12 öffentliche Schulungen zum Thema MariaDB und MySQL an.

Es sind dies:


Diese Schulungen finden in deutsch statt. Auf Wunsch können auch Schulungen in englisch angeboten werden.

Was bleibt übrig für 2018?

Noch im Jahr 2018 werden 5 weitere Schulungen durchgeführt. Diese finden alle sicher statt!

Es sind dies:


In diesen Schulungen sind noch vereinzelt Plätze frei. Habt Ihr Eure MariaDB/MySQL Schulung für 2018 schon bezogen?

Bei Fragen zu den MariaDB oder MySQL Schulungen hilft Euch das FromDual Schulungsteam gerne weiter!

Replication Monitoring with the Performance Schema

$
0
0

The traditional way to monitor replication in MySQL is the SHOW SLAVE STATUS command. However as it will be shown, it has its limitations and in MySQL 5.7 and 8.0 the MySQL developers have started to implement the information as Performance Schema tables. This has several advantages including better monitoring of the replication delay in MySQL 8.0. This blog discusses why SHOW SLAVE STATUS should be replaced with the Performance Schema tables.

The Setup

The replication setup that will be used for the examples in this blog can be seen in the following figure.

Replication Setup with Multi-Source and Chained Replication

There are two source instances (replication masters). Source 1 replicates to the Relay instance (i.e. it acts both as a replica and source in the setup). The Relay instance replicates to the Replica instance which also replicates from Source 2. That is, the Replica instance uses multi-source replication to replicate from the Source 1Relay chain as well as directly from Source 2.

This blog will use the Replica instance to demonstrate SHOW SLAVE STATUS and Performance Schema replication tables.

SHOW SLAVE STATUS

The SHOW SLAVE STATUS command has been around since the addition of replication to MySQL. Thus it is familiar to all database administrators who have been working with replication. It is also very simple to use, and it is easy to remember the syntax. So far so good. However, it also has some limitations.

Let’s take a look at how the output of SHOW SLAVE STATUS looks in the setup described above:

*************************** 1. row ***************************
               Slave_IO_State: Waiting for master to send event
                  Master_Host: 127.0.0.1
                  Master_User: replication
                  Master_Port: 3308
                Connect_Retry: 60
              Master_Log_File: binlog.000001
          Read_Master_Log_Pos: 61422958
               Relay_Log_File: relaylog-relay.000005
                Relay_Log_Pos: 59921651
        Relay_Master_Log_File: binlog.000001
             Slave_IO_Running: Yes
            Slave_SQL_Running: Yes
              Replicate_Do_DB: 
          Replicate_Ignore_DB: 
           Replicate_Do_Table: 
       Replicate_Ignore_Table: 
      Replicate_Wild_Do_Table: 
  Replicate_Wild_Ignore_Table: sakila.%
                   Last_Errno: 0
                   Last_Error: 
                 Skip_Counter: 0
          Exec_Master_Log_Pos: 59921443
              Relay_Log_Space: 61423581
              Until_Condition: None
               Until_Log_File: 
                Until_Log_Pos: 0
           Master_SSL_Allowed: Yes
           Master_SSL_CA_File: 
           Master_SSL_CA_Path: 
              Master_SSL_Cert: 
            Master_SSL_Cipher: 
               Master_SSL_Key: 
        Seconds_Behind_Master: 49
Master_SSL_Verify_Server_Cert: No
                Last_IO_Errno: 0
                Last_IO_Error: 
               Last_SQL_Errno: 0
               Last_SQL_Error: 
  Replicate_Ignore_Server_Ids: 
             Master_Server_Id: 11
                  Master_UUID: 7616e9d1-c868-11e8-92f0-080027effed8
             Master_Info_File: mysql.slave_master_info
                    SQL_Delay: 0
          SQL_Remaining_Delay: NULL
      Slave_SQL_Running_State: Slave has read all relay log; waiting for more updates
           Master_Retry_Count: 86400
                  Master_Bind: 
      Last_IO_Error_Timestamp: 
     Last_SQL_Error_Timestamp: 
               Master_SSL_Crl: 
           Master_SSL_Crlpath: 
           Retrieved_Gtid_Set: 81c777c0-c86f-11e8-9031-080027effed8:28-81
            Executed_Gtid_Set: 2165e6e2-c870-11e8-8818-080027effed8:1-39,
81c777c0-c86f-11e8-9031-080027effed8:1-80
                Auto_Position: 1
         Replicate_Rewrite_DB: 
                 Channel_Name: relay
           Master_TLS_Version: 
       Master_public_key_path: 
        Get_master_public_key: 0
*************************** 2. row ***************************
               Slave_IO_State: Waiting for master to send event
                  Master_Host: 127.0.0.1
                  Master_User: replication
                  Master_Port: 3307
                Connect_Retry: 60
              Master_Log_File: binlog.000002
          Read_Master_Log_Pos: 366288
               Relay_Log_File: relaylog-source_2.000005
                Relay_Log_Pos: 181612
        Relay_Master_Log_File: binlog.000002
             Slave_IO_Running: Yes
            Slave_SQL_Running: Yes
              Replicate_Do_DB: 
          Replicate_Ignore_DB: 
           Replicate_Do_Table: 
       Replicate_Ignore_Table: 
      Replicate_Wild_Do_Table: 
  Replicate_Wild_Ignore_Table: sakila.%
                   Last_Errno: 0
                   Last_Error: 
                 Skip_Counter: 0
          Exec_Master_Log_Pos: 366288
              Relay_Log_Space: 182074
              Until_Condition: None
               Until_Log_File: 
                Until_Log_Pos: 0
           Master_SSL_Allowed: Yes
           Master_SSL_CA_File: 
           Master_SSL_CA_Path: 
              Master_SSL_Cert: 
            Master_SSL_Cipher: 
               Master_SSL_Key: 
        Seconds_Behind_Master: 0
Master_SSL_Verify_Server_Cert: No
                Last_IO_Errno: 0
                Last_IO_Error: 
               Last_SQL_Errno: 0
               Last_SQL_Error: 
  Replicate_Ignore_Server_Ids: 
             Master_Server_Id: 2
                  Master_UUID: 2165e6e2-c870-11e8-8818-080027effed8
             Master_Info_File: mysql.slave_master_info
                    SQL_Delay: 0
          SQL_Remaining_Delay: NULL
      Slave_SQL_Running_State: Slave has read all relay log; waiting for more updates
           Master_Retry_Count: 86400
                  Master_Bind: 
      Last_IO_Error_Timestamp: 
     Last_SQL_Error_Timestamp: 
               Master_SSL_Crl: 
           Master_SSL_Crlpath: 
           Retrieved_Gtid_Set: 2165e6e2-c870-11e8-8818-080027effed8:28-39
            Executed_Gtid_Set: 2165e6e2-c870-11e8-8818-080027effed8:1-39,
81c777c0-c86f-11e8-9031-080027effed8:1-80
                Auto_Position: 1
         Replicate_Rewrite_DB: 
                 Channel_Name: source_2
           Master_TLS_Version: 
       Master_public_key_path: 
        Get_master_public_key: 0
2 rows in set (0.22 sec)

The first thought: that’s a lot of lines of output. That is one of the issues – there is no way to limit the output. So summarize some of the issues with SHOW SLAVE STATUS:

  • There is no support for filter conditions or choosing which columns to include, so the output is very verbose. In this case with two replication channels, all available data for both channels are always included.
  • The order of the columns reflects the order they were added rather than how they logically belong together. Over the years many new columns have been added as new features have been added or the feature has been changed from an option configured in my.cnf to an option configured with CHANGE MASTER TO. For example the channel name is the fourth column from the end even if it would be more natural to have it as the first column (as it’s it the “primary key” of the output).
  • For multi-threaded appliers (replication_slave_workers > 1) there is no information for the individual workers.
  • Information related to the connection (I/O thread) and applier (SQL thread) as well configuration and status are mixed.
  • What does Seconds_behind_master mean? For the source_2 channel (the direct replication from Source 2 it is relatively easy to understand, but for the relay channel is it relative to Source 1 (yes) or to Replica (no)? More about this later.

To look at what can be done to solve these limitations, let’s look at the Performance Schema.

Performance Schema Replication Tables

To overcome these limitations, MySQL 5.7 introduced a series of replication tables in the Performance Schema. These have been extended in MySQL 8.0 to make them even more useful. One of the advantages of using the Performance Schema is that queries are executed as regular SELECT statements with the usual support for choosing columns and manipulating them and to apply a WHERE clause. First, let’s take a look at which replication related tables that are available.

Overview of Tables

As of MySQL 8.0.12 there are 11 replication related tables. The tables are:

  • log_status: This table is new in MySQL 8 and provides information about the binary log, relay log, and InnoDB redo log in a consistent manner (i.e. all values are for the same point in time).
  • Applier:
    • replication_applier_configuration: This table shows the configuration of the applier threads for each replication channel. Currently the only setting is the configured replication delay.
    • replication_applier_filters: The channel specific replication filters including where and when they were configured.
    • replication_applier_global_filters: The global replication filters including how and when they were configured.
    • replication_applier_status: This table shows the replication filters for each replication channel. The information includes the service state, remaining delay, and number of transaction retries.
    • replication_applier_status_by_coordinator: For multi-threaded replicas this table shows the status of the thread that manages the actual worker threads. In MySQL 8 this includes several timestamps to give detailed knowledge of the replication delay.
    • replication_applier_status_by_worker: The status of each worker thread (for single-threaded replication there is one per channel). In MySQL 8 this includes several timestamps to give detailed knowledge of the replication delay.
  • Connection:
    • replication_connection_configuration: The configuration of each of the replication channels.
    • replication_connection_status: The status of the replication channels. In MySQL 8 this includes information about the timestamps showing when the currently queuing transaction was originally committed, when it was committed on the immediate source instance, and when it was written to the relay log. This makes it possible to describe much more accurately what the replication delay is.
  • Group Replication:

The Group Replication tables will not be discussed further.

Since the information from SHOW SLAVE STATUS has been split up into several tables, it can be useful to take a look at how the information map.

Old Versus New

The following table shows how to get from a column in the SHOW SLAVE STATUS output to a table and column in the Performance Schema. The channel name is present in all of the Performance Schema replication tables (it’s the primary key or part of it). The replication filters and rewrite rules are split into two tables. The I/O and SQL thread states can be found in the performance_schema.threads by joining using the THREAD_ID column for the corresponding threads.

SHOW SLAVE STATUS Performance Schema
Column Table Column
Slave_IO_State threads PROCESSLIST_STATE
Master_Host replication_connection_configuration HOST
Master_User replication_connection_configuration USER
Master_Port replication_connection_configuration PORT
Connect_Retry replication_connection_configuration CONNECTION_RETRY_INTERVAL
Master_Log_File
Read_Master_Log_Pos
Relay_Log_File log_status REPLICATION->>'$.channels[*].relay_log_file'
Relay_Log_Pos log_status REPLICATION->>'$.channels[*].relay_log_position'
Relay_Master_Log_File
Slave_IO_Running replication_connection_status SERVICE_STATE
Slave_SQL_Running replication_applier_status_by_coordinator SERVICE_STATE
Replicate_Do_DB replication_applier_filters
replication_applier_global_filters
Replicate_Ignore_DB replication_applier_filters
replication_applier_global_filters
Replicate_Do_Table replication_applier_filters
replication_applier_global_filters
Replicate_Ignore_Table replication_applier_filters
replication_applier_global_filters
Replicate_Wild_Do_Table replication_applier_filters
replication_applier_global_filters
Replicate_Wild_Ignore_Table replication_applier_filtersreplication_applier_global_filters
Last_Errno
Last_Error
Skip_Counter
Exec_Master_Log_Pos
Relay_Log_Space
Until_Condition
Until_Log_File
Until_Log_Pos
Master_SSL_Allowed replication_connection_configuration SSL_ALLOWED
Master_SSL_CA_File replication_connection_configuration SSL_CA_FILE
Master_SSL_CA_Path replication_connection_configuration SSL_CA_PATH
Master_SSL_Cert replication_connection_configuration SSL_CERTIFICATE
Master_SSL_Cipher replication_connection_configuration SSL_CIPHER
Master_SSL_Key replication_connection_configuration SSL_KEY
Seconds_Behind_Master
Master_SSL_Verify_Server_Cert replication_connection_configuration SSL_VERIFY_SERVER_CERTIFICATE
Last_IO_Errno replication_connection_status LAST_ERROR_NUMBER
Last_IO_Error replication_connection_status LAST_ERROR_MESSAGE
Last_SQL_Errno replication_applier_status_by_worker
replication_applier_status_by_coordinator
LAST_ERROR_NUMBER
Last_SQL_Error replication_applier_status_by_worker
replication_applier_status_by_coordinator
LAST_ERROR_MESSAGE
Replicate_Ignore_Server_Ids
Master_Server_Id
Master_UUID replication_connection_status SOURCE_UUID
Master_Info_File
SQL_Delay replication_applier_configuration DESIRED_DELAY
SQL_Remaining_Delay replication_applier_status REMAINING_DELAY
Slave_SQL_Running_State threads PROCESSLIST_STATE
Master_Retry_Count replication_connection_configuration CONNECTION_RETRY_COUNT
Master_Bind replication_connection_configuration NETWORK_INTERFACE
Last_IO_Error_Timestamp replication_connection_status LAST_ERROR_TIMESTAMP
Last_SQL_Error_Timestamp replication_applier_status_by_worker
replication_applier_status_by_coordinator
LAST_ERROR_TIMESTAMP
Master_SSL_Crl replication_connection_configuration SSL_CRL_FILE
Master_SSL_Crlpath replication_connection_configuration SSL_CRL_PATH
Retrieved_Gtid_Set replication_connection_status RECEIVED_TRANSACTION_SET
Executed_Gtid_Set
Auto_Position replication_connection_configuration AUTO_POSITION
Replicate_Rewrite_DB replication_applier_filters
replication_applier_global_filters
Channel_Name
Master_TLS_Version replication_connection_configuration TLS_VERSION
Master_public_key_path replication_connection_configuration PUBLIC_KEY_PATH
Get_master_public_key replication_connection_configuration GET_PUBLIC_KEY

As it can be seen, there are a few columns from SHOW SLAVE STATUS that do not have any corresponding tables and columns in the Performance Schema yet. One that probably is familiar to many as the main mean of monitoring the replication lag is the the Seconds_Behind_Master column.  This is no longer needed. It is now possible to get a better value using the timestamp columns in the replication_applier_status_by_coordinator, replication_applier_status_by_worker, and replication_connection_status tables. Talking about that, it is time to see the Performance Schema replication tables in action.

Examples

The rest of the blog shows example outputs each of the replication tables (except the ones related to Group Replication) in the Performance Schema. For some of the tables there is a short discussion following the output. The queries have been executed in rapid succession after the above SHOW SLAVE STATUS output was generated. As the outputs have been generated using separate queries, they do not correspond to the exact same point in time.

log_status

The log_status table shows the replication and engine log data so the data is consistent:

mysql> SELECT SERVER_UUID, JSON_PRETTY(LOCAL) AS LOCAL,
              JSON_PRETTY(REPLICATION) AS REPLICATION,
              STORAGE_ENGINES
         FROM log_status\G
*************************** 1. row ***************************
    SERVER_UUID: 302f0073-c869-11e8-95bb-080027effed8
          LOCAL: {
  "gtid_executed": "2165e6e2-c870-11e8-8818-080027effed8:1-39,\n81c777c0-c86f-11e8-9031-080027effed8:1-80",
  "binary_log_file": "binlog.000002",
  "binary_log_position": 60102708
}
    REPLICATION: {
  "channels": [
    {
      "channel_name": "relay",
      "relay_log_file": "relaylog-relay.000005",
      "relay_log_position": 61423166
    },
    {
      "channel_name": "source_2",
      "relay_log_file": "relaylog-source_2.000005",
      "relay_log_position": 181612
    }
  ]
}
STORAGE_ENGINES: {"InnoDB": {"LSN": 120287720, "LSN_checkpoint": 118919036}}
1 row in set (0.03 sec)

replication_applier_configuration

The replication_applier_configuration table shows the configuration of the applier threads:

mysql> SELECT * FROM replication_applier_configuration;
+--------------+---------------+
| CHANNEL_NAME | DESIRED_DELAY |
+--------------+---------------+
| relay        |             0 |
| source_2     |             0 |
+--------------+---------------+
2 rows in set (0.04 sec)

replication_applier_filters

The replication_applier_filters table shows the channel specific replication filters:

mysql> SELECT * FROM replication_applier_filters\G
*************************** 1. row ***************************
 CHANNEL_NAME: relay
  FILTER_NAME: REPLICATE_WILD_IGNORE_TABLE
  FILTER_RULE: world.%
CONFIGURED_BY: STARTUP_OPTIONS_FOR_CHANNEL
 ACTIVE_SINCE: 2018-10-05 20:49:48.185078
      COUNTER: 0
1 rows in set (0.18 sec)

There is one filter specifically for the relay channel: the channel will ignore changes to tables in the world schema and the filter was set using the the replicate_wild_ignore_table option in the MySQL configuration file.

replication_applier_global_filters

The replication_applier_global_filters table shows the replication filters that are shared for all channels:

mysql> SELECT * FROM replication_applier_global_filters\G
*************************** 1. row ***************************
  FILTER_NAME: REPLICATE_WILD_IGNORE_TABLE
  FILTER_RULE: sakila.%
CONFIGURED_BY: CHANGE_REPLICATION_FILTER
 ACTIVE_SINCE: 2018-10-05 20:48:54.341004
1 row in set (0.02 sec)

There is also one global replication filter. This has been set using the CHANGE REPLICATION FILTER statement.

replication_applier_status

The replication_applier_status table shows the overall status for the applier threads:

mysql> SELECT * FROM replication_applier_status;
+--------------+---------------+-----------------+----------------------------+
| CHANNEL_NAME | SERVICE_STATE | REMAINING_DELAY | COUNT_TRANSACTIONS_RETRIES |
+--------------+---------------+-----------------+----------------------------+
| relay        | ON            |            NULL |                          0 |
| source_2     | ON            |            NULL |                          0 |
+--------------+---------------+-----------------+----------------------------+
2 rows in set (0.05 sec)

replication_applier_status_by_coordinator

The replication_applier_status_by_coordinator table shows the status for the coordinator when multi-threaded appliers has been configured (slave_parallel_workers > 1):

mysql> SELECT * FROM replication_applier_status_by_coordinator\G
*************************** 1. row ***************************
                                         CHANNEL_NAME: relay
                                            THREAD_ID: 55
                                        SERVICE_STATE: ON
                                    LAST_ERROR_NUMBER: 0
                                   LAST_ERROR_MESSAGE: 
                                 LAST_ERROR_TIMESTAMP: 0000-00-00 00:00:00.000000
                           LAST_PROCESSED_TRANSACTION: 81c777c0-c86f-11e8-9031-080027effed8:81
 LAST_PROCESSED_TRANSACTION_ORIGINAL_COMMIT_TIMESTAMP: 2018-10-05 21:07:52.286116
LAST_PROCESSED_TRANSACTION_IMMEDIATE_COMMIT_TIMESTAMP: 2018-10-05 21:08:10.692561
    LAST_PROCESSED_TRANSACTION_START_BUFFER_TIMESTAMP: 2018-10-05 21:08:10.843893
      LAST_PROCESSED_TRANSACTION_END_BUFFER_TIMESTAMP: 2018-10-05 21:08:11.142150
                               PROCESSING_TRANSACTION: 
     PROCESSING_TRANSACTION_ORIGINAL_COMMIT_TIMESTAMP: 0000-00-00 00:00:00.000000
    PROCESSING_TRANSACTION_IMMEDIATE_COMMIT_TIMESTAMP: 0000-00-00 00:00:00.000000
        PROCESSING_TRANSACTION_START_BUFFER_TIMESTAMP: 0000-00-00 00:00:00.000000
*************************** 2. row ***************************
                                         CHANNEL_NAME: source_2
                                            THREAD_ID: 59
                                        SERVICE_STATE: ON
                                    LAST_ERROR_NUMBER: 0
                                   LAST_ERROR_MESSAGE: 
                                 LAST_ERROR_TIMESTAMP: 0000-00-00 00:00:00.000000
                           LAST_PROCESSED_TRANSACTION: 2165e6e2-c870-11e8-8818-080027effed8:39
 LAST_PROCESSED_TRANSACTION_ORIGINAL_COMMIT_TIMESTAMP: 2018-10-05 20:52:12.422129
LAST_PROCESSED_TRANSACTION_IMMEDIATE_COMMIT_TIMESTAMP: 2018-10-05 20:52:12.422129
    LAST_PROCESSED_TRANSACTION_START_BUFFER_TIMESTAMP: 2018-10-05 20:52:13.010969
      LAST_PROCESSED_TRANSACTION_END_BUFFER_TIMESTAMP: 2018-10-05 20:52:13.519174
                               PROCESSING_TRANSACTION: 
     PROCESSING_TRANSACTION_ORIGINAL_COMMIT_TIMESTAMP: 0000-00-00 00:00:00.000000
    PROCESSING_TRANSACTION_IMMEDIATE_COMMIT_TIMESTAMP: 0000-00-00 00:00:00.000000
        PROCESSING_TRANSACTION_START_BUFFER_TIMESTAMP: 0000-00-00 00:00:00.000000
2 rows in set (0.06 sec)

This is an example of MySQL 8 has detailed information about the timings were for the various stages of the applied events. For example for the relay channel, it can be seen that for the last processed transaction, it took 18 seconds from the transaction was committed on Source 1 (original commit) until it was committed on Relay (immediate commit), but then it only took around half a second until the coordinate was done processing the transaction (i.e. sending it to a worker). Which brings us to the status by worker.

replication_applier_status_by_worker

The replication_applier_status_by_worker table shows the status for each worker thread:

mysql> SELECT * FROM replication_applier_status_by_worker\G
*************************** 1. row ***************************
                                       CHANNEL_NAME: relay
                                          WORKER_ID: 1
                                          THREAD_ID: 56
                                      SERVICE_STATE: ON
                                  LAST_ERROR_NUMBER: 0
                                 LAST_ERROR_MESSAGE: 
                               LAST_ERROR_TIMESTAMP: 0000-00-00 00:00:00.000000
                           LAST_APPLIED_TRANSACTION: 81c777c0-c86f-11e8-9031-080027effed8:80
 LAST_APPLIED_TRANSACTION_ORIGINAL_COMMIT_TIMESTAMP: 2018-10-05 21:07:27.721738
LAST_APPLIED_TRANSACTION_IMMEDIATE_COMMIT_TIMESTAMP: 2018-10-05 21:07:50.387138
     LAST_APPLIED_TRANSACTION_START_APPLY_TIMESTAMP: 2018-10-05 21:07:50.526808
       LAST_APPLIED_TRANSACTION_END_APPLY_TIMESTAMP: 2018-10-05 21:08:09.296713
                               APPLYING_TRANSACTION: 81c777c0-c86f-11e8-9031-080027effed8:81
     APPLYING_TRANSACTION_ORIGINAL_COMMIT_TIMESTAMP: 2018-10-05 21:07:52.286116
    APPLYING_TRANSACTION_IMMEDIATE_COMMIT_TIMESTAMP: 2018-10-05 21:08:10.692561
         APPLYING_TRANSACTION_START_APPLY_TIMESTAMP: 2018-10-05 21:08:10.855825
*************************** 2. row ***************************
                                       CHANNEL_NAME: relay
                                          WORKER_ID: 2
                                          THREAD_ID: 57
                                      SERVICE_STATE: ON
                                  LAST_ERROR_NUMBER: 0
                                 LAST_ERROR_MESSAGE: 
                               LAST_ERROR_TIMESTAMP: 0000-00-00 00:00:00.000000
                           LAST_APPLIED_TRANSACTION: 
 LAST_APPLIED_TRANSACTION_ORIGINAL_COMMIT_TIMESTAMP: 0000-00-00 00:00:00.000000
LAST_APPLIED_TRANSACTION_IMMEDIATE_COMMIT_TIMESTAMP: 0000-00-00 00:00:00.000000
     LAST_APPLIED_TRANSACTION_START_APPLY_TIMESTAMP: 0000-00-00 00:00:00.000000
       LAST_APPLIED_TRANSACTION_END_APPLY_TIMESTAMP: 0000-00-00 00:00:00.000000
                               APPLYING_TRANSACTION: 
     APPLYING_TRANSACTION_ORIGINAL_COMMIT_TIMESTAMP: 0000-00-00 00:00:00.000000
    APPLYING_TRANSACTION_IMMEDIATE_COMMIT_TIMESTAMP: 0000-00-00 00:00:00.000000
         APPLYING_TRANSACTION_START_APPLY_TIMESTAMP: 0000-00-00 00:00:00.000000
*************************** 3. row ***************************
                                       CHANNEL_NAME: source_2
                                          WORKER_ID: 1
                                          THREAD_ID: 60
                                      SERVICE_STATE: ON
                                  LAST_ERROR_NUMBER: 0
                                 LAST_ERROR_MESSAGE: 
                               LAST_ERROR_TIMESTAMP: 0000-00-00 00:00:00.000000
                           LAST_APPLIED_TRANSACTION: 2165e6e2-c870-11e8-8818-080027effed8:39
 LAST_APPLIED_TRANSACTION_ORIGINAL_COMMIT_TIMESTAMP: 2018-10-05 20:52:12.422129
LAST_APPLIED_TRANSACTION_IMMEDIATE_COMMIT_TIMESTAMP: 2018-10-05 20:52:12.422129
     LAST_APPLIED_TRANSACTION_START_APPLY_TIMESTAMP: 2018-10-05 20:52:13.520916
       LAST_APPLIED_TRANSACTION_END_APPLY_TIMESTAMP: 2018-10-05 20:52:14.302957
                               APPLYING_TRANSACTION: 
     APPLYING_TRANSACTION_ORIGINAL_COMMIT_TIMESTAMP: 0000-00-00 00:00:00.000000
    APPLYING_TRANSACTION_IMMEDIATE_COMMIT_TIMESTAMP: 0000-00-00 00:00:00.000000
         APPLYING_TRANSACTION_START_APPLY_TIMESTAMP: 0000-00-00 00:00:00.000000
*************************** 4. row ***************************
                                       CHANNEL_NAME: source_2
                                          WORKER_ID: 2
                                          THREAD_ID: 61
                                      SERVICE_STATE: ON
                                  LAST_ERROR_NUMBER: 0
                                 LAST_ERROR_MESSAGE: 
                               LAST_ERROR_TIMESTAMP: 0000-00-00 00:00:00.000000
                           LAST_APPLIED_TRANSACTION: 
 LAST_APPLIED_TRANSACTION_ORIGINAL_COMMIT_TIMESTAMP: 0000-00-00 00:00:00.000000
LAST_APPLIED_TRANSACTION_IMMEDIATE_COMMIT_TIMESTAMP: 0000-00-00 00:00:00.000000
     LAST_APPLIED_TRANSACTION_START_APPLY_TIMESTAMP: 0000-00-00 00:00:00.000000
       LAST_APPLIED_TRANSACTION_END_APPLY_TIMESTAMP: 0000-00-00 00:00:00.000000
                               APPLYING_TRANSACTION: 
     APPLYING_TRANSACTION_ORIGINAL_COMMIT_TIMESTAMP: 0000-00-00 00:00:00.000000
    APPLYING_TRANSACTION_IMMEDIATE_COMMIT_TIMESTAMP: 0000-00-00 00:00:00.000000
         APPLYING_TRANSACTION_START_APPLY_TIMESTAMP: 0000-00-00 00:00:00.000000
4 rows in set (0.16 sec)

The timestamps for the relay channel’s workers (only one has been active as it can be seen) can be used to see that the last transaction took around 19 seconds to apply and it was committed also 19 seconds after it committed on the immediate source (the Relay instance).

You can compare this delay of 19 seconds with the 49 seconds claimed by Seconds_Behind_Master in the SHOW SLAVE STATUS output. Why the difference? Seconds_Behind_Master is really the time from the original source started to execute the current transaction until now. So that includes the time it took to execute the transaction not only on Source 1 but also on Relay and the time used until now on Replica.

replication_connection_configuration

The replication_connection_configuration table shows the configuration for each connection to the source of the replication:

mysql> SELECT * FROM replication_connection_configuration\G
*************************** 1. row ***************************
                 CHANNEL_NAME: relay
                         HOST: 127.0.0.1
                         PORT: 3308
                         USER: replication
            NETWORK_INTERFACE: 
                AUTO_POSITION: 1
                  SSL_ALLOWED: YES
                  SSL_CA_FILE: 
                  SSL_CA_PATH: 
              SSL_CERTIFICATE: 
                   SSL_CIPHER: 
                      SSL_KEY: 
SSL_VERIFY_SERVER_CERTIFICATE: NO
                 SSL_CRL_FILE: 
                 SSL_CRL_PATH: 
    CONNECTION_RETRY_INTERVAL: 60
       CONNECTION_RETRY_COUNT: 86400
           HEARTBEAT_INTERVAL: 30.000
                  TLS_VERSION: 
              PUBLIC_KEY_PATH: 
               GET_PUBLIC_KEY: NO
*************************** 2. row ***************************
                 CHANNEL_NAME: source_2
                         HOST: 127.0.0.1
                         PORT: 3307
                         USER: replication
            NETWORK_INTERFACE: 
                AUTO_POSITION: 1
                  SSL_ALLOWED: YES
                  SSL_CA_FILE: 
                  SSL_CA_PATH: 
              SSL_CERTIFICATE: 
                   SSL_CIPHER: 
                      SSL_KEY: 
SSL_VERIFY_SERVER_CERTIFICATE: NO
                 SSL_CRL_FILE: 
                 SSL_CRL_PATH: 
    CONNECTION_RETRY_INTERVAL: 60
       CONNECTION_RETRY_COUNT: 86400
           HEARTBEAT_INTERVAL: 30.000
                  TLS_VERSION: 
              PUBLIC_KEY_PATH: 
               GET_PUBLIC_KEY: NO
2 rows in set (0.01 sec)

replication_connection_status

The replication_connection_status table shows the status of each connection:

mysql> SELECT * FROM replication_connection_status\G
*************************** 1. row ***************************
                                      CHANNEL_NAME: relay
                                        GROUP_NAME: 
                                       SOURCE_UUID: 7616e9d1-c868-11e8-92f0-080027effed8
                                         THREAD_ID: 54
                                     SERVICE_STATE: ON
                         COUNT_RECEIVED_HEARTBEATS: 28
                          LAST_HEARTBEAT_TIMESTAMP: 2018-10-05 21:03:49.684895
                          RECEIVED_TRANSACTION_SET: 81c777c0-c86f-11e8-9031-080027effed8:28-81
                                 LAST_ERROR_NUMBER: 0
                                LAST_ERROR_MESSAGE: 
                              LAST_ERROR_TIMESTAMP: 0000-00-00 00:00:00.000000
                           LAST_QUEUED_TRANSACTION: 81c777c0-c86f-11e8-9031-080027effed8:81
 LAST_QUEUED_TRANSACTION_ORIGINAL_COMMIT_TIMESTAMP: 2018-10-05 21:07:52.286116
LAST_QUEUED_TRANSACTION_IMMEDIATE_COMMIT_TIMESTAMP: 2018-10-05 21:08:10.692561
     LAST_QUEUED_TRANSACTION_START_QUEUE_TIMESTAMP: 2018-10-05 21:08:10.835992
       LAST_QUEUED_TRANSACTION_END_QUEUE_TIMESTAMP: 2018-10-05 21:08:10.842133
                              QUEUEING_TRANSACTION: 
    QUEUEING_TRANSACTION_ORIGINAL_COMMIT_TIMESTAMP: 0000-00-00 00:00:00.000000
   QUEUEING_TRANSACTION_IMMEDIATE_COMMIT_TIMESTAMP: 0000-00-00 00:00:00.000000
        QUEUEING_TRANSACTION_START_QUEUE_TIMESTAMP: 0000-00-00 00:00:00.000000
*************************** 2. row ***************************
                                      CHANNEL_NAME: source_2
                                        GROUP_NAME: 
                                       SOURCE_UUID: 2165e6e2-c870-11e8-8818-080027effed8
                                         THREAD_ID: 58
                                     SERVICE_STATE: ON
                         COUNT_RECEIVED_HEARTBEATS: 47
                          LAST_HEARTBEAT_TIMESTAMP: 2018-10-05 21:08:12.589150
                          RECEIVED_TRANSACTION_SET: 2165e6e2-c870-11e8-8818-080027effed8:28-39
                                 LAST_ERROR_NUMBER: 0
                                LAST_ERROR_MESSAGE: 
                              LAST_ERROR_TIMESTAMP: 0000-00-00 00:00:00.000000
                           LAST_QUEUED_TRANSACTION: 2165e6e2-c870-11e8-8818-080027effed8:39
 LAST_QUEUED_TRANSACTION_ORIGINAL_COMMIT_TIMESTAMP: 2018-10-05 20:52:12.422129
LAST_QUEUED_TRANSACTION_IMMEDIATE_COMMIT_TIMESTAMP: 2018-10-05 20:52:12.422129
     LAST_QUEUED_TRANSACTION_START_QUEUE_TIMESTAMP: 2018-10-05 20:52:12.486156
       LAST_QUEUED_TRANSACTION_END_QUEUE_TIMESTAMP: 2018-10-05 20:52:12.486263
                              QUEUEING_TRANSACTION: 
    QUEUEING_TRANSACTION_ORIGINAL_COMMIT_TIMESTAMP: 0000-00-00 00:00:00.000000
   QUEUEING_TRANSACTION_IMMEDIATE_COMMIT_TIMESTAMP: 0000-00-00 00:00:00.000000
        QUEUEING_TRANSACTION_START_QUEUE_TIMESTAMP: 0000-00-00 00:00:00.000000
2 rows in set (0.02 sec)

Similar to the applier timestamps, the connection timestamps can be used to check the lag caused by the connection threads fetching the transactions from its source’s binary log and writing it to its own relay log. For the relay channel it took around 0.14 second from the transaction was committed on the immediate source (the Relay instance) until the connection thread started to write the transaction to the relay log (LAST_QUEUED_TRANSACTION_START_QUEUE_TIMESTAMP) and then further 0.007 second to complete the write.

Conclusion

The replication related tables in the Performance Schema, particularly the MySQL 8 version of them, provides a very useful way to get information about the replication configuration and status. As a support engineer myself, I look forward to have access to the new timestamp values, when I investigate replication delays.

There is still some work remaining such. For example, it could be useful to know when the transaction started on the original source. That way it is possible to compare the execution time between a source and a replica. However, the current information that is available is already a great improvement.

New Certified Docker Images + Kubernetes Scripts Simplify MariaDB Cloud Deployments

$
0
0
New Certified Docker Images + Kubernetes Scripts Simplify MariaDB Cloud Deployments Saravana Krish… Fri, 10/05/2018 - 14:33

In the last few years, enterprise development teams have been focused on reducing the cost of production-grade applications while improving the velocity and agility of development. That’s led to massive public and private cloud adoption – and deployment of databases in containers. To address this growing need, we’ve released new Docker images and Kubernetes scripts that make it easy to deploy and manage MariaDB databases. Now organizations can focus on building their applications rather than on managing and optimizing container infrastructure.

Upcoming webinar: The Future of MariaDB on Containers
Join us to get a first look at official Docker images, learn how to run stateful MariaDB clusters on Kubernetes and more.
Register Now

New – MariaDB Docker Images, Kubernetes Scripts & Sandbox Environments

We’ve released certified Docker images and enabled customers to seamlessly deploy MariaDB servers in Kubernetes and Docker environments. We are delivering three standalone Docker images (one each for MariaDB Server, ColumnStore and MaxScale) and two sandboxes (one for MariaDB AX and one for MariaDB TX). Customers can deploy the standalone Docker images in a standard Docker environment or create complex topologies in Kubernetes environment using YAML scripts.

For someone just getting started with MariaDB or wanting to learn the capabilities offered, the sandboxes will enable them to easily experiment with MariaDB AX and TX. Sandboxes are self-contained, with all the documentation needed to quickly bring up TX or AX and experiment with sample apps (bookstore in the case of TX, and Zeppelin notebook in the case of AX). You have the flexibility to quickly deploy them on a laptop or desktop using Docker Compose to immediately run sample applications.

We’ve also released a Kubernetes script to create a master/slave (one master + two slaves) cluster with MaxScale at the front end. (This script will be showcased in the webinar on Oct. 9.) Now customers can deploy MariaDB TX with MaxScale easily in high availability mode. The script deploys the master/slave cluster in such a way that when the master fails one of the slaves will be automatically promoted as the new master. Kubernetes will try to bring up the pod and maintain the configuration integrity. When the old master comes back it will automatically become a slave. The script also supports expanding the number of slave nodes easily, using a simple command. 

MariaDB clusters_Kubernetes.png


How to Get Started with Docker and Kubernetes

In the last few years, enterprise development teams have been focused on reducing the cost of production-grade applications while improving the velocity and agility of development. That’s led to massive public and private cloud adoption – and deployment of databases in containers. To address this growing need, we’ve released new Docker images and Kubernetes scripts that make it easy to deploy and manage MariaDB databases. Now organizations can focus on building their applications rather than on managing and optimizing container infrastructure.

Login or Register to post comments

Track Host, Distributed Data

$
0
0

Leveraging distributed data and state is today’s key competitive advantage. This track explored the technical challenges and lessons learned in managing distributed state in large-scale applications that reliably process millions of events per second. Attendees learned proven strategies and gained new insights from leading practitioners into how to handle real-time data in streams and events.

I was a program committee member, and the track host for the Distributed Data track on Tuesday. I did not present at this conference, but I composed remarks to help weave the presentations in this track into a cohesive narrative throughout the day. What follows is a lightly edited version of my introductory remarks for the day’s sessions, as well as introductions to each session. If you’re interested in viewing slides or video of the sessions, you can purchase the video collection directly through O’Reilly Safari. Speakers may also post their slides, which are often linked from the session pages.

Tuesday featured a great set of speakers and topics, lessons from practitioners on how to think about data at scale. The speakers are at the leading edge of their field, sharing stories about the challenges and solutions of pushing the limits of distributed data, and seeing what works and what doesn’t. But although they’re operating at the extremes today, these stories will be widespread and normal in a few years. This isn’t just tech at Google scale that only Google needs, this is all of us.

I was particularly excited to host this track because I’ve been doing a lot of interviews with my own customers to hear about their data engineering practices, their 1- and 3-year data strategy, what trends they’re seeing and how they’re responding, and what they think the future will look like. I’m seeing that the trends in how our customers build distributed data behind and within their distributed systems are all related to macro changes industrywide.

As companies become increasingly data-intensive, and turn to next-generation architectures and data engineering culture and tooling to address it, we’re seeing several consistent themes emerge strongly. These include:

  • Polyglot persistence—the trend to compose data tiers of different technologies.
  • The need to decouple systems for manageability and scalability.
  • The core principles of SRE and how to apply them to stateful systems.
  • Streaming data.
  • Observability, particularly in the data tier where it’s not custom code you can instrument.
  • Observability and traceability of the data flow itself, not just the work the systems do.
  • Different approaches to declarative rather than imperative composition of systems, for cleanliness and abstraction of underlying implementations.

We heard these themes echoed throughout the talks on Tuesday.

Smooth scaling: Slack’s journey toward a new database

The first speaker was Ameet Kotian from Slack. Ameet has a background not only in building distributed systems that manage distributed data, but in building databases themselves. You probably know that Slack is one of the fastest-growing applications in history, which has placed extraordinary demands on their data infrastructure. You might not know that one of Slack’s founders is Cal Henderson, who wrote one of the first books about how to operate MySQL at scale. It was the O’Reilly “fish book,” and introduced a lot of people to topics like sharding and active-passive replication pairs on cheap commodity hardware.

That was more than ten years ago. Now we have the cloud, so why isn’t database scaling just a solved problem? There are several reasons why companies like Slack still have to build scalable database infrastructure themselves and can’t just use a turnkey, off-the-shelf solution. As I listened to Ameet’s story, I was struck by the fact that although technology like Vitess is helping reduce the need to custom-build everything, most data-intensive applications both today and tomorrow will still need to grapple with some of the same challenges, so there’s a lot we can learn from how Slack is approaching this.

Managing multiple sources of truth in distributed applications

The next speaker was Adam Wolfe Gordon, from DigitalOcean. Adam works on the block storage team at DigitalOcean, among other things. One of the challenges of operating distributed systems at scale is that they tend to have a variety of different datastores that have to work together in some way. This is the trend that I call polyglot persistence, and it’s something that all of us deal with in one form or another. It’s often invisible until it causes problems, either operationally or in trying to mutate an app or architecture to grow.

A typical app has as many as ten different data storage technologies these days. If you do a quick count in your head, see what you come up with for your own app. Did you remember zookeeper? What about DNS? But more obviously, you often have file storage, database storage, and some key-value store for example.

These get introduced because you can’t use a single database like Postgres for everything. You always end up with some particular data that’s orders of magnitude better off in a specialized data store: “right tool, right job.” The problem is you now have multiple sources of truth, and you need to coordinate them. Adam’s talk dove into the specifics of coordinating these sources of truth at DigitalOcean, but the lessons apply broadly to every data-intensive app.

Trade-offs in resiliency: Managing the burden of data recoverability

Kristina Bennett is a software engineer who has spent years working on data integrity across Google and is now on the customer reliability team.

Distributed data is hard. It’s hard to build, it’s hard to make it performant, it’s hard to make it correct, it’s hard to evolve over time. Why is it so hard? It’s not just that databases are complicated systems, it’s not just the technology itself. There are two things I’ve seen over and over as I’ve worked with data-intensive systems with lots of distributed data.

The first is that data has a kind of mass, and mass has inertia. We talk about systems as being stateful or stateless, and we know that stateless systems are a lot easier to manage. A big part of that is because stateless systems can be created and destroyed, but state follows the laws of conservation of mass and energy. It takes time and effort to create, move, and destroy data. It doesn’t just happen instantaneously.

The second is time dependency. Many of our systems live in the here and now as constructed from the stream of events in time, storing an up-to-the-moment snapshot of the world, which constantly changes. But if anything goes wrong, it can be really hard to recover systems to a point in time from the past, and then merge that state into the current state, which has continued to change while the recovery efforts were ongoing. It’s like getting to the end of a homework problem, realizing that you dropped a negative, but you don’t know where because you didn’t show all of your work. Solving this problem is challenging in part because of the cost, performance, and other constraints that the size and scale of our systems impose upon us.

Kafka Streams in practice: What works and what doesn’t (yet)

Bart De Vylders is a data scientist at CoScale, a modern container monitoring platform that observes and ingests data from containers, apps, and the full stack at high velocity and applies advanced analysis to monitor them. He spoke about how CoScale converted part of their system to use the Kafka Streams API.

This talk was the first of two that deal with how data flows through your systems. If you’re not yet using Kafka, my personal belief is that Kafka and the event-stream philosophy behind it is one of the most important developments in handling data at large scale in the last decade. In a nutshell, it helps solve two critical problems with data:

  1. The time dependency created by systems like relational databases, that maintain a snapshot of data at a point in time (as I mentioned in my remarks to Kristina Bennett’s talk).
  2. The data flow dependencies introduced by systems that connect to data where it lives, and thus implicitly become dependent on that data being in that location, as well as that data’s snapshotty-ness being up to date.

Sell cron, buy Airflow: Modern data pipelines in finance

Our final talk was by James Meickle, who’s a site reliability engineer at Quantopian, and previously held roles at AppNeta and Harvard among other places.

My introductory remarks to the previous talk about Kafka shouldn’t be taken to mean that everything must be a streaming data problem. Batch processing is still the right answer for a very large set of problems, and unless something else comes along to revolutionize how we process data, it probably always will be.

The common thread between these two talks is managing data dependencies. When I talk to folks at big companies who are using (for example) the Hadoop stack at scale, I often hear that their most acute pains aren’t around things I’m familiar with myself, such as performance, reliability, or cost efficiency. No—their biggest pain and cost is often understanding, managing, and mutating the data flow through their organization. This flow is usually manifested in a very large and complex set of ETL-like tasks, that are often invisibly dependent on each other. James spoke about how Apache Airflow can help structure and manage some of these moving pieces.

On MySQL XA Transactions

$
0
0
One of the features I missed in my blog post on problematic MySQL features back in July is XA transactions. Probably I was too much in a hurry, as this feature is known to be somewhat buggy, limited and not widely used outside of Java applications. My first related feature request, Bug #40445 - "Provide C functions library implementing X/OPEN XA interface for Bea Tuxedo", was created almost 10 years ago, based on the issue from one of MySQL/Sun customers of that time. I remember some internal debates on how much time and efforts the implementation may require, but the decision was not made anyway, and one still can not directly integrate MySQL with Tuxedo transaction manager (that the idea of XA transactions originally came from). It's even more funny to see that feature request still just "Verified" when taking into account the fact that BEA Tuxedo software is Oracle's software since... 2008.

XA Transactions support is a useful MySQL feature, but I wonder if one day it may just become abandoned as that West Pier in Brighton, or overwhelmed with many small bugs in a same way as this stairs to the beach in Hove...

But maybe XA transactions are not widely used and nobody cares much about them?

Let me try to do a quick review of related active bug reports and feature requests before making any conclusions:
  • Bug #91702 - "Feature Request: JOIN support for XA START command". This feature request was added less than 3 months ago and is still "Open". It means there are users interested in this feature, but Oracle engineers do not care much even to verify related requests, even less - to give them some priority. 
    See also Bug #78498 - "XA issue or limitation with 5.6.19 engine", reported 3 years ago, that is essentially about the same limitation. As bug reporter explained:
    "... it prevents us to use MySQL with Weblogic on 2 phase commit scenarii..."
  • Yet another example of a request ignored for a long time is Bug #90659 - "implicit commit and unlocking with xa start", that is about the inconsistency of current implementation. Even less (as we already know) they care about XA support outside of Java as one can conclude from the fact that Connector/Net related request, Bug #70587 - "Dot Net Distributed transaction not supported in MySql Server 5.6", had not got any attention since July, 2015...
  • Bug #91646 - "xa command still operation when super_read_only is true". This bug was reported in July by Zhenghu Wen. It seems nobody cares much about XA transactions integration when new features are added to MySQL server.
  • Bug #89860 - "XA may lost prepared transaction and cause different between master and slave". This bug reported by Michael Yang (See also Bug #88534) sounds really serious and was previously reported by Andrei Elkin (who works for MariaDB now) as Bug #76233 - "XA prepare is logged ahead of engine prepare". See also Bug #87560 - "XA PREPARE log order error in replication and binlog recovery" by Wei Zhao, who also contributed a patch. See also Bug #83983 - "innodb fail to recover the prepared xa transaction" (the bug reported by Dennis Gao is still "Open", while it's clearly related to or is a duplicate of "Verified" bugs mentioned above).
    So many related/duplicate problem reports, but no fix so far!
  • Bug #88748 - "InnoDB: Failing assertion: trx->conc_state == 1". This assertion failure was reported by Roel Van de Paar back in December, 2017. See also his Bug #84754 - "oid String::chop(): Assertion `strlen(m_ptr) == m_length' failed."
    I noted that Oracle recently invented new "low" severity levels, and this bug is S6 (Debug Builds). I do not really agree that assertions in debug builds are of so low severity - they are in the code for a reason, to prevent crashes in non-debug builds and all kinds of inconsistencies.
  • Bug #87526 - "The output of 'XA recover convert xid' is not useful". This bug reported by Sveta Smirnova caused a lot of troubles to poor users with prepared transactions hanging around for weeks after crash, as it prevented any easy way to get rid of them (and related locks) in some cases. The bug is still "Verified" in MySQL and "On hold" in Percona Server, while MariaDB fixed it in 10.3, see MDEV-14593.
  • Bug #87130 - "XA COMMIT not taken as transaction boundary". Yet another bug report with a patch from Wei Zhao.
  • Bug #75205 - "Master should write a LOST_EVENTS entry on xa commit after recovery." Daniël van Eeden reported this at early 5.7 pre-GA stage, and manual explains now that:
    "In MySQL 5.7.7 and later, there is a change in behavior and an XA transaction is written to the binary log in two parts. When XA PREPARE is issued, the first part of the transaction up to XA PREPARE is written using an initial GTID. A XA_prepare_log_event is used to identify such transactions in the binary log. When XA COMMIT or XA ROLLBACK is issued, a second part of the transaction containing only the XA COMMIT or XA ROLLBACK statement is written using a second GTID. Note that the initial part of the transaction, identified by XA_prepare_log_event, is not necessarily followed by its XA COMMIT or XA ROLLBACK, which can cause interleaved binary logging of any two XA transactions. The two parts of the XA transaction can even appear in different binary log files. This means that an XA transaction in PREPARED state is now persistent until an explicit XA COMMIT or XA ROLLBACK statement is issued, ensuring that XA transactions are compatible with replication."
    but the bug report is still "Verified".
    By the way, the need to deal with such prepared transactions recovered from the binary log caused problems like those listed above (with XA RECOVER CONVERT and order of preparing in the binary log vs engines that support XA...
  • Bug #71351 - "select hit query cache after xa commit, no result return". This bug probably affects only MySQL 5.5, so no wonder it's ignored now. Nobody tried to fix it while MySQL 5.5 was still supported, though.
There are some more bugs originally filed in other categories, but still related to XA:
  • Bug #72036 - "XA isSameRM() shouldn't take database into account". This Connecotr/J bug was reported in 2014 by Jess Balint.
  • Bug #78050 - "Crash on when XA functions activated by a storage engine". It happens when binary log not enabled. This bug was reported by Zhenye Xie, who also contributed a patch later. Still this crashing bug remains "Verified".
  • Bug #87385 - "Partial external XA transactions are not rolled back correctly". Yet another bug report with a patch from Wei Zhao. See also his Bug #87389 - "Replication position not persisted correctly for XA transactions".
  • Bug #91633 - "Replication failure (errno 1399) on update in XA tx after deadlock". This bug reported by Lukas Sydorowski got recent comment from other community member yesterday. So, the feature is used these days, still.
Now time for conclusions:
  1. Take extra care while using XA transactions in replication environments or with point in time recovery - you may easily end up with slaves out of sync with master and data lost.
  2. Feature requests related to XA transactions are mostly ignored, sometimes for a decade... 
  3. Patches contributed do not seem to speed up XA bug fixing.
  4. I'd say that Oracle does not care much about XA Transactions since MySQL 5.7 GA release in 2015.
  5. MySQL Community still use XA transactions with MySQL (and they will be used even more as corporate users migrate from Oracle RDBMS), find bugs and even try to fix them. But probably will have to use forks rather than MySQL itself if current attitude towards XA bugs processing and fixing remains.

Percona Live Europe 2018 Session Programme Published

$
0
0
PLE 2018 Full Agenda Announced

PLE 2018 Full Agenda AnnouncedOffering over 110 conference sessions across Tuesday, 6 and Wednesday, 7 November, and a full tutorial day on Monday 5 November, we hope you’ll find that this fantastic line up of talks for Percona Live Europe 2018 to be one of our best yet! Innovation in technology continues to arrive at an accelerated rate, and you’ll find plenty to help you connect with the latest developments in open source database technologies at this acclaimed annual event.

Representatives from companies at the leading edge of our industry use the platform offered by Percona Live to showcase their latest developments and share plans for the future. If your career is dependent upon the use of open source database technologies you should not miss this conference!

Conference Session Schedule

Conference sessions will take place on Tuesday and Wednesday, November 6-7 and will feature more than 110 in-depth talks by industry experts. Conference session examples include:

  • Deep Dive on MySQL Databases on Amazon RDS – Chayan Biswas, AWS
  • MySQL 8.0 Performance: Scalability & Benchmarks – Dimitri Kravtchuk, Oracle
  • MySQL 8 New Features: Temptable engine – Pep Pla, Pythian
  • Artificial Intelligence Database Performance Tuning – Roel Van de Paar, Percona
  • pg_chameleon – MySQL to PostgreSQL replica made easy – Federico Campoli, Loxodata
  • Highway to Hell or Stairway to Cloud? – Alexander Kukushkin, Zalando
  • Zero to Serverless in 60 Seconds – Sandor Maurice, AWS
  • A Year in Google Cloud – Carmen Mason, Alan Mason, Vital Source Technologies
  • Advanced MySQL Data at Rest Encryption in Percona Server for MySQL – Iwo Panowicz, Percona, and Bartłomiej Oleś, Severalnines
  • Monitoring Kubernetes with Prometheus – Henri Dubois-Ferriere, Sysdig
  • How We Use and Improve Percona XtraBackup at Alibaba Cloud – Bo Wang, Alibaba Cloud
  • Shard 101 – Adamo Tonete, Percona
  • Top 10 Mistakes When Migrating From Oracle to PostgreSQL – Jim Mlodgenski, AWS
  • Explaining the Postgres Query Optimizer – Bruce Momjian, EnterpriseDB
  • MariaDB 10.3 Optimizer and Beyond – Vicentiu Ciorbaru, MariaDB FoundationHA and Clustering Solution: ProxySQL as an Intelligent Router for Galera and Group Replication – René Cannaò, ProxySQL
  • MongoDB WiredTiger WriteConflicts – Paul Agombin, ObjectRocket
  • PostgreSQL Enterprise Features – Michael Banck, credativ GmbH
  • What’s New in MySQL 8.0 Security – Georgi Kodinov, Oracle
  • The MariaDB Foundation and Security – Finding and Fixing Vulnerabilities the Open Source Way – Otto Kekäläinen, MariaDB Foundation
  • ClickHouse 2018: How to Stop Waiting for Your Queries to Complete and Start Having Fun – Alexander Zaitsev, Altinity
  • Open Source Databases and Non-Volatile Memory – Frank Ober, Intel Memory Group
  • MyRocks Production Case Studies at Facebook – Yoshinori Matsunobu, Facebook
  • Need for Speed: Boosting Apache Cassandra’s Performance Using Netty – Dinesh Joshi, Apache Cassandra
  • Demystifying MySQL Replication Crash Safety – Jean-François Gagné, Messagebird

See the full list of sessions

Tutorial schedule

Tutorials will take place throughout the day on Monday, November 5, 2018. Tutorial session examples include:

  • Query Optimization with MySQL 8.0 and MariaDB 10.3: The Basics – Jaime Crespo, Wikimedia Foundation
  • ElasticSearch 101 – Antonios Giannopoulos, ObjectRocket
  • MySQL InnoDB Cluster in a Nutshell: The Saga Continues with 8.0 – Frédéric Descamps, Oracle
  • High Availability PostgreSQL and Kubernetes with Google Cloud – Alexis Guajardo, Google
  • Best Practices for High Availability – Alex Rubin and Alex Poritskiy, Percona

See the full list of tutorials.

Sponsors

We are grateful for the support of our sponsors:

  • Platinum – AWS
  • Silver – Altinity, PingCap
  • Start Up – Severalnines
  • Branding – Intel, Idera
  • Expo – Postgres EU

If you would like to join them Sponsorship opportunities for Percona Live Open Source Database Conference Europe 2018 are available and offer the opportunity to interact with the DBAs, sysadmins, developers, CTOs, CEOs, business managers, technology evangelists, solution vendors and entrepreneurs who typically attend the event. Contact live@percona.com for sponsorship details.

Ready to register? What are you waiting for? Costs will only get higher!
Register now!


The post Percona Live Europe 2018 Session Programme Published appeared first on Percona Database Performance Blog.


Persistence of autoinc fixed in MySQL 8.0

$
0
0
MySQL 8.0 autoinc persistence fixed

MySQL 8.0 autoinc persistence fixedThe release of MySQL 8.0 has brought a lot of bold implementations that touched on things that have been avoided before, such as added support for common table expressions and window functions. Another example is the change in how AUTO_INCREMENT (autoinc) sequences are persisted, and thus replicated.

This new implementation carries the fix for bug #73563 (Replace result in auto_increment value less or equal than max value in row-based), which we’ve only found about recently. The surprising part is that the use case we were analyzing is a somewhat common one; this must be affecting a good number of people out there.

Understanding the bug

The business logic of the use case is such the UNIQUE column found in a table whose id is managed by an AUTO_INCREMENT sequence needs to be updated, and this is done with a REPLACE operation:

“REPLACE works exactly like INSERT, except that if an old row in the table has the same value as a new row for a PRIMARY KEY or a UNIQUE index, the old row is deleted before the new row is inserted.”

So, what happens in practice in this particular case is a DELETE followed by an INSERT of the target row.

We will explore this scenario here in the context of an oversimplified currency converter application that uses USD as base reference:

CREATE TABLE exchange_rate (
id INT PRIMARY KEY AUTO_INCREMENT,
currency VARCHAR(3) UNIQUE,
rate FLOAT(5,3)
) ENGINE=InnoDB;

Let’s add a trio of rows to this new table:

INSERT INTO exchange_rate (currency,rate) VALUES ('EUR',0.854), ('GBP',0.767), ('BRL',4.107);

which gives us the following initial set:

master (test) > select * from exchange_rate;
+----+----------+-------+
| id | currency | rate  |
+----+----------+-------+
|  1 | EUR      | 0.854 |
|  2 | GBP      | 0.767 |
|  3 | BRL      | 4.107 |
+----+----------+-------+
3 rows in set (0.00 sec)

Now we update the rate for Brazilian Reais using a REPLACE operation:

REPLACE INTO exchange_rate SET currency='BRL', rate=4.500;

With currency being a UNIQUE field the row is fully replaced:

master (test) > select * from exchange_rate;
+----+----------+-------+
| id | currency | rate  |
+----+----------+-------+
|  1 | EUR      | 0.854 |
|  2 | GBP      | 0.767 |
|  4 | BRL      | 4.500 |
+----+----------+-------+
3 rows in set (0.00 sec)

and thus the autoinc sequence is updated:

master (test) > SHOW CREATE TABLE exchange_rate\G
*************************** 1. row ***************************
     Table: exchange_rate
Create Table: CREATE TABLE `exchange_rate` (
`id` int(11) NOT NULL AUTO_INCREMENT,
`currency` varchar(3) DEFAULT NULL,
`rate` float(5,3) DEFAULT NULL,
PRIMARY KEY (`id`),
UNIQUE KEY `currency` (`currency`)
) ENGINE=InnoDB AUTO_INCREMENT=5 DEFAULT CHARSET=latin1
1 row in set (0.00 sec)

The problem is that the autoinc sequence is not updated in the replica as well:

slave1 (test) > select * from exchange_rate;show create table exchange_rate\G
+----+----------+-------+
| id | currency | rate  |
+----+----------+-------+
|  1 | EUR      | 0.854 |
|  2 | GBP      | 0.767 |
|  4 | BRL      | 4.500 |
+----+----------+-------+
3 rows in set (0.00 sec)
*************************** 1. row ***************************
     Table: exchange_rate
Create Table: CREATE TABLE `exchange_rate` (
`id` int(11) NOT NULL AUTO_INCREMENT,
`currency` varchar(3) DEFAULT NULL,
`rate` float(5,3) DEFAULT NULL,
PRIMARY KEY (`id`),
UNIQUE KEY `currency` (`currency`)
) ENGINE=InnoDB AUTO_INCREMENT=4 DEFAULT CHARSET=latin1
1 row in set (0.00 sec)

Now, the moment we promote that replica as master and start writing to this table we’ll hit a duplicate key error:

slave1 (test) > REPLACE INTO exchange_rate SET currency='BRL', rate=4.600;
ERROR 1062 (23000): Duplicate entry '4' for key 'PRIMARY'

Note that:

a) the transaction fails and the row is not replaced, however the autoinc sequence is incremented:

slave1 (test) > SELECT AUTO_INCREMENT FROM information_schema.TABLES WHERE table_schema='test' AND table_name='exchange_rate';
+----------------+
| AUTO_INCREMENT |
+----------------+
|              5 |
+----------------+
1 row in set (0.00 sec)

b) this problem only happens with row-based replication (binlog_format=ROW), where REPLACE in this case is logged as a row UPDATE:

# at 6129
#180829 18:29:55 server id 100  end_log_pos 5978 CRC32 0x88da50ba Update_rows: table id 117 flags: STMT_END_F
### UPDATE `test`.`exchange_rate`
### WHERE
###   @1=3 /* INT meta=0 nullable=0 is_null=0 */
###   @2='BRL' /* VARSTRING(3) meta=3 nullable=1 is_null=0 */
###   @3=4.107                /* FLOAT meta=4 nullable=1 is_null=0 */
### SET
###   @1=4 /* INT meta=0 nullable=0 is_null=0 */
###   @2='BRL' /* VARSTRING(3) meta=3 nullable=1 is_null=0 */
###   @3=4.5                  /* FLOAT meta=4 nullable=1 is_null=0 */

With statement-based replication—or even mixed format—the REPLACE statement is replicated as is: it will trigger a DELETE+INSERT in the background on the replica and thus update the autoinc sequence in the same way it did on the master.

This example (tested with Percona Server versions 5.5.61, 5.6.36 and 5.7.22) helps illustrate the issue with autoinc sequences not being persisted as they should be with row-based replication. However, MySQL’s Worklog #6204 includes a couple of scarier scenarios involving the master itself, such as when the server crashes while a transaction is writing to a table similar to the one used in the example above. MySQL 8.0 remedies this bug.

Workarounds

There are a few possible workarounds to consider if this problem is impacting you and if neither upgrading to the 8 series nor resorting to statement-based or mixed replication format are viable options.

We’ll be discussing three of them here: one that resorts around the execution of checks before a failover (to detect and fix autoinc inconsistencies in replicas), another that requires a review of all REPLACE statements like the one from our example and adapt it as to include the id field, thus avoiding the bug, and finally one that requires changing the schema of affected tables in such a way that the target field is made the Primary Key of the table while id (autoinc) is converted into a UNIQUE key.

a) Detect and fix

The less intrusive of the workarounds we conceived for the problem at hand in terms of query and schema changes is to run a check for each of the tables that might be facing this issue in a replica before we promote it as master in a failover scenario:

slave1 (test) > SELECT ((SELECT MAX(id) FROM exchange_rate)>=(SELECT AUTO_INCREMENT FROM information_schema.TABLES WHERE table_schema='test' AND table_name='exchange_rate')) as `check`;
+-------+
| check |
+-------+
|     1 |
+-------+
1 row in set (0.00 sec)

If the table does not pass the test, like ours didn’t at first (just before we attempted a REPLACE after we failed over to the replica), then update autoinc accordingly. The full routine (check + update of autoinc) could be made into a single stored procedure:

DELIMITER //
CREATE PROCEDURE CheckAndFixAutoinc()
BEGIN
 DECLARE done TINYINT UNSIGNED DEFAULT 0;
 DECLARE tableschema VARCHAR(64);
 DECLARE tablename VARCHAR(64);
 DECLARE columnname VARCHAR(64);  
 DECLARE cursor1 CURSOR FOR SELECT TABLE_SCHEMA, TABLE_NAME, COLUMN_NAME FROM information_schema.COLUMNS WHERE TABLE_SCHEMA NOT IN ('mysql', 'information_schema', 'performance_schema', 'sys') AND EXTRA LIKE '%auto_increment%';
 DECLARE CONTINUE HANDLER FOR NOT FOUND SET done=1;
 OPEN cursor1;  
 start_loop: LOOP
  IF done THEN
    LEAVE start_loop;
  END IF;
  FETCH cursor1 INTO tableschema, tablename, columnname;
  SET @get_autoinc = CONCAT('SELECT @check1 := ((SELECT MAX(', columnname, ') FROM ', tableschema, '.', tablename, ')>=(SELECT AUTO_INCREMENT FROM information_schema.TABLES WHERE TABLE_SCHEMA=\'', tableschema, '\' AND TABLE_NAME=\'', tablename, '\')) as `check`');
  PREPARE stm FROM @get_autoinc;
  EXECUTE stm;
  DEALLOCATE PREPARE stm;
  IF @check1>0 THEN
    BEGIN
      SET @select_max_id = CONCAT('SELECT @max_id := MAX(', columnname, ')+1 FROM ', tableschema, '.', tablename);
      PREPARE select_max_id FROM @select_max_id;
      EXECUTE select_max_id;
      DEALLOCATE PREPARE select_max_id;
      SET @update_autoinc = CONCAT('ALTER TABLE ', tableschema, '.', tablename, ' AUTO_INCREMENT=', @max_id);
      PREPARE update_autoinc FROM @update_autoinc;
      EXECUTE update_autoinc;
      DEALLOCATE PREPARE update_autoinc;
    END;
  END IF;
 END LOOP start_loop;  
 CLOSE cursor1;
END//
DELIMITER ;

It doesn’t allow for as clean a failover as we would like but it can be helpful if you’re stuck with MySQL<8.0 and binlog_format=ROW and cannot make changes to your queries or schema.

b) Include Primary Key in REPLACE statements

If we had explicitly included the id (Primary Key) in the REPLACE operation from our example it would have also been replicated as a DELETE+INSERT even when binlog_format=ROW:

master (test) > REPLACE INTO exchange_rate SET currency='BRL', rate=4.500, id=3;
# at 16151
#180905 13:32:17 server id 100  end_log_pos 15986 CRC32 0x1d819ae9  Write_rows: table id 117 flags: STMT_END_F
### DELETE FROM `test`.`exchange_rate`
### WHERE
###   @1=3 /* INT meta=0 nullable=0 is_null=0 */
###   @2='BRL' /* VARSTRING(3) meta=3 nullable=1 is_null=0 */
###   @3=4.107                /* FLOAT meta=4 nullable=1 is_null=0 */
### INSERT INTO `test`.`exchange_rate`
### SET
###   @1=3 /* INT meta=0 nullable=0 is_null=0 */
###   @2='BRL' /* VARSTRING(3) meta=3 nullable=1 is_null=0 */
###   @3=4.5                  /* FLOAT meta=4 nullable=1 is_null=0 */
# at 16199
#180905 13:32:17 server id 100  end_log_pos 16017 CRC32 0xf11fed56  Xid = 184
COMMIT/*!*/;

We could point out that we are doing it wrong by not having the id included in the REPLACE statement in the first place; the reason for not doing so would be mostly related to avoiding an extra lookup for each replace (to obtain the id for the currency we want to update). On the other hand, what if your business logic do expects the id to change at each REPLACE ? You should have such requirement in mind when considering this workaround as it is effectively a functional change to what we had initially.

c) Make the target field the Primary Key and keep autoinc as a UNIQUE key

If we make currency the Primary Key of our table and id a UNIQUE key instead:

CREATE TABLE exchange_rate (
id INT UNIQUE AUTO_INCREMENT,
currency VARCHAR(3) PRIMARY KEY,
rate FLOAT(5,3)
) ENGINE=InnoDB;

the same REPLACE operation will be replicated as a DELETE+INSERT too:

# at 19390
#180905 14:03:56 server id 100  end_log_pos 19225 CRC32 0x7042dcd5  Write_rows: table id 131 flags: STMT_END_F
### DELETE FROM `test`.`exchange_rate`
### WHERE
###   @1=3 /* INT meta=0 nullable=0 is_null=0 */
###   @2='BRL' /* VARSTRING(3) meta=3 nullable=0 is_null=0 */
###   @3=4.107                /* FLOAT meta=4 nullable=1 is_null=0 */
### INSERT INTO `test`.`exchange_rate`
### SET
###   @1=4 /* INT meta=0 nullable=0 is_null=0 */
###   @2='BRL' /* VARSTRING(3) meta=3 nullable=0 is_null=0 */
###   @3=4.5                  /* FLOAT meta=4 nullable=1 is_null=0 */
# at 19438
#180905 14:03:56 server id 100  end_log_pos 19256 CRC32 0x79efc619  Xid = 218
COMMIT/*!*/;

Of course, the same would be true if we had just removed id entirely from the table and kept currency as the Primary Key. This would work in our particular test example but that won’t always be the case. Please note though that if you do keep id on the table you must make it a UNIQUE key: this workaround is based on the fact that this key becomes a second unique constraint, which triggers a different code path to log a replace operation. Had we made it a simple, non-unique key instead that wouldn’t be the case.

If you have any comments or suggestions about the issue addressed in this post, the workarounds we propose, or even a different view of the problem you would like to share please leave a comment in the section below.

Co-Author: Trey Raymond

Trey RaymondTrey Raymond is a Sr. Database Engineer for Oath Inc. (née Yahoo!), specializing in MySQL. Since 2010, he has worked to build the company’s database platform and supporting team into industry leaders.

While a performance guru at heart, his experience and responsibilities range from hardware and capacity planning all through the stack to database tool and utility development.

He has a reputation for breaking things to learn something new.

Co-Author: Fernando Laudares

fernando laudaresFernando is a Senior Support Engineer with Percona. Fernando’s work experience includes the architecture, deployment and maintenance of IT infrastructures based on Linux, open source software and a layer of server virtualization. He’s now focusing on the universe of MySQL, MongoDB and PostgreSQL with a particular interest in understanding the intricacies of database systems, and contributes regularly to this blog. You can read his other articles here.

The post Persistence of autoinc fixed in MySQL 8.0 appeared first on Percona Database Performance Blog.

You’re not storing sensitive data in your database. Seriously?

$
0
0

At technology events, I often ask attendees if they’re storing sensitive data in MySQL. Only a few hands go up. Then, I rephrase and ask, “how many of you would be comfortable if your database tables were exposed on the Internet?” Imagine how it would be perceived by your customers, your manager, your employees or your board of directors. Once again, “how many of you are storing sensitive data in MySQL?” Everyone.

TWO MAXIMS:

1.) You are storing sensitive data.

Even if it’s truly meaningless data, you can’t afford for your company to be perceived as loose with data security. If you look closely at your data; however, you’ll likely realize that it could be exploited. Does it include any employee info, server IP addresses or internal routing information?

A recent article by Lisa Vaas from Naked Security highlights a spate of data leaks from poorly configured MongoDB instances.

Here we Mongo again! Millions of records exposed by insecure database

What’s striking is that these leaks didn’t include credit cards, social security numbers or so-called sensitive data. Nevertheless, companies are vulnerable to ransomware and diminished customer trust.

2). Your data will be misplaced, eventually.

Employees quit, servers get decommissioned; but database tables persist. Your tables are passed among developers, DBA’s and support engineers. They are moved between bare metal, VM’s and public cloud providers. Given enough time, your data will end up in a place it shouldn’t be.

Often people don’t realize that their binary data is easily exposed. Take any binary data, for example, and run the Linux strings function against it. On a Linux command line, just type “strings filename”. You’ll see your data scroll across the screen in readable text.

ENCRYPT MYSQL DATA

Two years ago, MySQL developers had to change their application to encrypt data. Now, transparent data encryption in MySQL 5.7 and 8.0 require no application changes. With Oracle’s version of MySQL, there’s little performance overhead after the data is encrypted.

Below are a few simple steps to encrypt your data in MySQL 8.0. This process relies on a keyring file. This won’t meet compliance requirements (see KEY MANAGEMENT SYSTEMS below), but it’s a good first step.

  1. Check your version of MySQL. It should be MySQL 5.7 or 8.0.
  2. Pre-load the plugin in your my.cnf: early-plugin-load = keyring_file.so
  3. Execute the following queries:
  • INSTALL PLUGIN keyring_udf SONAME ‘keyring_udf.so’;
  • CREATE FUNCTION keyring_key_generate RETURNS INTEGER SONAME ‘keyring_udf.so’;
  • SELECT keyring_key_generate(‘alongpassword’, ‘DSA’, 256);
  • ALTER TABLE titles ENCRYPTION = ‘Y’;

Per documentation warning: The keyring_file and keyring_encrypted file plugins are not intended as regulatory compliance solutions. Security standards such as PCI, FIPS, and others require use of key management systems to secure, manage, and protect encryption keys in key vaults or hardware security modules (HSMs).

KEY MANAGEMENT SYSTEMS (KMS)

Credit card and data privacy regulations require that keys are restricted and rotated. If your company collects payment information, it’s likely that your organization already has one a key management system (KMS). These systems are usually software or hardware appliances used strictly for managing your corporate encryption keys. The MySQL Enterprise Edition includes a plugin for communicating directly with the KMS. MySQL is compatible with Oracle Key Vault, SafeNet KeySecure, Thales Vormetric Key Management and Fornetix Key Orchestration.

Introduction to Oracle Key Vault

In summary, reconsider if you believe that you’re not storing sensitive data. If using MySQL, capabilities in the latest releases make it possible to encrypt data without changing your application. At the very least, encrypt your data with the key file method (above). Ideally, however; investigate a key management system to also meet regulatory requirements.

Announcement: Second Alpha Build of Percona XtraBackup 8.0-2-alpha2 Is Available

$
0
0
Percona XtraBackup 8.0

Percona XtraBackup 8.0The second alpha build of Percona XtraBackup 8.0.2 is now available in the Percona experimental software repositories.

Note that, due to the new MySQL redo log and data dictionary formats, the Percona XtraBackup 8.0.x versions will only be compatible with MySQL 8.0.x and Percona Server for MySQL 8.0.x. This release supports backing up Percona Server 8.0 Alpha.

For experimental migrations from earlier database server versions, you will need to backup and restore and using XtraBackup 2.4 and then use mysql_upgrade from MySQL 8.0.x

PXB 8.0.2 alpha is available for the following platforms:

  • RHEL/Centos 6.x
  • RHEL/Centos 7.x
  • Ubuntu 14.04 Trusty*
  • Ubuntu 16.04 Xenial
  • Ubuntu 18.04 Bionic
  • Debian 8 Jessie*
  • Debian 9 Stretch

Information on how to configure the Percona repositories for apt and yum systems and access the Percona experimental software is here.

* We might drop these platforms before GA release.

Improvements

  • PXB-1658: Import keyring vault plugin from Percona Server 8
  • PXB-1609: Make version_check optional at build time
  • PXB-1626: Support encrypted redo logs
  • PXB-1627: Support obtaining binary log coordinates from performance_schema.log_status

Fixed Bugs

  • PXB-1634: The CREATE TABLE statement could fail with the DUPLICATE KEY error
  • PXB-1643: Memory issues reported by ASAN in PXB 8
  • PXB-1651: Buffer pool dump could create a (null) file during prepare stage of Mysql8.0.12 data
  • PXB-1671: A backup could fail when the MySQL user was not specified
  • PXB-1660: InnoDB: Log block N at lsn M has valid header, but checksum field contains Q, should be P

Other bugs fixed: PXB-1623PXB-1648PXB-1669PXB-1639, and PXB-1661.

The post Announcement: Second Alpha Build of Percona XtraBackup 8.0-2-alpha2 Is Available appeared first on Percona Database Performance Blog.

MySQL 8: Performance Schema Digests Improvements

$
0
0

Since MySQL 5.6, the digest feature of the MySQL Performance Schema has provided a convenient and effective way to obtain statistics of queries based on their normalized form. The feature works so well that it has almost completely (from my experience) replaced the connector extensions and proxy for collecting query statistics for the Query Analyzer (Quan) in MySQL Enterprise Monitor (MEM).

MySQL 8 adds further improvements to the digest feature in the Performance Schema including a sample query with statistics for each digest, percentile information, and a histogram summary. This blog will explore these new features.

The MySQL Enterprise Monitor Query Analyzer
MySQL Enterprise Monitor is one of the main users of the Performance Schema digests for its Query Analyzer.

Let’s start out looking at the the good old summary by digest table.

Query Sample

The base table for digest summary information is the events_statements_summary_by_digest table. This has been around since MySQL 5.6. In MySQL 8.0 it has been extended with six columns of which three have data related to a sample query will be examined in this section.

The three sample columns are:

  • QUERY_SAMPLE_TEXT: An actual example of a query.
  • QUERY_SAMPLE_SEEN: When the sample query was seen.
  • QUERY_SAMPLE_TIMER_WAIT: How long time the sample query took to execute (in picoseconds).

As an example consider the query SELECT * FROM world.city WHERE id = <value>. The sample information for that query as well as the digest and digest text (normalized query) may look like:

mysql> SELECT DIGEST, DIGEST_TEXT, QUERY_SAMPLE_TEXT, QUERY_SAMPLE_SEEN,
              sys.format_time(QUERY_SAMPLE_TIMER_WAIT) AS SampleTimerWait
         FROM performance_schema.events_statements_summary_by_digest
        WHERE DIGEST_TEXT LIKE '%`world` . `city`%'\G
*************************** 1. row ***************************
           DIGEST: 9431aed9635923565d7bc92cc36d6411c3abb9f52d2c22715be21b5472e3c366
      DIGEST_TEXT: SELECT * FROM `world` . `city` WHERE `ID` = ?
QUERY_SAMPLE_TEXT: SELECT * FROM world.city WHERE ID = 130
QUERY_SAMPLE_SEEN: 2018-10-09 17:19:20.500944
  SampleTimerWait: 17.34 ms
1 row in set (0.00 sec)

There are a few things to note here:

  • The digest in MySQL 8 is a sha256 hash whereas in 5.6 and 5.7 it was an md5 hash.
  • The digest text is similar to the normalized query that the mysqldumpslow script can generate for queries in the slow query log; just that the Performance Schema uses a question mark as a placeholder.
  • The QUERY_SAMPLE_SEEN value is in the system time zone.
  • The sys.format_time() function is in the query used to convert the picoseconds to a human readable value.

The maximum length of the sample text is set with the performance_schema_max_sql_text_length option. The default is 1024 bytes. It is the same option that is used for the SQL_TEXT columns in the statement events tables. It requires a restart of MySQL to change the value. Since the query texts are stored in several contexts and some of the Performance Schema tables can have thousands of rows, do take care not to increase it beyond what you have memory for.

How is the sample query chosen? The sample is the slowest example of a query with the given digest. If the performance_schema_max_digest_sample_age option is set to a non-zero value (the default is 60 seconds) and the existing sample is older than the specified value, it will always be replaced.

The events_statements_summary_by_digest also has another set of new columns: percentile information.

Percentile Information

Since the beginning, the events_statements_summary_by_digest table has included some statistical information about the query times for a given digest: the minimum, average, maximum, and total query time. In MySQL 8 this has been extended to include information about the 95th, 99th, and 99.9th percentile. The information is available in the QUANTILE_95, QUANTILE_99, and QUANTILE_999 column respectively. All of the values are in picoseconds.

What does the new columns mean? Based on the histogram information of the query (see the next section), MySQL calculates a high estimate of the query time. For a given digest, 95% of the executed queries are expected to be faster than the query time given by QUANTILE_95. Similar for the two other columns.

As an example consider the same digest as before:

mysql> SELECT DIGEST, DIGEST_TEXT, QUERY_SAMPLE_TEXT,
              sys.format_time(SUM_TIMER_WAIT) AS SumTimerWait,
              sys.format_time(MIN_TIMER_WAIT) AS MinTimerWait,
              sys.format_time(AVG_TIMER_WAIT) AS AvgTimerWait,
              sys.format_time(MAX_TIMER_WAIT) AS MaxTimerWait,
              sys.format_time(QUANTILE_95) AS Quantile95,
              sys.format_time(QUANTILE_99) AS Quantile99,
              sys.format_time(QUANTILE_999) AS Quantile999
         FROM performance_schema.events_statements_summary_by_digest
        WHERE DIGEST_TEXT LIKE '%`world` . `city`%'\G
*************************** 1. row ***************************
           DIGEST: 9431aed9635923565d7bc92cc36d6411c3abb9f52d2c22715be21b5472e3c366
      DIGEST_TEXT: SELECT * FROM `world` . `city` WHERE `ID` = ?
QUERY_SAMPLE_TEXT: SELECT * FROM world.city WHERE ID = 130
     SumTimerWait: 692.77 ms
     MinTimerWait: 50.32 us
     AvgTimerWait: 68.92 us
     MaxTimerWait: 17.34 ms
       Quantile95: 104.71 us
       Quantile99: 165.96 us
      Quantile999: 363.08 us
1 row in set (0.00 sec)

Having the 95th, 99th, and 99.9th percentile helps predict the performance of a query and show the spread of the query times. Even more information about the spread can be found using the new family member: histograms.

Histograms

Histograms is a way to put the query execution times into buckets, so it is possible to see how the query execution times spread. This can for example be useful to see how evenly the query time is. The average query time may be fine, but if that is based on some queries executing super fast and others very slow, it will still result in unhappy users and customers.

The MAX_TIMER_WAIT column of the events_statements_summary_by_digest table discussed this far shows the high watermark, but it does not say whether it is a single outlier or a result of general varying query times. The histograms give the answer to this.

Using the query digest from earlier in the blog, the histogram information for the query can be found in the events_statements_histogram_by_digest table like:

mysql> SELECT BUCKET_NUMBER,
              sys.format_time(BUCKET_TIMER_LOW) AS TimerLow,
              sys.format_time(BUCKET_TIMER_HIGH) AS TimerHigh,
              COUNT_BUCKET, COUNT_BUCKET_AND_LOWER, BUCKET_QUANTILE
         FROM performance_schema.events_statements_histogram_by_digest
        WHERE DIGEST = '9431aed9635923565d7bc92cc36d6411c3abb9f52d2c22715be21b5472e3c366'
              AND COUNT_BUCKET > 0
        ORDER BY BUCKET_NUMBER;
+---------------+-----------+-----------+--------------+------------------------+-----------------+
| BUCKET_NUMBER | TimerLow  | TimerHigh | COUNT_BUCKET | COUNT_BUCKET_AND_LOWER | BUCKET_QUANTILE |
+---------------+-----------+-----------+--------------+------------------------+-----------------+
|            36 | 50.12 us  | 52.48 us  |          524 |                    524 |        0.052400 |
|            37 | 52.48 us  | 54.95 us  |         2641 |                   3165 |        0.316500 |
|            38 | 54.95 us  | 57.54 us  |          310 |                   3475 |        0.347500 |
|            39 | 57.54 us  | 60.26 us  |          105 |                   3580 |        0.358000 |
|            40 | 60.26 us  | 63.10 us  |           48 |                   3628 |        0.362800 |
|            41 | 63.10 us  | 66.07 us  |         3694 |                   7322 |        0.732200 |
|            42 | 66.07 us  | 69.18 us  |          611 |                   7933 |        0.793300 |
|            43 | 69.18 us  | 72.44 us  |          236 |                   8169 |        0.816900 |
|            44 | 72.44 us  | 75.86 us  |          207 |                   8376 |        0.837600 |
|            45 | 75.86 us  | 79.43 us  |          177 |                   8553 |        0.855300 |
|            46 | 79.43 us  | 83.18 us  |          236 |                   8789 |        0.878900 |
|            47 | 83.18 us  | 87.10 us  |          186 |                   8975 |        0.897500 |
|            48 | 87.10 us  | 91.20 us  |          203 |                   9178 |        0.917800 |
|            49 | 91.20 us  | 95.50 us  |          116 |                   9294 |        0.929400 |
|            50 | 95.50 us  | 100.00 us |          135 |                   9429 |        0.942900 |
|            51 | 100.00 us | 104.71 us |          105 |                   9534 |        0.953400 |
|            52 | 104.71 us | 109.65 us |           65 |                   9599 |        0.959900 |
|            53 | 109.65 us | 114.82 us |           65 |                   9664 |        0.966400 |
|            54 | 114.82 us | 120.23 us |           59 |                   9723 |        0.972300 |
|            55 | 120.23 us | 125.89 us |           40 |                   9763 |        0.976300 |
|            56 | 125.89 us | 131.83 us |           34 |                   9797 |        0.979700 |
|            57 | 131.83 us | 138.04 us |           33 |                   9830 |        0.983000 |
|            58 | 138.04 us | 144.54 us |           27 |                   9857 |        0.985700 |
|            59 | 144.54 us | 151.36 us |           16 |                   9873 |        0.987300 |
|            60 | 151.36 us | 158.49 us |           25 |                   9898 |        0.989800 |
|            61 | 158.49 us | 165.96 us |           20 |                   9918 |        0.991800 |
|            62 | 165.96 us | 173.78 us |            9 |                   9927 |        0.992700 |
|            63 | 173.78 us | 181.97 us |           11 |                   9938 |        0.993800 |
|            64 | 181.97 us | 190.55 us |           11 |                   9949 |        0.994900 |
|            65 | 190.55 us | 199.53 us |            4 |                   9953 |        0.995300 |
|            66 | 199.53 us | 208.93 us |            6 |                   9959 |        0.995900 |
|            67 | 208.93 us | 218.78 us |            6 |                   9965 |        0.996500 |
|            68 | 218.78 us | 229.09 us |            6 |                   9971 |        0.997100 |
|            69 | 229.09 us | 239.88 us |            3 |                   9974 |        0.997400 |
|            70 | 239.88 us | 251.19 us |            2 |                   9976 |        0.997600 |
|            71 | 251.19 us | 263.03 us |            2 |                   9978 |        0.997800 |
|            72 | 263.03 us | 275.42 us |            2 |                   9980 |        0.998000 |
|            73 | 275.42 us | 288.40 us |            4 |                   9984 |        0.998400 |
|            74 | 288.40 us | 302.00 us |            2 |                   9986 |        0.998600 |
|            75 | 302.00 us | 316.23 us |            2 |                   9988 |        0.998800 |
|            76 | 316.23 us | 331.13 us |            1 |                   9989 |        0.998900 |
|            78 | 346.74 us | 363.08 us |            3 |                   9992 |        0.999200 |
|            79 | 363.08 us | 380.19 us |            2 |                   9994 |        0.999400 |
|            80 | 380.19 us | 398.11 us |            1 |                   9995 |        0.999500 |
|            83 | 436.52 us | 457.09 us |            1 |                   9996 |        0.999600 |
|           100 | 954.99 us | 1.00 ms   |            1 |                   9997 |        0.999700 |
|           101 | 1.00 ms   | 1.05 ms   |            1 |                   9998 |        0.999800 |
|           121 | 2.51 ms   | 2.63 ms   |            1 |                   9999 |        0.999900 |
|           162 | 16.60 ms  | 17.38 ms  |            1 |                  10000 |        1.000000 |
+---------------+-----------+-----------+--------------+------------------------+-----------------+
49 rows in set (0.02 sec)

In this example, 3694 times (the COUNT_BUCKET column) when the query were executed, the query time was between 63.10 microseconds and 66.07 microseconds, so the execution time matched the interval of bucket number 41. There has been at total of 7322 executions (the COUNT_BUCKET_AND_LOWER column) of the query with a query time of 66.07 microseconds or less. This means that 73.22% (the BUCKET_QUANTILE column) of the queries have a query time of 66.07 microseconds or less.

In addition to the shown columns, there is SCHEMA_NAME and DIGEST (which together with BUCKET_NUMBER form a unique key). For each digest there are 450 buckets with the width of the bucket (in terms of difference between the low and high timers) gradually becoming larger and larger. The first, middle, and last five buckets are:

mysql> SELECT BUCKET_NUMBER,
              sys.format_time(BUCKET_TIMER_LOW) AS TimerLow,
              sys.format_time(BUCKET_TIMER_HIGH) AS TimerHigh
         FROM performance_schema.events_statements_histogram_by_digest
        WHERE DIGEST = '9431aed9635923565d7bc92cc36d6411c3abb9f52d2c22715be21b5472e3c366'
              AND (BUCKET_NUMBER < 5 OR BUCKET_NUMBER > 444 OR BUCKET_NUMBER BETWEEN 223 AND 227);
+---------------+-----------+-----------+
| BUCKET_NUMBER | TimerLow  | TimerHigh |
+---------------+-----------+-----------+
|             0 | 0 ps      | 10.00 us  |
|             1 | 10.00 us  | 10.47 us  |
|             2 | 10.47 us  | 10.96 us  |
|             3 | 10.96 us  | 11.48 us  |
|             4 | 11.48 us  | 12.02 us  |
|           223 | 275.42 ms | 288.40 ms |
|           224 | 288.40 ms | 302.00 ms |
|           225 | 302.00 ms | 316.23 ms |
|           226 | 316.23 ms | 331.13 ms |
|           227 | 331.13 ms | 346.74 ms |
|           445 | 2.11 h    | 2.21 h    |
|           446 | 2.21 h    | 2.31 h    |
|           447 | 2.31 h    | 2.42 h    |
|           448 | 2.42 h    | 2.53 h    |
|           449 | 2.53 h    | 30.50 w   |
+---------------+-----------+-----------+
15 rows in set (0.02 sec)

The bucket thresholds are fixed and thus the same for all digests. There is also a global histogram in the events_statements_histogram_global.

This includes the introduction to the new Performance Schema digest features. As monitoring tools start to use this information, it will help create a better monitoring experience. Particularly the histograms will benefit from being shown as graphs.

Build a Custom Toggle Switch with React

$
0
0

Building web applications usually involves making provisions for user interactions. One of the major ways of making provision for user interactions is through forms. Different form components exist for taking different kinds of input from the user. For example, a password component takes sensitive information from a user and masks the information so that it is not visible.

Most times, the information you need to get from a user is boolean-like - for example: yes or no, true or false, enable or disable, on or off, etc. Traditionally, the checkbox form component is used for getting these kinds of input. However, in modern interface designs, toggle switches are commonly used as checkbox replacements, although there are some accessibility concerns.

Checkbox vs Toggle Switch

In this tutorial, we will see how to build a custom toggle switch component with React. At the end of the tutorial, we would have built a very simple demo React app that uses our custom toggle switch component.

Here is a demo of the final application we will be building in this tutorial.

Application Demo

Prerequisites

Before getting started, you need to ensure that you have Node already installed on your machine. I will also recommend that you install the Yarn package manager on your machine, since we will be using it for package management instead of npm that ships with Node. You can follow this Yarn installation guide to install yarn on your machine.

We will create the boilerplate code for our React app using the create-react-app command-line package. You also need to ensure that it is installed globally on your machine. If you are using npm >= 5.2 then you may not need to install create-react-app as a global dependency since we can use the npx command.

Finally, this tutorial assumes that you are already familiar with React. If that is not the case, you can check the React Documentation to learn more about React.

Getting Started

Create new Application

Start a new React application using the following command. You can name the application however you desire.

create-react-app react-toggle-switch

npm >= 5.2If you are using npm version 5.2 or higher, it ships with an additional npx binary. Using the npx binary, you don't need to install create-react-app globally on your machine. You can start a new React application with this simple command:npx create-react-app react-toggle-switch

Install Dependencies

Next, we will install the dependencies we need for our application. Run the following command to install the required dependencies.

yarn add lodash bootstrap prop-types classnames
yarn add -D npm-run-all node-sass-chokidar

We have installed node-sass-chokidar as a development dependency for our application to enable us use SASS. For more information about this, see this guide.

Modify the npm Scripts

Edit the package.json file and modify the scripts section to look like the following:

"scripts": {
  "start:js": "react-scripts start",
  "build:js": "react-scripts build",
  "start": "npm-run-all -p watch:css start:js",
  "build": "npm-run-all build:css build:js",
  "test": "react-scripts test --env=jsdom",
  "eject": "react-scripts eject",
  "build:css": "node-sass-chokidar --include-path ./src --include-path ./node_modules src/ -o src/",
  "watch:css": "npm run build:css && node-sass-chokidar --include-path ./src --include-path ./node_modules src/ -o src/ --watch --recursive"
}

Include Bootstrap CSS

We installed the bootstrap package as a dependency for our application since we will be needing some default styling. To include Bootstrap in the application, edit the src/index.js file and add the following line before every other import statement.

import "bootstrap/dist/css/bootstrap.min.css";

Start the Application

Start the application by running the following command with yarn:

yarn start

The application is now started and development can begin. Notice that a browser tab has been opened for you with live reloading functionality to keep in sync with changes in the application as you develop.

At this point, the application view should look like the following screenshot:

Initial View

The ToggleSwitch Component

Create a new directory named components inside the src directory of your project. Next, create another new directory named ToggleSwitch inside the components directory. Next, create two new files inside src/components/ToggleSwitch, namely: index.js and index.scss.

Add the following content into the src/components/ToggleSwitch/index.js file.

/_ src/components/ToggleSwitch/index.js _/

import PropTypes from 'prop-types';
import classnames from 'classnames';
import isString from 'lodash/isString';
import React, { Component } from 'react';
import isBoolean from 'lodash/isBoolean';
import isFunction from 'lodash/isFunction';
import './index.css';

class ToggleSwitch extends Component {}

ToggleSwitch.propTypes = {
  theme: PropTypes.string,
  enabled: PropTypes.oneOfType([
    PropTypes.bool,
    PropTypes.func
  ]),
  onStateChanged: PropTypes.func
}

export default ToggleSwitch;

In this code snippet, we created the ToggleSwitch component and added typechecks for some of its props.

  • theme - is a string indicating the style and color to be used for the toggle switch.

  • enabled - can be either a boolean or a function that returns a boolean, and it determines the state of the toggle switch when it is rendered.

  • onStateChanged - is a callback function that will be called when the state of the toggle switch changes. This is useful for triggering actions on the parent component when the switch is toggled.

Initializing the ToggleSwitch State

In the following code snippet, we initialize the state of the ToggleSwitch component and define some component methods for getting the state of the toggle switch.

/_ src/components/ToggleSwitch/index.js _/

class ToggleSwitch extends Component {

  state = { enabled: this.enabledFromProps() }

  isEnabled = () => this.state.enabled

  enabledFromProps() {
    let { enabled } = this.props;

    // If enabled is a function, invoke the function
    enabled = isFunction(enabled) ? enabled() : enabled;

    // Return enabled if it is a boolean, otherwise false
    return isBoolean(enabled) && enabled;
  }

}

Here, the enabledFromProps() method resolves the enabled prop that was passed and returns a boolean indicating if the switch should be enabled when it is rendered. If enabled prop is a boolean, it returns the boolean value. If it is a function, it first invokes the function before determining if the returned value is a boolean. Otherwise, it returns false.

Notice that we used the return value from enabledFromProps() to set the initial enabled state. Also, we have added the isEnabled() method to get the current enabled state.

Toggling the ToggleSwitch

Let's go ahead and add the method that actually toggles the switch when it is clicked.

/_ src/components/ToggleSwitch/index.js _/

class ToggleSwitch extends Component {

  // ...other class members here

  toggleSwitch = evt => {
    evt.persist();
    evt.preventDefault();

    const { onClick, onStateChanged } = this.props;

    this.setState({ enabled: !this.state.enabled }, () => {
      const state = this.state;

      // Augument the event object with SWITCH_STATE
      const switchEvent = Object.assign(evt, { SWITCH_STATE: state });

      // Execute the callback functions
      isFunction(onClick) && onClick(switchEvent);
      isFunction(onStateChanged) && onStateChanged(state);
    });
  }

}

Since this method will be triggered as a click event listener, we have declared it with the evt parameter. First, this method toggles the current enabled state using the logical NOT (!) operator. When the state has been updated, it triggers the callback functions passed to the onClick and onStateChanged props.

Notice that since onClick requires an event as its first argument, we augmented the event with an additional SWITCH_STATE property containing the new state object. However, the onStateChanged callback is called with the new state object.

Rendering the ToggleSwitch

Finally, let's implement the render() method of the ToggleSwitch component.

/_ src/components/ToggleSwitch/index.js _/

class ToggleSwitch extends Component {

  // ...other class members here

  render() {
    const { enabled } = this.state;

    // Isolate special props and store the remaining as restProps
    const { enabled: _enabled, theme, onClick, className, onStateChanged, ...restProps } = this.props;

    // Use default as a fallback theme if valid theme is not passed
    const switchTheme = (theme && isString(theme)) ? theme : 'default';

    const switchClasses = classnames(
      `switch switch--${switchTheme}`,
      className
    )

    const togglerClasses = classnames(
      'switch-toggle',
      `switch-toggle--${enabled ? 'on' : 'off'}`
    )

    return (
      <div className={switchClasses} onClick={this.toggleSwitch} {...restProps}>
        <div className={togglerClasses}></div>
      </div>
    )
  }

}

A lot is going on in this render() method - so let's try to break it down.

  1. First, the enabled state is destructured from the component state.

  2. Next, we destructure the component props and extract the restProps that will be passed down to the switch. This enables us to intercept and isolate the special props of the component.

  3. Next, we use classnames to construct the classes for the switch and the inner toggler, based on the theme and the enabled state of the component.

  4. Finally, we render the DOM elements with the appropriate props and classes. Notice that we passed in this.toggleSwitch as the click event listener on the switch.

Styling the ToggleSwitch

Now that we have the ToggleSwitch component and its required functionality, we will go ahead and write the styles for the toggle switch.

Add the following code snippet to the src/components/ToggleSwitch/index.scss file you created earlier:

/_ src/components/ToggleSwitch/index.scss _/

// DEFAULT COLOR VARIABLES

$ball-color: #ffffff;
$active-color: #62c28e;
$inactive-color: #cccccc;

// DEFAULT SIZING VARIABLES

$switch-size: 32px;
$ball-spacing: 2px;
$stretch-factor: 1.625;

// DEFAULT CLASS VARIABLE

$switch-class: 'switch-toggle';

/_ SWITCH MIXIN _/

@mixin switch($size: $switch-size, $spacing: $ball-spacing, $stretch: $stretch-factor, $color: $active-color, $class: $switch-class) {}

Here, we defined some default variables and created a switch mixin. In the next section, we will we will implement the mixin, but first, let's examine the parameters of the switch mixin:

  • $size - The height of the switch element. It must have a length unit. It defaults to 32px.

  • $spacing - The space between the circular ball and the switch container. It must have a length unit. It defaults to 2px.

  • $stretch - A factor used to determine the extent to which the width of the switch element should be stretched. It must be a unitless number. It defaults to 1.625.

  • $color - The color of the switch when in active state. This must be a valid color value. Note that the circular ball is always white irrespective of this color.

  • $class - The base class for identifying the switch. This is used to dynamically create the state classes of the switch. It defaults to 'switch-toggle'. Hence, the default state classes are .switch-toggle--on and .switch-toggle--off.

Implementing the Switch Mixin

Here is the implementation of the switch mixin:

/_ src/components/ToggleSwitch/index.scss _/

@mixin switch($size: $switch-size, $spacing: $ball-spacing, $stretch: $stretch-factor, $color: $active-color, $class: $switch-class) {

  // SELECTOR VARIABLES

  $self: '.' + $class;
  $on: #{$self}--on;
  $off: #{$self}--off;

  // SWITCH VARIABLES

  $active-color: $color;
  $switch-size: $size;
  $ball-spacing: $spacing;
  $stretch-factor: $stretch;
  $ball-size: $switch-size - ($ball-spacing _ 2);
  $ball-slide-size: ($switch-size _ ($stretch-factor - 1) + $ball-spacing);

  // SWITCH STYLES

  height: $switch-size;
  width: $switch-size * $stretch-factor;
  cursor: pointer !important;
  user-select: none !important;
  position: relative !important;
  display: inline-block;

  &#{$on},
  &#{$off} {

    &::before,
    &::after {
      content: '';
      left: 0;
      position: absolute !important;
    }

    &::before {
      height: inherit;
      width: inherit;
      border-radius: $switch-size / 2;
      will-change: background;
      transition: background .4s .3s ease-out;
    }

    &::after {
      top: $ball-spacing;
      height: $ball-size;
      width: $ball-size;
      border-radius: $ball-size / 2;
      background: $ball-color !important;
      will-change: transform;
      transition: transform .4s ease-out;
    }

  }

  &#{$on} {
    &::before {
      background: $active-color !important;
    }
    &::after {
      transform: translateX($ball-slide-size);
    }
  }

  &#{$off} {
    &::before {
      background: $inactive-color !important;
    }
    &::after {
      transform: translateX($ball-spacing);
    }
  }

}

In this mixin, we start by setting some variables based on the parameters passed to the mixin. Then we go ahead, creating the styles. Notice that we are using the ::after and ::before pseudo-elements to dynamically create the components of the switch. ::before creates the switch container while ::after creates the circular ball.

Also notice how we constructed the state classes from the base class and assign them to variables. The $on variable maps to the selector for the enabled state, while the $off variable maps to the selector for the disabled state.

We also ensured that the base class (.switch-toggle) must be used together with a state class (.switch-toggle--on or .switch-toggle--off) for the styles to be available. Hence, we used the &#{$on} and &#{$off} selectors.

Creating Themed Switches

Now that we have our switch mixin, we will continue to create some themed styles for the toggle switch. We will create two themes, namely: default and graphite-small.

Append the following code snippet to the src/components/ToggleSwitch/index.scss file.

/_ src/components/ToggleSwitch/index.scss _/

@function get-switch-class($selector) {

  // First parse the selector using `selector-parse`
  // Extract the first selector in the first list using `nth` twice
  // Extract the first simple selector using `simple-selectors` and `nth`
  // Extract the class name using `str-slice`

  @return str-slice(nth(simple-selectors(nth(nth(selector-parse($selector), 1), 1)), 1), 2);

}

.switch {
  $self: &;
  $toggle: #{$self}-toggle;
  $class: get-switch-class($toggle);

  // default theme
  &#{$self}--default > #{$toggle} {

    // Always pass the $class to the mixin
    @include switch($class: $class);

  }

  // graphite-small theme
  &#{$self}--graphite-small > #{$toggle} {

    // A smaller switch with a `gray` active color
    // Always pass the $class to the mixin
    @include switch($color: gray, $size: 20px, $class: $class);

  }
}

Here we first create a Sass function named get-switch-class that takes a $selector as parameter. It runs the $selector through a chain of Sass functions and tries to extract the first class name. For example, if it receives:

  • .class-1 .class-2, .class-3 .class-4, it returns class-1.

  • .class-5.class-6 > .class-7.class-8, it returns class-5.

Next, we define styles for the .switch class. We dynamically set the toggle class to .switch-toggle and assign it to the $toggle variable. Notice that we assign the class name returned from the get-switch-class() function call to the $class variable. Finally, we include the switch mixin with the necessary parameters to create the theme classes.

Notice that the structure of the selector for the themed switch looks like this: &#{$self}--default > #{$toggle} (using the default theme as an example). Putting everything together, this means that the elements hierarchy should look like the following in order for the styles to be applied:

<!-- Use the default theme: switch--default  -->
<element class="switch switch--default">

  <!-- The switch is in enabled state: switch-toggle--on -->
  <element class="switch-toggle switch-toggle--on"></element>

</element>

Here is a simple demo showing what the toggle switch themes look like:

Switch Themes

Building the Sample App

Now that we have the ToggleSwitch React component with the required styling, let's go ahead and start creating the sample app we saw at the beginning section.

Modify the src/App.js file to look like the following code snippet:

/_ src/App.js _/

import classnames from 'classnames';
import snakeCase from 'lodash/snakeCase';
import React, { Component } from 'react';
import Switch from './components/ToggleSwitch';
import './App.css';

// List of activities that can trigger notifications
const ACTIVITIES = [
  'News Feeds', 'Likes and Comments', 'Live Stream', 'Upcoming Events',
  'Friend Requests', 'Nearby Friends', 'Birthdays', 'Account Sign-In'
];

class App extends Component {

  // Initialize app state, all activities are enabled by default
  state = { enabled: false, only: ACTIVITIES.map(snakeCase) }

  toggleNotifications = ({ enabled }) => {
    const { only } = this.state;
    this.setState({ enabled, only: enabled ? only : ACTIVITIES.map(snakeCase) });
  }

  render() {
    const { enabled } = this.state;

    const headingClasses = classnames(
      'font-weight-light h2 mb-0 pl-4',
      enabled ? 'text-dark' : 'text-secondary'
    );

    return (
      <div className="App position-absolute text-left d-flex justify-content-center align-items-start pt-5 h-100 w-100">
        <div className="d-flex flex-wrap mt-5" style={{width: 600}}>

          <div className="d-flex p-4 border rounded align-items-center w-100">
            <Switch theme="default"
              className="d-flex"
              enabled={enabled}
              onStateChanged={this.toggleNotifications}
            />

            <span className={headingClasses}>Notifications</span>
          </div>

          {/_ ...Notification options here... _/}

        </div>
      </div>
    );
  }

}

export default App;

Here we initialize the ACTIVITIES constant with an array of activities that can trigger notifications. Next, we initialized the app state with two properties:

  • enabled - a boolean that indicates whether notifications are enabled.

  • only - an array that contains all the activities that are enabled to trigger notifications.

Notice that we used the snakeCase utility from Lodash to convert the activities to snakecase before updating the state. Hence, 'News Feeds' becomes 'news_feeds'.

Next, we defined the toggleNotifications() method that updates the app state based on the state it receives from the notification switch. This is used as the callback function passed to the onStateChanged prop of the toggle switch. Notice that when the app is enabled, all activities will be enabled by default, since the only state property is populated with all the activities.

Finally, we rendered the DOM elements for the app and left a slot for the notification options which will be added soon. At this point, the app should look like the following screenshot:

Initial App View

Next go ahead and look for the line that has this comment:

{/_ ...Notification options here... _/}

and replace it with the following content in order to render the notification options:

{ enabled && (

  <div className="w-100 mt-5">
    <div className="container-fluid px-0">

      <div className="pt-5">
        <div className="d-flex justify-content-between align-items-center">
          <span className="d-block font-weight-bold text-secondary small">Email Address</span>
          <span className="text-secondary small mb-1 d-block">
            <small>Provide a valid email address with which to receive notifications.</small>
          </span>
        </div>

        <div className="mt-2">
          <input type="text" placeholder="mail@domain.com" className="form-control" style={{ fontSize: 14 }} />
        </div>
      </div>

      <div className="pt-5 mt-4">
        <div className="d-flex justify-content-between align-items-center border-bottom pb-2">
          <span className="d-block font-weight-bold text-secondary small">Filter Notifications</span>
          <span className="text-secondary small mb-1 d-block">
            <small>Select the account activities for which to receive notifications.</small>
          </span>
        </div>

        <div className="mt-5">
          <div className="row flex-column align-content-start" style={{ maxHeight: 180 }}>
            { this.renderNotifiableActivities() }
          </div>
        </div>
      </div>

    </div>
  </div>

) }

Notice here that we made a call to this.renderNotifiableActivities() to render the activities. Let's go ahead and implement this method and the other remaining methods.

Add the following methods to the App component.

/_ src/App.js _/

class App extends Component {

  toggleActivityEnabled = activity => ({ enabled }) => {
    let { only } = this.state;

    if (enabled && !only.includes(activity)) {
      only.push(activity);
      return this.setState({ only });
    }

    if (!enabled && only.includes(activity)) {
      only = only.filter(item => item !== activity);
      return this.setState({ only });
    }
  }

  renderNotifiableActivities() {
    const { only } = this.state;

    return ACTIVITIES.map((activity, index) => {
      const key = snakeCase(activity);
      const enabled = only.includes(key);

      const activityClasses = classnames(
        'small mb-0 pl-3',
        enabled ? 'text-dark' : 'text-secondary'
      );

      return (
        <div key={index} className="col-5 d-flex mb-3">
          <Switch theme="graphite-small"
            className="d-flex"
            enabled={enabled}
            onStateChanged={ this.toggleActivityEnabled(key) }
          />

          <span className={activityClasses}>{ activity }</span>
        </div>
      );
    })
  }

}

Here, we have implemented the renderNotifiableActivities method. We iterate through all the activities using ACTIVITIES.map() and render each with a toggle switch for it. Notice that the toggle switch uses the graphite-small theme. We also detect the enabled state of each activity by checking whether it already exists in the only state variable.

Finally, we defined the toggleActivityEnabled method which was used to provide the callback function for the onStateChanged prop of each activity's toggle switch. We defined it as a higher-order function so that we can pass the activity as argument and return the callback function. It checks if an activity is already enabled and updates the state accordingly.

Now the app should look like the following screenshot:

Final App View

If you prefer to have all the activities disabled by default instead of enabled as shown in the initial screenshot, then you could make the following changes to the App component:

/_ src/App.js _/

class App extends Component {

  // Initialize app state, all activities are disabled by default
  state = { enabled: false, only: [] }

  toggleNotifications = ({ enabled }) => {
    const { only } = this.state;
    this.setState({ enabled, only: enabled ? only : [] });
  }

}

Accessibility Concerns

Using toggle switches in our applications instead of traditional checkboxes can enable us create neater interfaces, especially considering the fact that it is difficult to style a traditional checkbox however we want.

However, using toggle switches instead of checkboxes has some accessibility issues, since the user-agent may not be able to interpret the component's function correctly.

A few things can be done to improve the accessibility of the toggle switch and enable user-agents to understand the role correctly. For example, you can use the following ARIA attributes:

<switch-element tabindex="0" role="switch" aria-checked="true" aria-labelledby="#label-element"></switch-element>

You can also listen to more events on the toggle switch to create more ways the user can interact with the component.

Conclusion

In this tutorial, we have been able to create a custom toggle switch for our React applications with proper styling that supports different themes. We have also been able to see how we can use it in our application instead of traditional checkboxes and the accessibility concerns involved.

For the complete sourcecode of this tutorial, checkout the react-toggle-switch-demo repository on Github. You can also get a live demo of this tutorial on Code Sandbox.

Viewing all 18840 articles
Browse latest View live


<script src="https://jsc.adskeeper.com/r/s/rssing.com.1596347.js" async> </script>