In MySQL 8.0.18, we enhanced the Group Communication System (GCS) layer used by Group Replication (GR) with the ability to use and configure member-to-member connections using TLS v1.3. Therefore, you can secure further your system’s communication with the latest security algorithms.…
↧
Support for TLS 1.3 in Group Replication
↧
FOSDEM MySQL, MariaDB & Frieds Devroom 2020 Committee
The Mysql, MariaDB and Friends Devroom is pleased to announce the committee that will decide on the talks to be presented. Every year we are overwhelmed with submissions and it’s the committee that have the thankless task of deciding on the final selections – last year we had 67 submissions to reduce down to 17 final selections,
This year’s committee members are:
Marco Tusa (Percona)
Kenny Gryp (MySQL)
Vicențiu Ciorbaru (MariaDB Foundation)
Matthias Crauwels (Pythian)
Giuseppe Maxia (Community)
Federico Razzoli (Community)
Simon Mudd (Community)
Øystein Grøvlen (Alibaba/Community)
The CFP is open until 20 November so get submitting, and we look forward to seeing you at FOSDEM!
↧
↧
Foreign Key bugs in MySQL and MariaDB
Foreign keys are a controversial topic. MySQL and MariaDB implementation has several bugs and limitations, that are discussed here.
↧
MySQL load data infile made faster .
Loading any large file into MySQL server using the LOAD DATA INFILE is a time consuming process , because it is single threaded and it is a single transaction too. But with modern hardwares system resource is not a bottle neck. At Mydbops we focus on improving the efficiency of process as we value performance more. MySQL introduced the parallel load data operations in its latest minor release MySQL 8.0.17 . I had the curiosity to test this feature and wanted to know, how it can improve the data loading comparing to the existing single threaded method . Through this blog I am going to compare the both methods .
Remember you can use the parallel data loading utility only via MySQL Shell .
Internal Work Flow :
This section describes the working flow of the parallel data loading in MySQL 8.0.17 .
- The importTable utility will analyse the input data file
- The importTable utility will divide the large file into chunks
- The importTable utility will update the chunks to destination MySQL server with parallel threads
Lab Environment :
Below is the server configuration , which I was used to test the data loading operation .
- 4 core CPU
- 8 GB RAM
- SSD Disk
- Centos 7
I have a CSV file to be loaded , the size of the file is around 8 GB .
sakthisrii:mysql-files sakthivel$ ls -lrth
-rw-r--r-- 1 root _mysql 8.06G Sep 12 18:16 load_data.csv
Let’s start the test with the existing method ( single threaded LOAD DATA INFILE ) .
Loading via load data infile:
MySQL localhost:33060+ ssl osm SQL > load data infile '/usr/local/mysql/mysql-files/load_data.csv' into table single.single_load fields terminated by ',' optionally enclosed by '"' lines terminated by '\n' (user_id,visible,name,size,latitude,longitude,timestamp,public,description,inserted);

Query OK, 14244516 rows affected, 0 warnings (39 min 35.5036 sec)
Records: 14244516 Deleted: 0 Skipped: 0 Warnings: 0
Well it took 39 minutes and 36 seconds . No, I am going to load same data on a different table , with new Muti threaded in MySQL shell utility .
With multi threaded in MySQL Shell.
MySQL localhost osm JS > util.importTable("/usr/local/mysql/mysql-files/load_data.csv", {schema: "parallel", table: "parallel_load", columns: ["user_id","visible","name","size","latitude","longitude","timestamp","public","description","inserted"], dialect: "csv-unix", skipRows: 0, showProgress: true, fieldsOptionallyEnclosed: true, fieldsTerminatedBy: ",", linesTerminatedBy: "\n",fieldsEnclosedBy: '"',threads: 8, bytesPerChunk: "1G", maxRate: "2G"})

Importing from file '/usr/local/mysql/mysql-files/load_data.csv' to table `parallel`.`parallel_load` in MySQL Server at /tmp%2Fmysql.sock using 8 threads
[Worker01] parallel.parallel_load: Records: 1780564 Deleted: 0 Skipped: 0 Warnings: 0
 [Worker02] parallel.parallel_load: Records: 1780564 Deleted: 0 Skipped: 0 Warnings: 0
 [Worker03] parallel.parallel_load: Records: 1780564 Deleted: 0 Skipped: 0 Warnings: 0
 [Worker04] parallel.parallel_load: Records: 1780564 Deleted: 0 Skipped: 0 Warnings: 0
 [Worker05] parallel.parallel_load: Records: 1780564 Deleted: 0 Skipped: 0 Warnings: 0
 [Worker06] parallel.parallel_load: Records: 1780564 Deleted: 0 Skipped: 0 Warnings: 0
 [Worker07] parallel.parallel_load: Records: 1780564 Deleted: 0 Skipped: 0 Warnings: 0
 [Worker08] parallel.parallel_load: Records: 1780564 Deleted: 0 Skipped: 0 Warnings: 0

100% (8.06 GB / 8.06 GB), 535.17 KB/s
File '/usr/local/mysql/mysql-files/load_data.csv' (8.06 GB) was imported in 6 min 30.0411 sec at 18.81 MB/s
Total rows affected in parallel.parallel_load: Records: 14244516 Deleted: 0 Skipped: 0 Warnings: 0
Yes, It took only 6 minutes and 30 seconds . This is 6x faster than the single threaded method and improved the speed tremendously.

Options needs to be taken care :
Below are the important options which involved in the performance of effective data loading. Every thresholds should be provided with the optimal values based on the available system resources ( CPU / RAM / Disk IOPS ) else it can degrade the performance.
- Threads
- BytesPerChunk
- MaxRate
Threads :
You can define the number of parallel threads to process the data from the input file to the target server. The default value is 8 threads
BytesPerChunk :
This defines the size of the chunk for each LOAD DATA call . All the threads will process the separate chunk during the operation . We can define the threshold based on the available core and file size .
MaxRate:
The maximum limit on data throughput in bytes per second per thread. Use this option if you need to avoid saturating the network or the I/O or CPU for the client host or target server.
Hope this blog helps to identify the difference between the existing load data operation and latest MySQL Shell utility parallel data loading operation . At Mydbops, We are keep testing the new things on MySQL and related tools, will be back soon with an exciting blog soon.
Featured image by Joao Marcelo Marques on Unsplash
↧
MySQL EXPLAIN ANALYZE

MySQL 8.0.18 was just released, and it contains a brand new feature to analyze and understand how queries are executed: EXPLAIN ANALYZE.
What is it?
EXPLAIN ANALYZE is a profiling tool for your queries that will show you where MySQL spends time on your query and why.…
↧
↧
Dirty reads in High Availability solution
Understand dirty reads when using ProxySQL
Recently I had been asked to dig a bit about WHY some user where getting dirty reads when using PXC and ProxySQL.
While the immediate answer was easy, I had taken that opportunity to dig a bit more and buildup a comparison between different HA solutions.
For the ones that cannot wait, the immediate answer is …drum roll, PXC is based on Galera replication, and as I am saying from VERY long time (2011), Galera replication is virtually synchronous. Given that if you are not careful you MAY hit some dirty reads, especially if configured incorrectly.
There is nothing really bad here, we just need to know how to handle it right.
In any case the important thing is to understand some basic concepts.
Two ways of seeing the world (the theory)
Once more let us talk about data-centric approach and data-distributed.
We can have one data state:
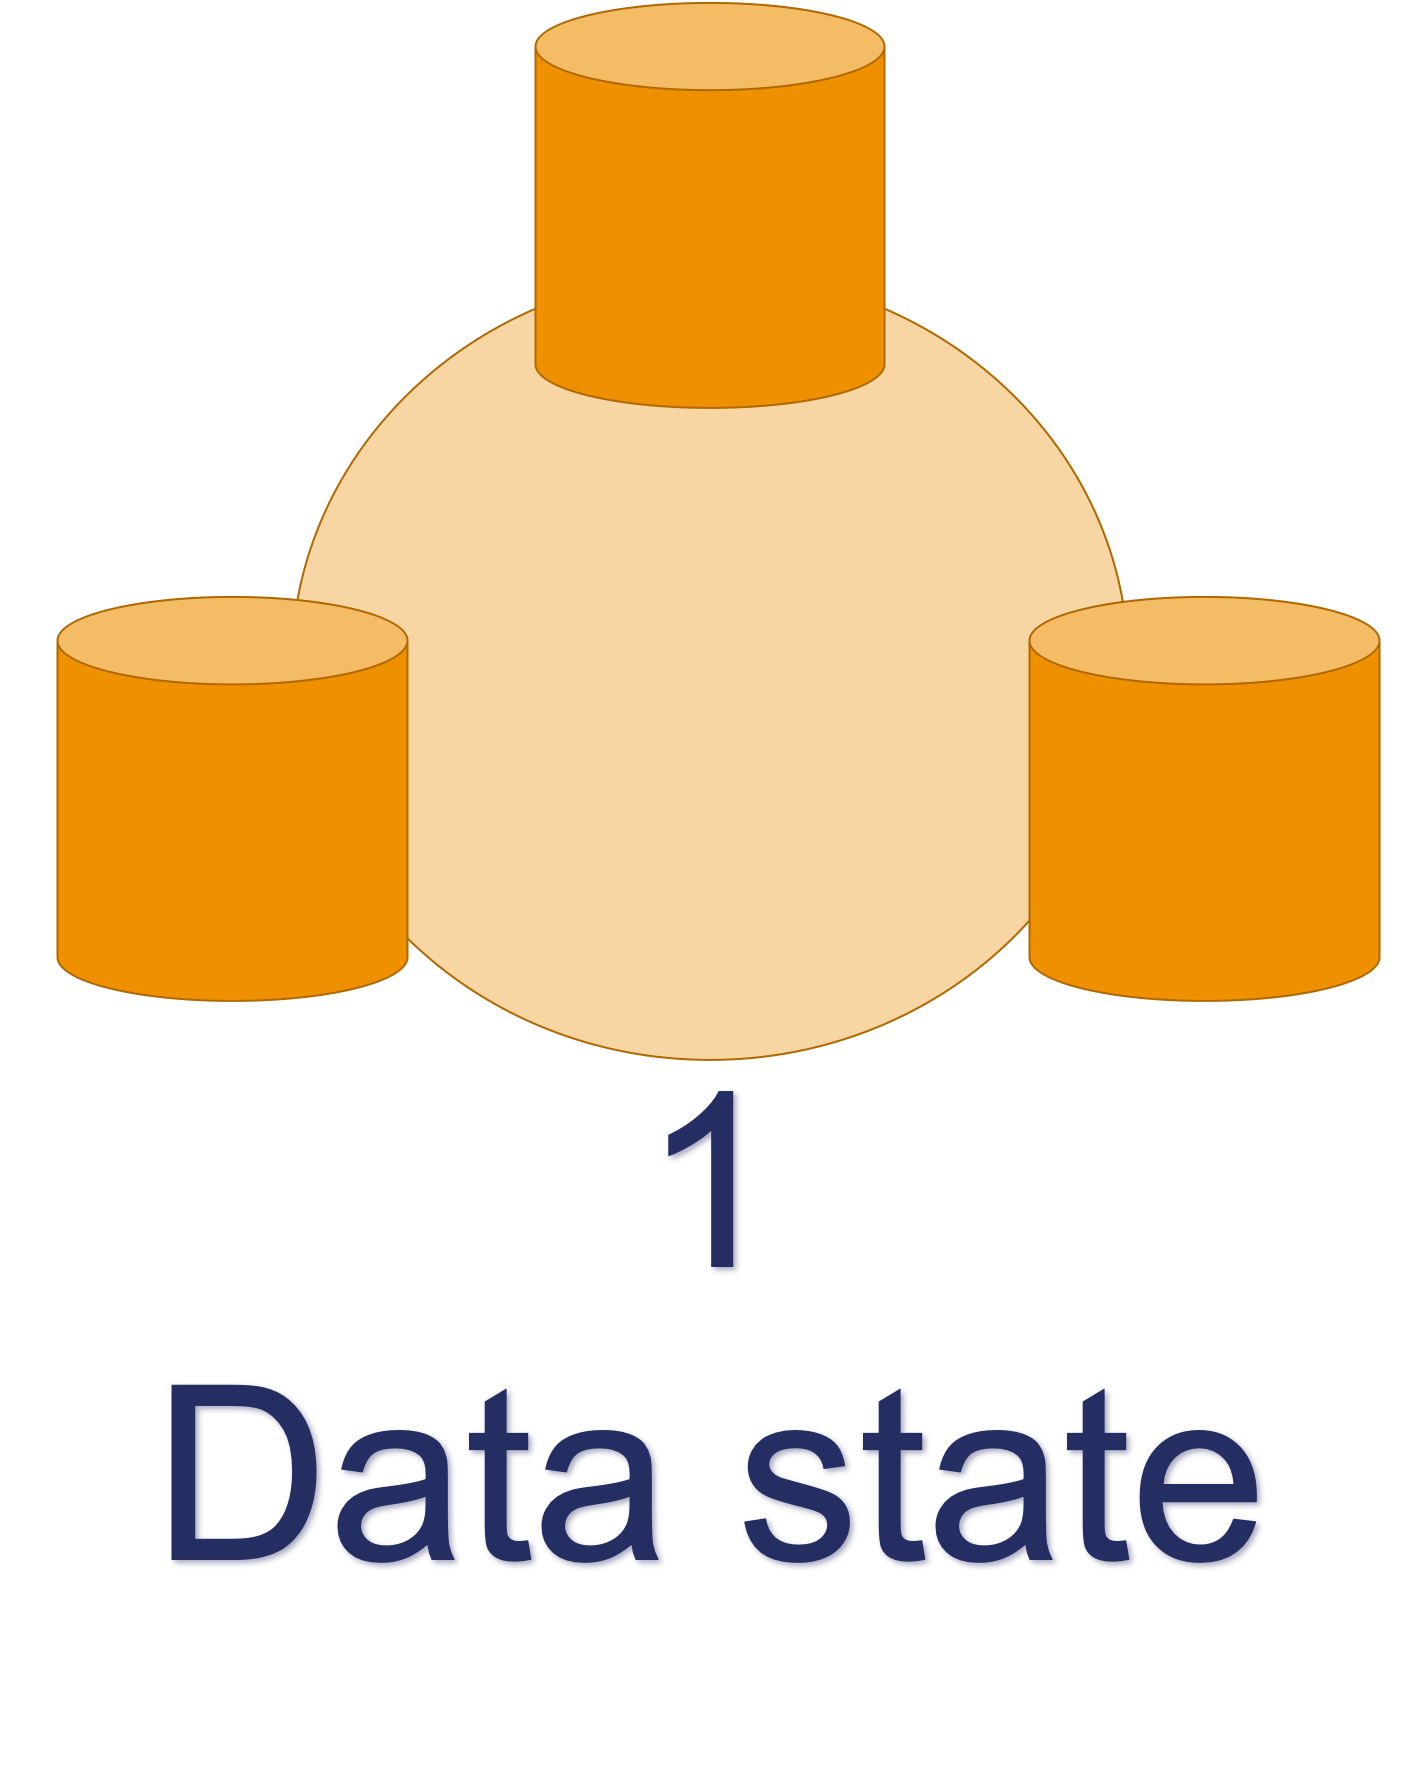
Where all the data nodes see a single state of the data. This is it, you will consistently see the same data at a given T moment in time, where T is the moment of commit on the writer.
Or we have data distributed:
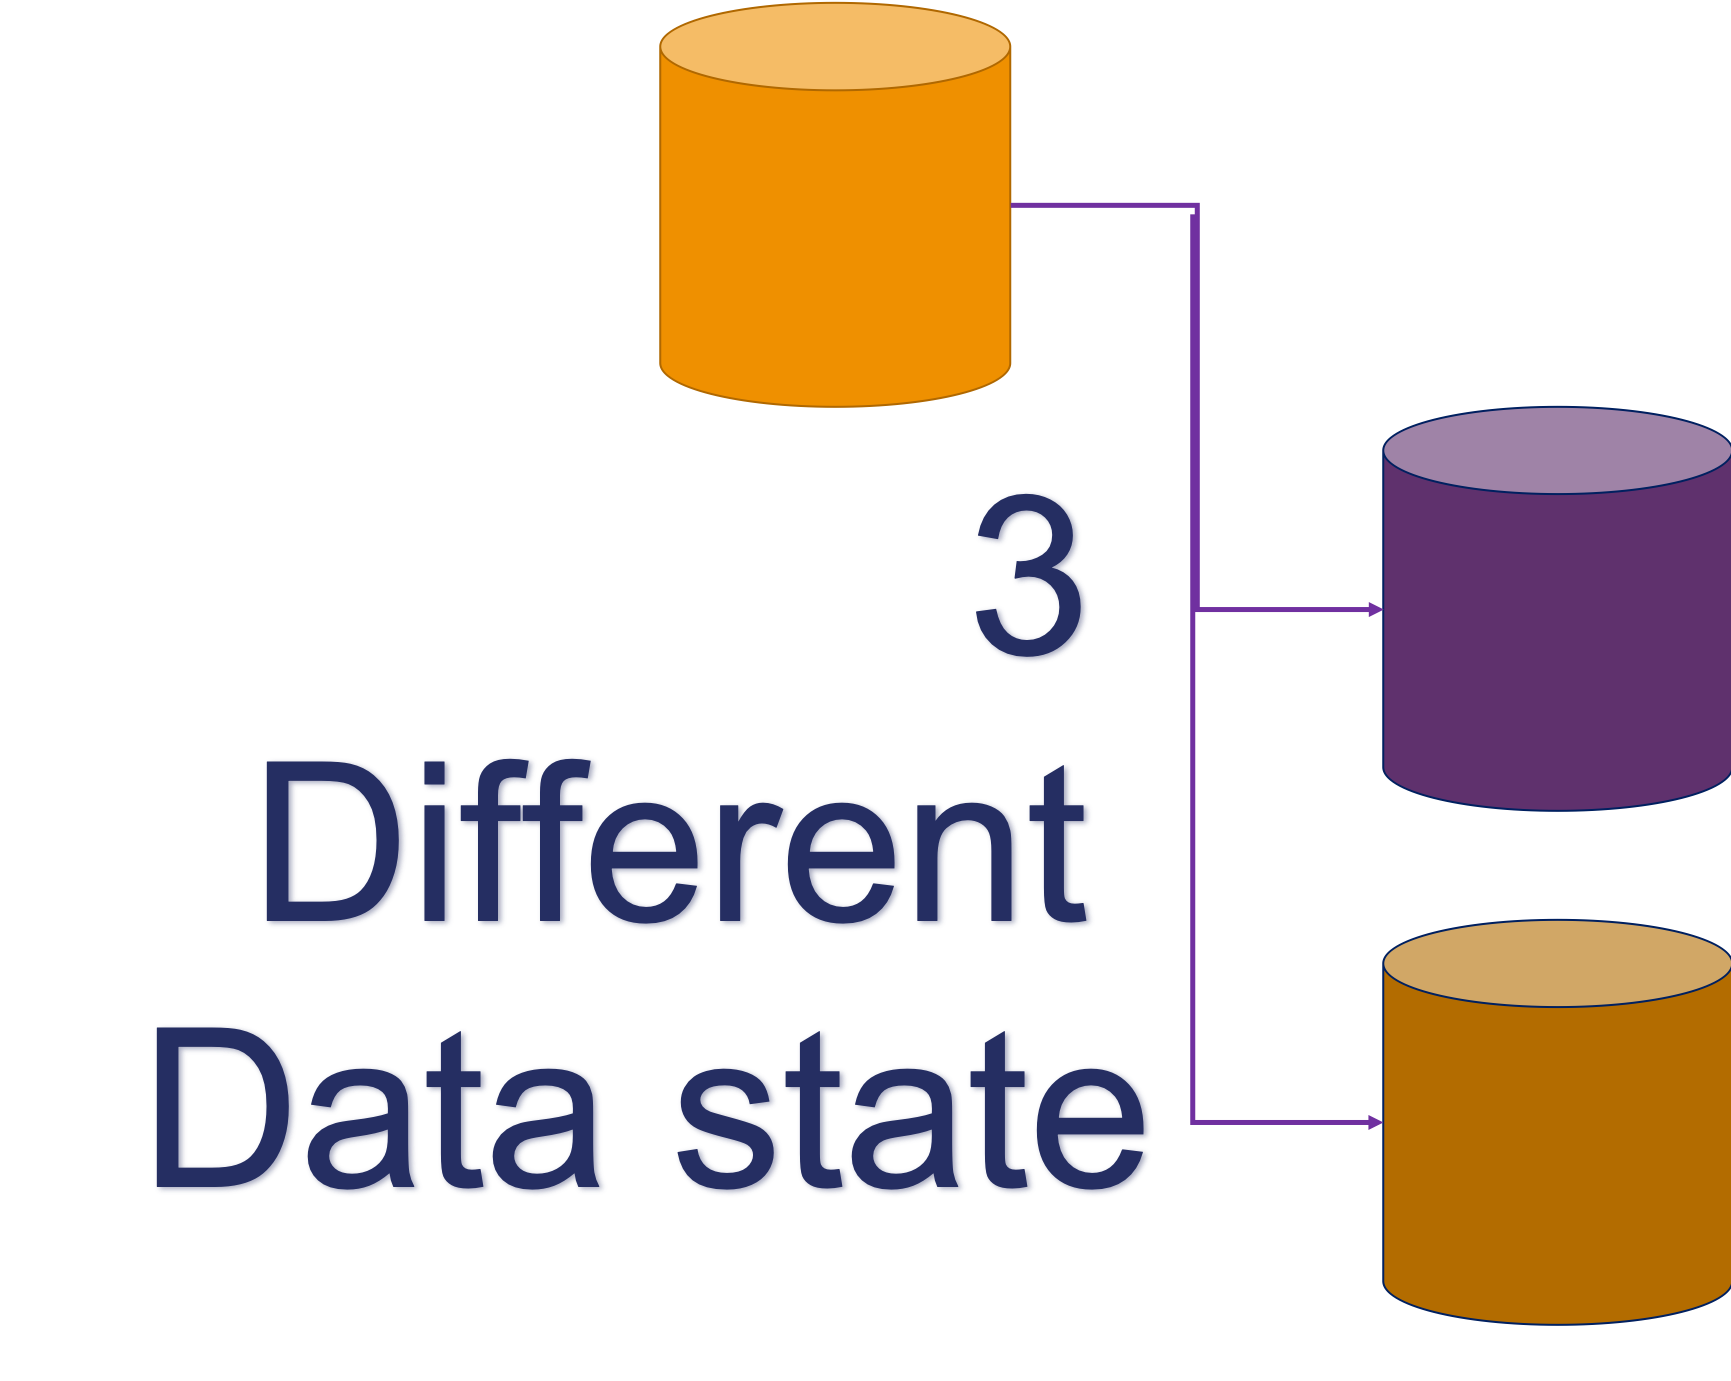
Where each node has an independent data state. This means that data can be visible on the writer, but not yet visible on another node at the moment of commit, and that there is no guarantee that data will be passed over in a given time.
The two extremes can be summarized as follow:
|
Tightly coupled database clusters
|
Loosely coupled database clusters
|
Two ways of seeing the world (the reality)
Given life is not perfect and we do not have only extremes, the most commonly used MySQL solution find their place covering different points in the two-dimensional Cartesian coordinate system:
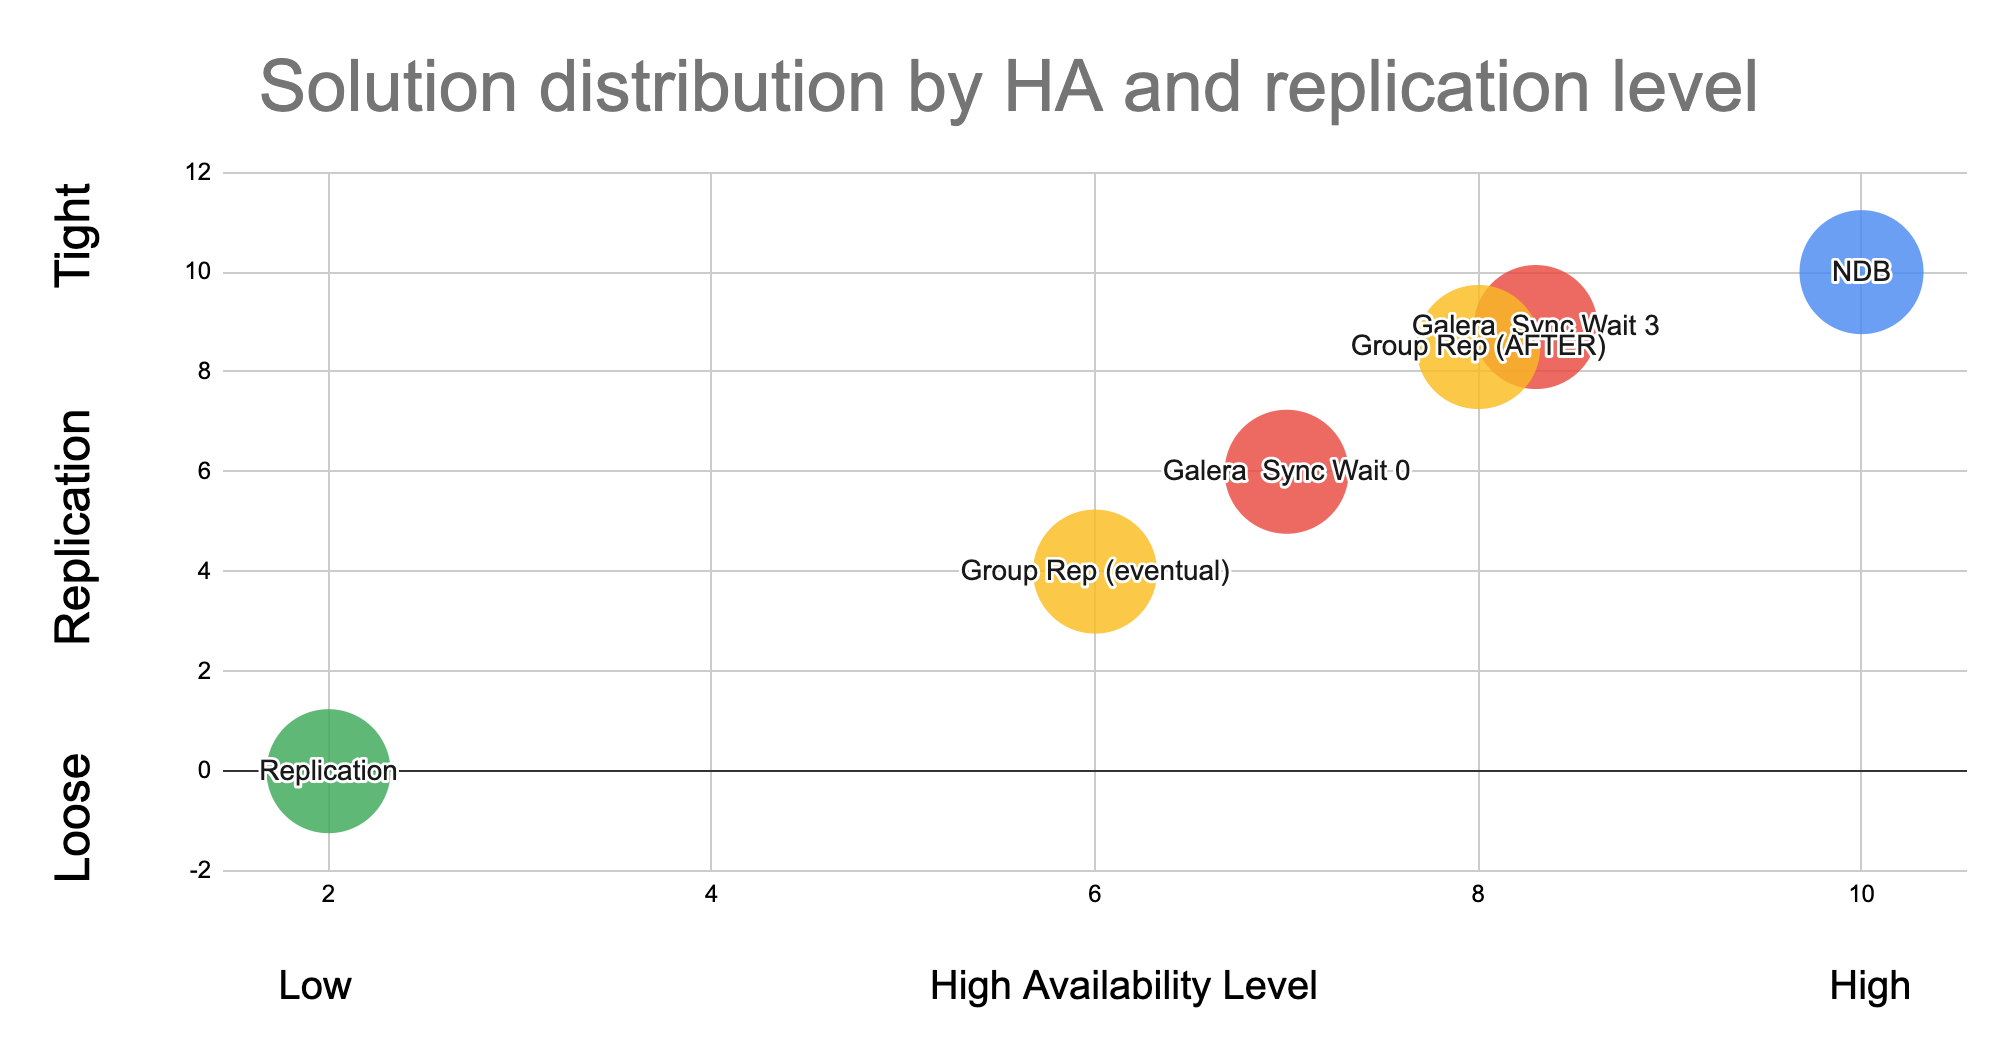
This graph has the level of high availability on the X axis and the level of Loose – Tight relation on the Y axis.
As said I am only considering the most used solutions:
- MySQL – NDB cluster
- Solutions based on Galera
- MySQL Group replication / InnoDB Cluster
- Basic Asynchronous MySQL replication
InnoDB Cluster and Galera are present in two different positions, while the others take a unique position in the graph. At the two extreme position we have Standard replication, which is the one less tight and less HA, and NDB Cluster who is the tightest solution and higher HA.
Translating this into our initial problem, it means that when using NDB we NEVER have Dirty Reads, while when we use standard replication we know this will happen.
Another aspect we must take in consideration when reviewing our solutions, is that nothing come easy. So, the more we want to move to the Right-Top corner the more we need to be ready to give. This can be anything, like performance, functionalities, easy to manage, etc.
When I spoke about the above the first time, I got a few comments, the most common was related on why I decided to position them in that way and HOW I did test it.
Well initially I had a very complex approach, but thanks to the issue with the Dirty Reads and the initial work done by my colleague Marcelo Altman, I can provide a simple empiric way that you can replicate just use the code and instructions from HERE.
Down into the rabbit hole
The platform
To perform the following tests, I have used:
- A ProxySQL server
- An NDB cluster of 3 MySQL nodes 6 data nodes (3 Node Groups)
- A cluster of 3 PXC 5.7 single writer
- An InnoDB cluster 3 nodes single writer
- A 3 nodes MySQL replica set
- 1 Application node running a simple Perl script
All nodes where connected with dedicated backbone network, different from front end receiving data from the script.
The tests
I have run the same simple test script with the same set of rules in ProxySQL.
For Galera and InnoDB cluster I had used the native support in ProxySQL, also because I was trying to emulate the issues I was asked to investigate.
For Standard replication and NDB I had used the mysql_replication_hostgroup settings, with the difference that the later one had 3 Writers, while basic replication has 1 only.
Finally, the script was a single threaded operation, creating a table in the Test schema, filling it with some data, then read the Ids in ascending order, modify the record with update, and try to read immediately after.
When doing that with ProxySQL, the write will go to the writer Host Group (in our case 1 node also for NDB, also if this is suboptimal), while reads are distributed cross the READ Host Group. If for any reason an UPDATE operation is NOT committed on one of the nodes being part of the Reader HG, we will have a dirty read.
Simple no?!
The results
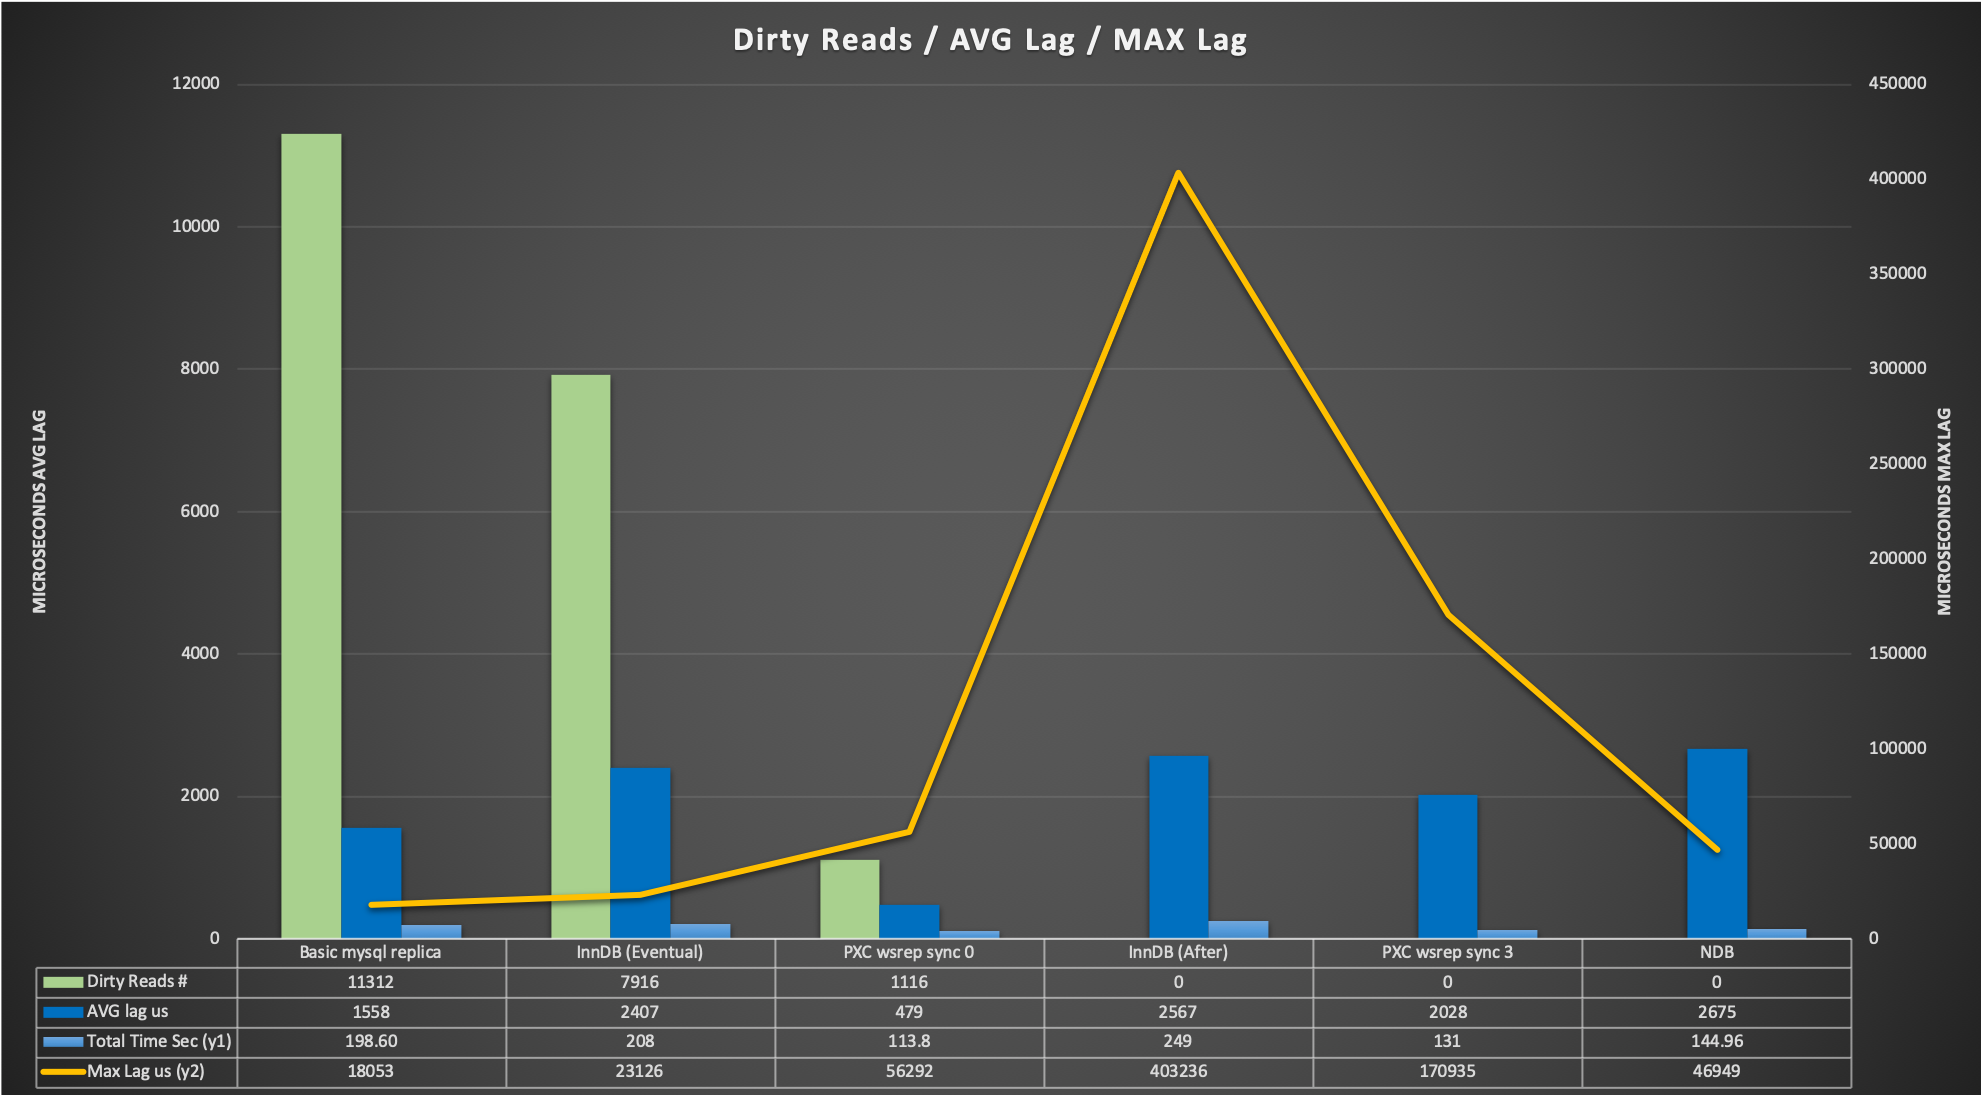
Let us review the graph. Number of dirty reads significantly reduce moving from left to the right of the graph, dropping from 70% of the total with basic replication to the 0.06% with Galera (sync_wait =0).
The average lag is the average time taken from the update commit to when the script returns the read with the correct data.
It is interesting to note a few factors:
- The average cost time in GR between EVENTUAL and AFTER is negligible
- Galera average cost between sync_wait=0 and sync_wait=3 is 4 times longer
- NDB is getting an average cost that is in line with the other BUT its max Lag is very low, so the fluctuation because the synchronization is minimal (respect to the others)
- GR and Galera can have 0 dirty reads but they need to be configured correctly.
Describing a bit more the scenario, MySQL NDB cluster is the best, period! Less performant in single thread than PXC but this is expected, given NDB is designed to have a HIGH number of simultaneous transactions with very limited impact. Aside that it has 0 dirty pages no appreciable lag between writer commit – reader.
On the other side of the spectrum we have MySQL replication with the highest number of dirty reads, still performance was not bad but data is totally inconsistent.
Galera (PXC implementation) is the faster solution when single threaded and has only 0.06% of dirty reads with WSREP_SYNC_WAIT=0, and 0 dirty pages when SYNC_WAIT=3.
About galera we are seen and paying something that is like that by design. A very good presentation (https://www.slideshare.net/lefred.descamps/galera-replication-demystified-how-does-it-work) from Fred Descamps explain how the whole thing works.
This slide is a good example:
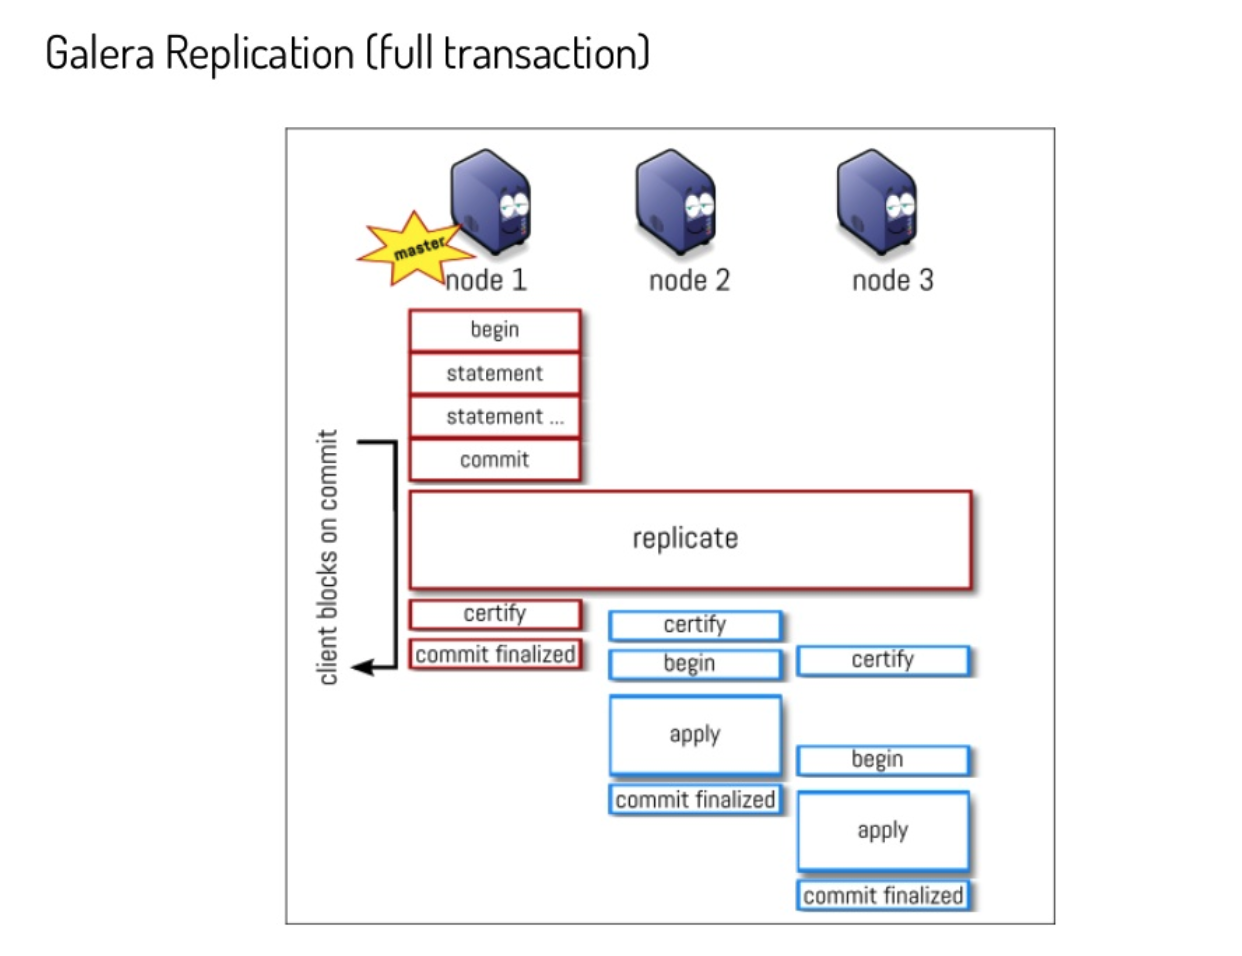
By design the apply and commit finalize in Galera may have (and has) a delay between nodes. When changing the parameter wsrep_sync_wait as explained in the documentation the node initiates a causality check, blocking incoming queries while it catches up with the cluster.
Once all data on the node receiving the READ request is commit_finalized, the node perform the read.
MySQL InnoDB Cluster is worth a bit of discussion. From MySQL 8.0.14 Oracle introduced the parameter group_replication_consistency please read (https://dev.mysql.com/doc/refman/8.0/en/group-replication-consistency-guarantees.html), in short MySQL Group replication can now handle in different way the behavior in respect of Write transactions and read consistency.
Relevant to us are two settings:
- EVENTUAL
- Both RO and RW transactions do not wait for preceding transactions to be applied before executing. This was the behavior of Group Replication before the group_replication_consistency variable was added. A RW transaction does not wait for other members to apply a transaction. This means that a transaction could be externalized on one member before the others.
- AFTER
- A RW transaction waits until its changes have been applied to all of the other members. This value has no effect on RO transactions. This mode ensures that when a transaction is committed on the local member, any subsequent transaction reads the written value or a more recent value on any group member. Use this mode with a group that is used for predominantly RO operations to ensure that applied RW transactions are applied everywhere once they commit. This could be used by your application to ensure that subsequent reads fetch the latest data which includes the latest writes.
As shown above using AFTER is a win and will guarantee us to prevent dirty reads with a small cost.
ProxySQL
ProxySQL has native support for Galera and Group replication, including the identification of the transactions/writeset behind. Given that we can think ProxySQL SHOULD prevent dirty reads, and it actually does when the entity is such to be caught.
But dirty reads can happen in such so small-time window that ProxySQL cannot catch them.
As indicated above we are talking of microseconds or 1-2 milliseconds. To catch such small entity ProxySQL monitor should pollute the MySQL servers with requests, and still possibly miss them given network latency.
Given the above, the dirty read factor, should be handled internally as MySQL Group Replication and Galera are doing, providing the flexibility to choose what to do.
There are always exceptions, and in our case the exception is in the case of basic MySQL replication. In that case, you can install and use the ProxySQL binlog reader, that could help to keep the READS under control, but will NOT be able to prevent them when happening a very small time and number.
Conclusion
Nothing comes for free, dirty reads is one of “those” things that can be prevented but we must be ready to give something back.
It doesn’t matter what, but we cannot get all at the same time.
Given that is important to identify case by case WHICH solution fits better, sometimes it can be NDB, others Galera or Group replication. There is NOT a silver bullet and there is not a single way to proceed.
Also, when using Galera or GR the more demanding setting to prevent dirty reads, can be set at the SESSION level, reducing the global cost.
Summarizing
- NDB is the best, but is complex and fits only some specific usage like high number of threads; simple schema definition; in memory dataset
- Galera is great and it helps in joining performance and efficiency. It is a fast solution but can be flexible enough to prevent dirty reads with some cost.
Use WSREP_SYNC_WAIT to tune that see (https://galeracluster.com/library/documentation/mysql-wsrep-options.html#wsrep-sync-wait) - MySQL Group Replication come actually attached, we can avoid dirty reads, it cost a bit use SET group_replication_consistency= 'AFTER' for that.
- Standard replication can use ProxySQL Binlog Reader, it will help but will not prevent the dirty reads.
To be clear:
- With Galera use WSREP_SYNC_WAIT=3 for reads consistency
- With GR use group_replication_consistency= 'AFTER'
I suggest to use SESSION not GLOBAL and play a bit with the settings to understand well what is going on.
I hope this article had given you a better understanding of what solutions we have out there, such that you will be able to perform an informed decision when in need.
Reference
https://www.proxysql.com/blog/proxysql-gtid-causal-reads
https://github.com/Tusamarco/proxy_sql_tools/tree/master/proxy_debug_tools
https://en.wikipedia.org/wiki/Isolation_(database_systems)#Dirty_reads
https://galeracluster.com/library/documentation/mysql-wsrep-options.html#wsrep-sync-wait
https://dev.mysql.com/doc/refman/8.0/en/group-replication-configuring-consistency-guarantees.html
https://www.slideshare.net/lefred.descamps/galera-replication-demystified-how-does-it-work
↧
Automatic member fencing with OFFLINE_MODE in Group Replication
Group Replication enables you to create fault-tolerant systems with redundancy by replicating the system state to a set of servers. Even if some of the servers subsequently fail, as long it is not all or a majority, the system is still available.…
↧
Setting up a High Availability for PMM
We have been working with PMM for quite a long time, we do most of the performance analysis with PMM for most of our clients. It also provides the flexibility that we have built our own custom dashboard. PMM has many advantages
- Easy to deploy (docker based)
- Flexible
- Customizable
- Query Analytics
- One-stop solution for MySQL,Mongo,ProxySQL & PostgresSQL
- Orchestrator
- Rich and Deep metrics stats
Highly recommended for any production deployments its equivalent to Enterprise-grade monitoring and graphing tool.
Recently we have been working for our client on MySQL Consulting to scale peak sale of the year. Wherein we have deployed PMM to view the performance insights of DB.
We started on-boarding a considerable number of servers under PMM, Everyone liked the way PMM was able to project the performance insights with a beautiful dashboard over a period of time.
Need for HA and Backup of PMM server
When PMM started covering border group of server, we were raised on the question of HA for PMM server, of course it is good to have a High Availability for all possible solutions.
What if the server crashes due to Hardware failures?
- Does PMM support redundancy?
- Is PMM server a single point of failure (SPOF) ?
- What would be the backup strategy?
We had search for many options to achieve HA, with containerized (docker) PMM server. We explored
- lsyncd – Rsync based daemon to copy incremental changes at the block level, failed when we tried to sync the entire /var/lib/docker and start back docker services
- DRBD – will work, but it has complexity with the setup and maintenance
The Accidental HA solution:
As the name suggests, “it was Accidental,”. lets see how it’s done.We have below servers, those were running on debian9(Stretch), with the same version of docker.
Source     : live.mydbops.com (production)
Destination: livebackup.mydbops.com (Replica)
The requirement here is to sync the metrics data between the source(live.mydbops.com) and destination (livebackup.mydbops.com), On the source server we had Prometheus data set size around 178G, so the initial sync took some time.
Stop PMM-server on source
# docker stop pmm-server
Copy the existing data within the docker volume.
#docker cp pmm-data:/opt/prometheus/data opt/prometheus/
# docker cp pmm-data:/opt/consul-data opt/
# docker cp pmm-data:/var/lib/mysql var/lib/
# docker cp pmm-data:/var/lib/grafana var/lib/
Once the initial copy is done, start back the source PMM server
# docker start pmm-server
Next, to transfer the data copy to the destination server, I have used SCP here.
#scp -r /backup/* livebackup.mydbops.com:/backup
Now on the destination server, make sure to have the same version of the PMM server as the source, I have here used version “1.17-1” Since the monitoring server used for testing does not have internet access enabled I had to do an offline load of PMM image as below
# docker load < pmm-server_1.17.tar
071d8bd76517: Loading layer [==================================================>] 210.2MB/210.2MB
6e66f289f547: Loading layer [==================================================>] 899.3MB/899.3MB
Loaded image: percona/pmm-server:latest
Creating docker volume as same as the source server
# docker create -v /opt/prometheus/data -v /opt/consul-data -v /var/lib/mysql -v /var/lib/grafana --name pmm-data percona/pmm-server:latest /bin/true
985630d4aa64375cc4834ceb0f66654bada98cda151636bcd63e9f9b0d3fe3a2
Once the data volume is created now proceed to copy back the data into docker data volume as below
# docker cp /backup/opt/prometheus/data pmm-data:/opt/prometheus/
# docker cp /backup/opt/consul-data pmm-data:/opt/
# docker cp /backp/var/lib/mysql pmm-data:/var/lib/
# docker cp /backup/var/lib/grafana pmm-data:/var/lib/
Once the data-copy is done, PMM data volume is ready to be used after the change of ownership as below.
docker run --rm --volumes-from pmm-data -it percona/pmm-server:latest chown -R pmm:pmm /opt/prometheus/data /opt/consul-data
docker run --rm --volumes-from pmm-data -it percona/pmm-server:latest chown -R grafana:grafana /var/lib/grafana
docker run --rm --volumes-from pmm-data -it percona/pmm-server:latest chown -R mysql:mysql /var/lib/mysql
Now let’s proceed with the final step to run the pmm-server
#docker run -d -p 8080:80 --volumes-from pmm-data --name pmm-server -e SERVER_USER=fhuser -e SERVER_PASSWORD=FHPassword -e METRICS_RETENTION=1500h -e ORCHESTRATOR_ENABLED=true -e ORCHESTRATOR_USER='pmm_user' -e ORCHESTRATOR_PASSWORD='PMM_pass' -e METRICS_RESOLUTION=5s --restart always percona/pmm-server:latest
Note this command should be exactly the same command executed on the master.After a few moment the PMM service was started in the destination box, we could see the live metrics data polling in (Graph below).

We wanted to check the data sync between the source and destination, so we decided to make it run for a couple of more days
After this test run period, We have verified the graphs between source and destination, which seems exactly the same, I am just sharing a sample graph for a DB server(172.31.11.11) between source and destination.
Graph from Destination

Graph from source :

How does it work?
In the first instance when we saw the data is being polled in the backup we were astonished !! and more curious to know how it’s actually working ?. We had a long discussion with our expert team on this
This is just a conceptual understanding to explain this scenario.Let’s go back to the official architecture of the PMM server by Percona, As below.
 .
.
As the above architecture depicts PMM has two parts one is the QAN(Query Analytics) and (MM) Metrics Monitor, where we have achieved the redundancy.
Metrics monitor works by a “PULL” mechanism, ie., the Prometheus collects the metrics data from registered exporters. Since we have duplicated and created the destination server with the same registered exporter from servers. Hence destination, it makes one more pull from DB servers and stores data on to its own data-volume. What we have achieved is in the below architecture

To analyze this we decided to capture packets on the DB machine for those servers and we could
TCP packet analysis via TCP Dump:
root@mydbops-db-8046755:/home/kabilesh.pr# tcpdump -c 20 -tttt -i eth0 src livebackup.mydbops.com

tcpdump: verbose output suppressed, use -v or -vv for full protocol decode

listening on eth0, link-type EN10MB (Ethernet), capture size 262144 bytes
2019-10-08 13:49:30.593668 IP livebackup.mydbops.com.59502 > mydbops-db-8046755.42002: Flags [P.], seq 1314972321:1314972594, ack 1936498908, win 1444, options [nop,nop,TS val 130344282 ecr 540951618], length 273
2019-10-08 13:49:30.614009 IP livebackup.mydbops.com.59502 > mydbops-db-8046755.42002: Flags [.], ack 4126, win 1422, options [nop,nop,TS val 130344287 ecr 540952633], length 0
2019-10-08 13:49:30.614022 IP livebackup.mydbops.com.59502 > mydbops-db-8046755.42002: Flags [.], ack 9052, win 1390, options [nop,nop,TS val 130344287 ecr 540952633], length 0
2019-10-08 13:49:30.712817 IP livebackup.mydbops.com.59516 > mydbops-db-8046755.42002: Flags [P.], seq 1684281946:1684282219, ack 3948074006, win 1444, options [nop,nop,TS val 130344312 ecr 540951623], length 273
2019-10-08 13:49:31.803979 IP livebackup.mydbops.com.42998 > mydbops-db-8046755.42000: Flags [P.], seq 703692847:703693117, ack 1617572969, win 1444, options [nop,nop,TS val 130344585 ecr 540952412], length 270
2019-10-08 13:49:31.816501 IP livebackup.mydbops.com.42998 > mydbops-db-8046755.42000: Flags [.], ack 15606, win 1436, options [nop,nop,TS val 130344588 ecr 540952933], length 0

20 packets captured
23 packets received by filter
0 packets dropped by kernel
root@mydbops-db-8046755:/home/kabilesh.pr# tcpdump -c 20 -tttt -i eth0 src live.mydbops.com
tcpdump: verbose output suppressed, use -v or -vv for full protocol decode
listening on eth0, link-type EN10MB (Ethernet), capture size 262144 bytes
2019-10-08 13:49:42.615378 IP live.mydbops.com.40336 > mydbops-db-8046755.42000: Flags [P.], seq 2445371654:2445371924, ack 1808532851, win 1444, options [nop,nop,TS val 905019213 ecr 540954908], length 270
2019-10-08 13:49:42.627810 IP live.mydbops.com.40336 > mydbops-db-8046755.42000: Flags [.], ack 4126, win 1428, options [nop,nop,TS val 905019217 ecr 540955636], length 0
2019-10-08 13:49:42.627833 IP live.mydbops.com.40336 > mydbops-db-8046755.42000: Flags [.], ack 14262, win 1386, options [nop,nop,TS val 905019217 ecr 540955636], length 0
2019-10-08 13:49:43.490791 IP live.mydbops.com.55843 > mydbops-db-8046755.42002: Flags [P.], seq 611310810:611311083, ack 2742084436, win 1444, options [nop,nop,TS val 905019432 ecr 540954843], length 273
2019-10-08 13:49:43.512377 IP live.mydbops.com.55843 > mydbops-db-8046755.42002: Flags [.], ack 4126, win 1432, options [nop,nop,TS val 905019438 ecr 540955857], length 0
2019-10-08 13:49:43.512388 IP live.mydbops.com.55843 > mydbops-db-8046755.42002: Flags [.], ack 9064, win 1410, options [nop,nop,TS val 905019438 ecr 540955857], length 0

20 packets captured
20 packets received by filter
0 packets dropped by kernel
Key Takeaways:
- This works well for replicating exactly the same set of servers which is already registered with the source. If a new server is added, I believe the samessteps have to be followed back.
- This is not officially supported, though it works and full-fills the requirement.
- QAN HA is not done here, but it can be done since the PMM server uses MySQL internally to store the QAN data, hence it can be replicated by exposing the MySQL port.
- There can be minor differences or deviation in the metrics data since the time at which it polls the data might be different between the servers.
As said earlier it is good to have a High Availability for PMM as it plays a critical role.
↧
Just put the cold data over there
There are several ways to use less SSD for an OLTP workload: choose a database engine has less space amplification, store less data, move the cold data elsewhere. The first approach is a plan while the others are goals. A plan is something you can implement. A goal requires a plan to get done.
This matters when you want to decrease the cost of storage for a database workload but not everyone needs to do that. The first approach assumes your DBMS supports an LSM with leveled compaction and compression (MariaDB and Percona Server include MyRocks, ScyllaDB and Cassandra are also options). The second approach, store less data, assumes you can get everyone to agree to remove data and that is a hard conversation.
The third approach, move the cold data elsewhere, is a wonderful goal. I wonder how often that goal is achieved. To implement this you must find data that won't (well, almost never) be read or written again and then move it to less expensive storage. I assume this has been more successful when implemented in storage than in a DBMS. The obvious example is an OS page cache but there are also tiered storage servers. An LSM already classifies data that is hot vs cold for writes, data closer to the L0 was written more recently, but that might not imply anything about read likelihood.
I have read wonderful research papers that show how a DBMS might do this but I am still wary. Assume that data can be described by read and write likelihood attributes -- {read N, read forever} X {write N, write forever} then the goal is to find data that is read N, write N for which N has been reached. You frequently won't know the value of N and monitoring will be needed to identify data that is rarely read or written, along with more CPU, RAM and IO to perform that monitoring. This is easier to do when the granularity of hot vs cold is per table but that is rare in my experience. I assume the common case is a table with a mix of hot and cold data.
Don't forget that it is a lousy experience when cold data becomes hot again.
This post was inspired by something I read on a wonderful blog -- Blocks and Files (no snark, blog is great). My summary of the post is that SSD endurance isn't a problem, just evict cold data to cold storage. Just remember that is a goal not a plan.
↧
↧
Group Replication delivery message service
In the process of enhancing MySQL replication with new features for our users, we also improve the internals. A lot of work goes also to modernize the codebase and make it easier to maintain and obviously extend as well.
In MySQL 8.0.18, we have extended the set of internal services with a group replication message passing service, therefore generalizing the communication framework for group replication.…
↧
MySQL Server 8.0.18: Thanks for the Contributions
In my blog series about external contributions to MySQL 8 we have reached version 8.0.18 which was released Monday 14 October 2019. Again the community has contributed to make MySQL better. Thank you.

The contributions to MySQL 8.0.18 includes several patches from Facebook as well as patches from Gillian Gunson, Przemysław Skibiński (Percona), and Daniel Black. The contributions are:
- MySQL now provides more control over the use of compression to minimize the number of bytes sent over connections to the server. Previously, a given connection was either uncompressed or used the
zlibcompression algorithm. Now, it is also possible to use thezstdalgorithm (zstd 1.3), and to select a compression level forzstdconnections. The permitted compression algorithms can be configured on the server side, as well as on the connection-origination side for connections by client programs and by servers participating in master/slave replication or Group Replication. For more information, see Connection Compression Control.
Connection compression using thezstdalgorithm requires that the server be built withzstdlibrary support. The newWITH_ZSTDCMake option indicates whether to use the bundled or systemzstdlibrary.
Legacy compression-control parameters, such as the--compressclient option, are deprecated and will be removed in a future MySQL version.
Thanks to Facebook for a contribution on which some of this work was based. - The
sys.schema_unused_indexesview now filters out unique indexes. Thanks to Gillian Gunson for the contribution. (Bug #24798995, Bug #83257) - The new
innodb_idle_flush_pctvariable permits placing a limit on page flushing during idle periods, which can help extend the life of solid state storage devices. See Limiting Buffer Flushing During Idle Periods.
Thanks to Facebook for the contribution. (Bug #27147088, Bug #88566) - Replication: The heartbeat interval for a replication slave, which is controlled by the
MASTER_HEARTBEAT_PERIODoption of theCHANGE MASTERTO statement, can be specified with a resolution in milliseconds. Previously, the master’s binary log dump thread used a granularity of seconds to calculate whether a heartbeat signal should be sent to the slave, causing excessive heartbeat activity in the case of multiple skipped events. To remove this issue, all heartbeat-related calculations by the master and slave are now carried out using a granularity of nanoseconds for precision. Thanks to Facebook for the contribution. (Bug #29363787, Bug #94356) - When generating C source from SQL scripts, Some utf8-encoded characters were split across lines. Thanks to Przemysław Skibiński from Percona for the patch. (Bug #30152555, Bug #96449)
- With strict SQL mode enabled, the
STR_TO_DATE()function did not properly handle values with time parts only. Thanks to Daniel Black for the contribution. (Bug #18090591, Bug #71386)
If you have patches you would like to contribute you can do so from MySQL’s GitHub repository (requires signing the Oracle Contributor Agreement).
Thank you for the contributions.
↧
MySQL Calculate How Much Disk Space You Wasted
Its not the new term for DBAs. MySQL has an awesome parameter innodb-file-per-tables allows MySQL to create separate files for each tables. This helped a lot to manage the disk space in more efficient way. But when we perform a large batch job for delete or update the data in MySQL tables, you may face this fragmentation issue. Comparing with SQL server, MySQL’s fragmentation is not high. I had a similar situation where my Disk space was consuming 80% and when I check the huge files in OS, one table’s idb file consumed 300GB+. I know it has some wasted blocks(but not actually wasted, MySQL will use this space, it’ll not return this to OS) Then I checked the information schema to find out the data size and its index size. It was 27GB only. Then I realize, we did a batch operation to delete many billions of records in that table.
Thanks to Rolando - MySQL DBA:
When I searched the similar issue on dba stackexchange, I found this great script by Rolando. He had given this script to calculate the wasted size for a single table. I just add some South Indian Masala on top of it.(just for fun). You can use the below script to identify the wasted space/fragmented space in GB for all tables in a database.
Parameters:
- DB - Your Database Name
- MYSQL_DATA_DIR - Your Data directory for MySQL
-
MYSQL_USER - MySQL user to query the
information schema. - MYSQL_PASS - Password for the MySQL user.
    DB='mydb'
    MYSQL_DATA_DIR='/mysqldata'
    MYSQL_USER=sqladmin
    MYSQL_PASS='mypass!'
    MYSQL_CONN="-u${MYSQL_USER} -p${MYSQL_PASS}"

    Tables=`ls -l $MYSQL_DATA_DIR/$DB/ | grep ibd | awk -F' ' '{print $9}' | sed -e 's/\.ibd//g'`
    for x in `echo $Tables`
    do
    TB=$x
    SQL="SELECT data_length+index_length FROM information_schema.tables"
    SQL="${SQL} WHERE table_schema='${DB}' AND table_name='${TB}'"
    TBLSIZE_OPER=`ls -l $MYSQL_DATA_DIR/${DB}/${TB}.ibd | awk -F' ' '{print $5}'`
    TBLSIZE_INFO=`mysql ${MYSQL_CONN} -ANe"${SQL}"`
    TBLSIZE_FRAG=$(($TBLSIZE_OPER - $TBLSIZE_INFO))
    TBLSIZE_FRAG_GB=$(($TBLSIZE_FRAG / 1073741824))
    echo ${TB} ${TBLSIZE_FRAG_GB}
    done
Execution
Its better to create the script as a shell file and print the output in a file.
./script.sh > output.txt↧
MySQL Keyring now speaks Hashicorp Vault

As an intro to his performance act, an “old school” entertainer Victor Borge once famously asked the audience: “Do you care for piano music?“, which was greeted by a crowd, only to be immediately followed by a self-ironic punch line – “Too bad.”
Security topics share a similar notion – namely, once you start caring for them, you get exposed to an almost unmanageable set of constraints, issues and hard choices.…
↧
↧
dbForge Studio for MySQL is a DBTA 2019 Finalist
DBTA (Database Trends and Applications) is a magazine delivering news and analysis on data science, big data, information management, and analytics. Every year, they conduct surveys among readers about various database-related software solutions to choose the best offers in a variety of categories such as ‘Best BI Solution’, ‘Best Cloud Database’, ‘Best Data Analytics Solution’, […]
↧
MySQL for Visual Studio 1.2.9 has been released
Dear MySQL users,
The MySQL Windows Experience Team is proud to announce the release
of MySQL for Visual Studio 1.2.9.
This is a maintenance release for 1.2.x. It can be used for
production environments.
MySQL for Visual Studio is a product that includes all of the
Visual Studio integration functionality to create and manage
MySQL databases when developing .NET applications.
MySQL for Visual Studio is installed using the MySQL Installer
for Windows which comes in 2 versions:
* Full (415.1 MB) which includes a complete set of MySQL products
with their binaries included in the downloaded bundle.
* Web (18.6 MB – a network install) which will just pull MySQL
for Visual Studio over the web and install it when run.
You can download MySQL Installer from our official Downloads page at
http://dev.mysql.com/downloads/installer/.
MySQL for Visual Studio can also be downloaded by using the product
standalone installer found at
http://dev.mysql.com/downloads/windows/visualstudio/.
Changes in MySQL for Visual Studio 1.2.9 (2019-10-21, General
Availability)
* Functionality Added or Changed
* Bugs Fixed
Functionality Added or Changed
* MySQL for Visual Studio now prompts for action when it
detects any conflicts in its configuration files that
were introduced after MySQL for Visual Studio was
installed. Errors associated with this type of
configuration conflict prevent the creation of data
sources and table adapters.
A new Configuration Update Tool can resolve the conflicts
between Connector/NET and MySQL for Visual Studio
libraries as they are detected (see MySQL for Visual
Studio Configuration Update Tool
(https://dev.mysql.com/doc/visual-studio/en/visual-studio-install.html#visual-studio-install-update-tool)).
To complete the action, it is necessary to restart
affected versions of Visual Studio manually after
the tool finishes updating the files.
(Bug #29884031, Bug #82617)
* MySQL for Visual Studio now supports all editions of
Microsoft Visual Studio 2019. In addition, this release
removes support for Visual Studio versions 2012 and 2013.
(Bug #29616463, Bug #94937)
* The MySQL Website Configuration tool was renamed and
extended to also automate entry updates to the app.config
file (in addition to the web.config file). The newly
renamed MySQL Application Configuration tool preserves
the functionality used to simplify website development
and now extends the configuration capabilities of the
tool to manage dependencies required when running the
Entity Data Model Wizard. (Bug #29490017)
* Connections to MySQL using SSL PEM encryption or standard
TCP/IP over SSH now are supported by MySQL for Visual
Studio (see Making a Connection
(https://dev.mysql.com/doc/visual-studio/en/visual-studio-making-a-connection.html)).
Bugs Fixed
* Several installation errors caused the wrong version or
edition of Visual Studio to be identified, which then
resulted in the deployment of MySQL for Visual Studio
files to the wrong folder or to a file structure that
represented multiple versions Visual Studio that were
neither selected nor installed on the host computer.
(Bug #30225436, Bug #96576)
* A secondary window opened unexpectedly when a user with
insufficient database privileges (GRANT SELECT and GRAN
SHOW VIEW) attempted to alter the definition of an
existing view. This fix introduces an error message to
explain the condition in detail. (Bug #30001906)
* From code, it was possible to create an instance of
SqlDataSource, make a connection to a MySQL server, and
then populate an ASP.NET control. However, attempting the
same sequence using the Visual Studio Configure Data
Source designer produced a object-reference error when
the data source was being configured in the designer (and
MySQL Connector/NET 6.10.8 was installed) and also at
runtime of the web application.
As part of a related fix, the data source now populates
ASP.NET controls from custom queries as expected at
runtime. Likewise, the designer now permits configuration
when the 6.10.8 version of MySQL Connector/NET is
installed with one caution. When using the Specify
columns from a table or view option, the Configure Data
Source designer generates the query using bracket
characters ( [] ) as delimiters for identifiers, which
produces an invalid MySQL statement. The brackets can be
removed manually after the data source is created.
Alternatively, the second option in the designer
associated with generating queries from the data source,
Specify a custom SQL statement or stored procedure, is
the preferred option to use. (Bug #28148998, Bug #91136)
* The TableAdapter Configuration Wizard in Visual Studio
configured with a valid MySQL connection produced an
error, instead of generating the expected TableAdapter.
Now, the error condition is resolved when MySQL
Connector/NET 6.10.8 (or higher) or MySQL Connector/NET
8.0.14 (or higher) are available for use by MySQL for
Visual Studio. (Bug #27857627, Bug #90390)
On Behalf of MySQL Release Engineering Team,
Sreedhar S
↧
MySQL & InnoDB Disk Space
Yesterday, Bhuvanesh published an article about how to verify the difference between allocated diskspace for a tablespace and the the data in it.
I commented with an old post explaining how to get some similar info only using SQL in case you don’t have filesystem access.
And finally, my friend Bill Karwin, commented how this info is not always accurate. Which, of course, I agree with.
This is why, I checked what info we have available and try to find some better answer.
So first, please remind that information_schema statistics are cached by default:
mysql> show global variables like 'information_schema_stats_expiry';
+---------------------------------+-------+
| Variable_name                   | Value |
+---------------------------------+-------+
| information_schema_stats_expiry | 86400 |
+---------------------------------+-------+
And that for better results, it’s always advised to run ANALYZE TABLE ...
For the following examples, I set information_schema_stats_expiry to 0.
The New Query
The new query takes advantage of the column FILE_SIZE in Performance_Schema.INNODB_TABPLESPACES:
> SELECT NAME, TABLES_ROWS, format_bytes(data_length) DATA_SIZE,
       format_bytes(index_length) INDEX_SIZE,
       format_bytes(data_length+index_length) TOTAL_SIZE,
       format_bytes(data_free) DATA_FREE,
       format_bytes(FILE_SIZE) FILE_SIZE,
       format_bytes((FILE_SIZE/10 - (data_length/10 +
                           index_length/10))*10) WASTED_SIZE
FROM information_schema.TABLES as t
JOIN information_schema.INNODB_TABLESPACES as it
  ON it.name = concat(table_schema,"/",table_name)
ORDER BY (data_length + index_length) desc limit 5;
+-------------------+------------+------------+------------+------------+------------+------------+-------------+ | NAME | TABLE_ROWS | DATA_SIZE | INDEX_SIZE | TOTAL_SIZE | DATA_FREE | FILE_SIZE | WASTED_SIZE | +-------------------+------------+------------+------------+------------+------------+------------+-------------+ | big/testing | 10241204 | 647.98 MiB | 0 bytes | 647.98 MiB | 2.00 MiB | 660.00 MiB | 12.02 MiB | | docstore/all_recs | 24353 | 17.56 MiB | 0 bytes | 17.56 MiB | 0 bytes | 25.00 MiB | 7.44 MiB | | big/pktest | 111649 | 11.55 MiB | 0 bytes | 11.55 MiB | 0 bytes | 19.00 MiB | 7.45 MiB | | big/pktest_seq | 81880 | 6.52 MiB | 0 bytes | 6.52 MiB | 0 bytes | 14.00 MiB | 7.48 MiB | | library/books | 39 | 384.00 KiB | 16.00 KiB | 400.00 KiB | 0 bytes | 464.00 KiB | 64.00 KiB | +-------------------+------------+------------+------------+------------+------------+------------+-------------+
We can see that MySQL estimates that the datasize for my biggest table is 648MB and that 660MB are used on the disk. The last info is very easy to verify:
$ sudo ls -lh /var/lib/mysql/big/testing.ibd
-rw-r----- 1 mysql mysql 660M Oct 22 00:19 /var/lib/mysql/big/testing.ibd
As I recommended it, it’s always good to do an ANALYZE TABLE:
> analyze table big.testing;
+-------------+---------+----------+----------+
| Table       | Op      | Msg_type | Msg_text |
+-------------+---------+----------+----------+
| big.testing | analyze | status   | OK       |
+-------------+---------+----------+----------+
And we can run again our query:
+-------------------+------------+------------+------------+------------+------------+------------+-------------+
| NAME              | TABLE_ROWS | DATA_SIZE  | INDEX_SIZE | TOTAL_SIZE | DATA_FREE  | FILE_SIZE  | WASTED_SIZE |
+-------------------+------------+------------+------------+------------+------------+------------+-------------+
| big/testing       |    9045529 | 582.42 MiB |    0 bytes | 582.42 MiB | 67.00 MiB  | 660.00 MiB | 77.58 MiB   |
| docstore/all_recs |      24353 | 17.56 MiB  |    0 bytes | 17.56 MiB  |    0 bytes | 25.00 MiB  | 7.44 MiB    |
| big/pktest        |     111649 | 11.55 MiB  |    0 bytes | 11.55 MiB  |    0 bytes | 19.00 MiB  | 7.45 MiB    |
| big/pktest_seq    |      81880 | 6.52 MiB   |    0 bytes | 6.52 MiB   |    0 bytes | 14.00 MiB  | 7.48 MiB    |
| library/books     |         39 | 384.00 KiB | 16.00 KiB  | 400.00 KiB |    0 bytes | 464.00 KiB | 64.00 KiB   |
+-------------------+------------+------------+------------+------------+------------+------------+-------------+
We can see now that the statistics have been updated and that according to my previous post, we are loosing 67MB but with the new one comparing to disk, it seems we are wasting 77.5MB on disk.
Let’s see how to table looks like using innodb_ruby:

Recovering the disk space
Let’s see if we can recover some disk space:
> OPTIMIZE table big.testing;
+-------------+----------+----------+-------------------------------------------------------------------+
| Table       | Op       | Msg_type | Msg_text                                                          |
+-------------+----------+----------+-------------------------------------------------------------------+
| big.testing | optimize | note     | Table does not support optimize, doing recreate + analyze instead |
| big.testing | optimize | status   | OK                                                                |
+-------------+----------+----------+-------------------------------------------------------------------+
 2 rows in set (1 min 4.8855 sec)
And we can check again:
+-------------------+------------+------------+------------+------------+------------+------------+-------------+
| NAME              | TABLE_ROWS | DATA_SIZE  | INDEX_SIZE | TOTAL_SIZE | DATA_FREE  | FILE_SIZE  | WASTED_SIZE |
+-------------------+------------+------------+------------+------------+------------+------------+-------------+
| big/testing       |    9045529 | 582.42 MiB |    0 bytes | 582.42 MiB | 67.00 MiB  | 584.00 MiB | 1.58 MiB    |
| docstore/all_recs |      24353 | 17.56 MiB  |    0 bytes | 17.56 MiB  |    0 bytes | 25.00 MiB  | 7.44 MiB    |
| big/pktest        |     111649 | 11.55 MiB  |    0 bytes | 11.55 MiB  |    0 bytes | 19.00 MiB  | 7.45 MiB    |
| big/pktest_seq    |      81880 | 6.52 MiB   |    0 bytes | 6.52 MiB   |    0 bytes | 14.00 MiB  | 7.48 MiB    |
| library/books     |         39 | 384.00 KiB | 16.00 KiB  | 400.00 KiB |    0 bytes | 464.00 KiB | 64.00 KiB   |
+-------------------+------------+------------+------------+------------+------------+------------+-------------+
We can see that now we have regain some disk space !
So even if this is not always 100% accurate, this method provides you already a very close to reality view of how your InnoDB Tablespaces are using the disk and when you will benefit from rebuilding your tablespace.
MySQL Shell Plugin
I’ve updated the innodb/fragmented MySQL Shell Plugin on my github with a new method:

↧
NoSQL + SQL = MySQL 8; Keynote OSI2019
Slides from the keynote presented at Open Source India 2019 at Nimhans convention center Bangalore. As usual lots of interesting folks. Lots of focus on Open Source.
Met people from the SODA foundation who are trying to standardize the IO layer across all cloud implementations. All the best guys.
Also met folks from MOSIP who have an effort ongoing to help countries create their own UID. Seems like they already have some traction.
Also met an interesting person trying to think about Indian design and creativity in software. After Chumbak it does make sense to think about how not only UI but the software development process needs more creativity.
Thank you EFY for the opportunity. Great job and all the best for the future.
↧
↧
Setting up MySQL Cluster on local machine using AutoInstaller
We have a new version of the MySQL Cluster Auto Installer. I have prepared 3
Youtube videos that shows how to make use of the Auto Installer to install and
set up a cluster on your local machine.
This is my first attempt at making Youtube videos to explain things around
MySQL Cluster.
The Auto Installer is intended as a tool to make it easy to get a cluster up and
running. It is NOT intended for managing a cluster.
The first Youtube video Install MySQL Cluster 8.0.18 on Mac OS X shows how
to install MySQL Cluster 8.0.18 on Mac OS X. This is obviously trivial, so should
be straightforward to do even without the video.
The second Youtube video Starting a local MySQL Cluster using Auto Installer sets
up a small cluster with 1 management server, 2 data nodes and 1 MySQL Server and
explains some details around this.
Using MySQL Cluster AutoInstaller to start development with NDB goes a bit deeper
and also shows how to make use of the cluster and do some trivial operations
through a MySQL client and the NDB management client. It also shows how one can
extend the possible configurations supported by directly manipulating configuration
files deployed by the Auto Installer.
A little note for Mac OS X users with high resolution is that full 4K resolution is
available through Google Chrome, not through Safari.
↧
InnoDB Page Compression – MySQL 8 Compression
InnoDB Page Compression Explained
We have several customers with multi-terabyte database infrastructure on SSDs, The SSDs are great investment for performance but they are also expensive with shorter lifespans so storage efficiency management is something we are very cautious about on SSDs, At MinervaDB Labs we spend considerable amount of time doing research on InnoDB page compressions benefits and most common mistakes. The compressed tables were first introduced in 2008 with InnoDB plugin for MySQL 5.1 . Facebook has been a major committer to this project and most of it were later implemented in upstream MySQL code as well. We can implement compression in InnoDB is two ways, Either by using Barracuda InnoDB file format or ROW_FORMAT=COMPRESSED
How InnoDB page compression works ?
When a page is written, It will be compressed applying the specific compression algorithm and written to disk, where the hole punching mechanism ( Several popular Linux file systems already support the hole punching feature. For example: XFS since Linux 2.6.38, ext4 since Linux3.0, tmpfs (/dev/shm ) since Linux 3.5, and Btrfs since Linux 3.7.)releases empty blocks from the end of the page. If compression fails, data is written out as-is. MySQL implements compression with the help of the well-known zlib library, which implements the LZ77 compression algorithm. Some operating systems implement compression at the file system level. Files are typically divided into fixed-size blocks that are compressed into variable-size blocks, which easily leads into fragmentation.if innodb_page_size=16K and the file system block size is 4K, page data must compress to less than or equal to 12K to make hole punching possible so every time something inside a block is modified, the whole block is recompressed before it is written to disk. These properties make InnoDB compression technique unsuitable for use in an update-intensive database system.
InnoDB Page Compression Supported Platforms
InnoDB page compression requires sparse file and hole punching support, You can implement page compression on Windows with NTFS and following are the Linux platforms which support hole punching:
- RHEL 7 and derived distributions that use kernel version 3.10.0-123 or higher
- OEL 5.10 (UEK2) kernel version 2.6.39 or higher
- OEL 6.5 (UEK3) kernel version 3.8.13 or higher
- OEL 7.0 kernel version 3.8.13 or higher
- SLE11 kernel version 3.0-x
- SLE12 kernel version 3.12-x
- OES11 kernel version 3.0-x
- Ubuntu 14.0.4 LTS kernel version 3.13 or higher
- Ubuntu 12.0.4 LTS kernel version 3.2 or higher
- Debian 7 kernel version 3.2 or higher
InnoDB compression on Windows
The way NTFS clustering is designed we hardly get any benefit with InnoDB compression. The hole punch is done on a “compression unit” and this compression unit is derived from the cluster size (see the table below). This means that by default you cannot punch a hole if the cluster size >= 8K. Here’s a breakdown for smaller cluster sizes:
| Cluster Size | Compression Unit |
|---|---|
| 512 Bytes | 8 KB |
| 1 KB | 16 KB |
| 2 KB | 32 KB |
| 4 KB | 64 KB |
i.e. for page compression to work on Windows, the file system must be created with a cluster size smaller than 4K, and the innodb_page_size must be at least twice the size of the compression unit. For example, for page compression to work on Windows, you could build the file system with a cluster size of 512 Bytes (which has a compression unit of 8KB) and initialize InnoDB with an innodb_page_size value of 16K or greater.
How enable InnoDB compression ?
You can enabled page compression by specifying the COMPRESSION attribute in the CREATE TABLE statement, We have explained same below with example:
CREATE TABLE tab11 (col101 INT) COMPRESSION="zlib";
We can also enable page compression with ALTER TABLE statement. But ALTER TABLE … COMPRESSION updates only the tablespace compression attribute. Writes to the tablespace that occur after setting the new compression algorithm use the new setting, To enable the new compression algorithm to existing pages, you must rebuild the table using OPTIMIZE TABLE.
Disabling InnoDB Page Compression
You can disable InnoDB page compression by setting COMPRESSION = None in ALTER TABLE statement. Writes to the tablespace that occur after setting COMPRESSION=None no longer use page compression. To uncompress existing pages, you must rebuild the table using OPTIMIZE TABLE after setting COMPRESSION=None.
Monitoring tables using Page Compression
You can monitor the tables with page compression enabled from INFORMATION_SCHEMA.TABLES CREATE_OPTIONS columns for tables defined with the COMPRESSION attribute:
mysql> SELECT TABLE_NAME, TABLE_SCHEMA, CREATE_OPTIONS FROM INFORMATION_SCHEMA.TABLES WHERE CREATE_OPTIONS LIKE '%COMPRESSION=%';

+------------+--------------+--------------------+
| TABLE_NAME | TABLE_SCHEMA | CREATE_OPTIONS     |
+------------+--------------+--------------------+
| Ad_Clicks  | ADSE         | COMPRESSION="zlib" |
+------------+--------------+--------------------+
InnoDB Page Compression Limitations
- Cross-platform dependency issues – We can copy the page-compressed tablespaces between Linux and Windows servers only if the compression algorithm is available on both servers
- InnoDB page compression doesn’t work always as expected:
- Page compression is not supported for tables that reside in shared tablespaces, which include the system tablespace, temporary tablespaces, and general tablespaces.
- Page compression is not supported for undo log tablespaces.
- Page compression is not supported for redo log pages.
- During recovery, updated pages are written out in an uncompressed form.
- R-tree pages, which are used for spatial indexes, are not compressed.
- Pages that belong to compressed tables (ROW_FORMAT=COMPRESSED) are just left as-is.
- During recovery, updated pages are written out in an uncompressed form.
- Fragmentation issues – Since hole punching releasing blocks back to the file system free list, You can expect severe fragmentation in I/O intensive applications
References
- Percona XtraDB: Compressed Columns with Dictionaries – An Alternative to InnoDB Table Compression by Yura Sorokin – https://www.percona.com/live/e17/sessions/percona-xtradb-compressed-columns-with-dictionaries-an-alternative-to-innodb-table-compression
- InnoDB page compression explained in MySQL documentation – https://dev.mysql.com/doc/refman/8.0/en/innodb-page-compression.html
- InnoDB Page Compression: the Good, the Bad and the Ugly by Vadim Tkachenko – https://www.percona.com/blog/2017/11/20/innodb-page-compression/
- On InnoDB Data Compression in MySQL by Valerii Kravchuk – http://mysqlentomologist.blogspot.com/2018/06/on-innodb-data-compression-in-mysql.html
- InnoDB Transparent Page Compression by Sunny Bains – https://mysqlserverteam.com/innodb-transparent-page-compression/
- MyRocks and InnoDB compression explained by Mark Callaghan – http://smalldatum.blogspot.com/2017/12/myrocks-innodb-and-tokudb-summary.html
- InnoDB compressed columns introduced by Yura – https://www.percona.com/doc/percona-server/LATEST/flexibility/compressed_columns.html
The post InnoDB Page Compression – MySQL 8 Compression appeared first on MySQL Consulting, Support and Remote DBA Services.
↧
Mysql Workbench là gì? Tại sao phải cài đặt Mysql Workbench
Công việc lập trình là một công việc đòi hỏi người thực hiện phải có một niềm đam mê lớn và khả năng tư duy nhạy bén. Tuy nhiên với thời buổi công nghệ phát triển mạnh mẽ như hiện nay, việc một lập trình viên có đam mê và năng lực thì chưa đủ, bạn cần phải biết cũng như là sử dụng thành thạo các công cụ tiện ích để hỗ trợ bạn viết ra được những chương trình chất lượng một cách nhanh chóng cũng như là bảo mật tốt cho sản phẩm trí tuệ của mình. Trong bài viết này, chúng tôi sẽ giới thiệu đến bạn một loại công cụ rất được các nhà phát triển trên thế giới ưa chuộng chính là MySQL Workbench.
1. MySQL Workbench là gì?
1.1 MySQL
Trước khi đến với khái niệm MySQL Workbench, chúng ta cần phải biết MySQL là gì. Một tập hợp nhiều dữ liệu sẽ được gọi là một cơ sở dữ liệu. Có nhiều loại cơ sở dữ liệu khác nhau từ đơn giản đến phức tạp cũng như nhiều cách lưu trữ cơ sở dữ liệu, truyền thống nhất là trên văn bản, giấy tờ hoặc có thể lưu trữ bằng những phần mềm thông qua các tập tin.
Tuy nhiên, đối với những cơ sở dữ liệu khó và phức tạp như lập trình, chúng ta cần phải sử dụng hệ quản trị cơ sở dữ liệu. Và MySQL là một hệ thống quản trị cơ sở dữ liệu nhưng có mã nguồn mở dùng để tạo và quản trị các cơ sở dữ liệu và được sử dụng với ngôn ngữ truy vấn có cùng một cấu trúc là Structured Query Language – viết tắt là SQL.
>> Đọc thêm: Tổng quan về Mysql <<
1.2 MySQL Workbench
MySQL Workbench chính là một chương trình giúp cho người lập trình có thể giao tiếp với hệ cơ sở dữ liệu MySQL thay vì phải sử dụng các lệnh Command-line phức tạp và mất thời gian. MySQL Workbench được thiết kế đơn giản, dễ sử dụng và có thể thích ứng với nhiều hệ điều hành như là Microsoft Windowns, Max OS, Linux hay Ubuntu.
2. Các tính năng của MySQL
2.1 Dựng hình và thiết kế
Các database có hiệu suất cao luôn sử dụng mô hình (modeling) làm yếu tố cốt lõi. MySQL Workbench cũng không phải là ngoại lệ, ứng dụng này tạo ra các thiết kế mô hình database một cách trực quan và rất đơn giản khi dịch sang cơ sở dữ liệu MySQL.
Ngoài ra, MySQL Workbench còn hỗ trợ người dụng tạo nhiều modeling trong cùng một môi trường cũng như là hỗ trợ các đối tượng khác như trình xem, bảng biểu, trình kích hoạt, phương pháp lưu trữ, … để tạo nên một cơ sở dữ liệu. Nó còn cho phép chỉnh sửa các modeling đồ họa của bạn bằng cách dung Table Editor, một công cụ thường sử dụng để sửa các Index, Column, Privileges, Routines and Views,…
2.2 Phát triển
Ngôn ngữ truy vấn SQL cho chúng ta thực hiện những thao tác cơ sở dữ liệu quan hệ và nó cũng chính là trung tâm của tất cả các database. MySQL Workbench có tích hợp sẵn các trình soạn thảo, cho phép người dùng chỉnh sửa, xây dựng và sử dụng đối với các cơ sở dữ liệu của MySQL Server. Chúng cũng có kèm theo các tiện ích để xem và xuất dữ liệu.
Đặc biệt, MySQL đánh dấu các cú pháp bằng các màu sắc khác nhau, giúp cho các nhà phát triển dễ hơn trong quá trình viết và debug các câu lệnh SQL. MySQL Workbench có khả năng chạy nhiều truy vấn khác nhau cùng lúc, sau đó kết quả sẽ được hiện thị một cách tự động trong các trang khác nhau và được lưu lại trong lịch sử truy vấn để tiện cho quá trình truy xuất và chạy về sau.
2.3 Quản trị
Trong quá trình đảm bảo an toàn thông tin, dữ liệu cho doanh nghiệp thì quản trị hệ thống là một yếu tố quan trọng. Những vấn đề liên quan đến quản trị hệ thống gồm cấu hình, nhật ký, quản lý người dùng,… Các tính năng được tích hợp trong MySQL Workbench giúp việc quản trị trở nên đơn giản hơn, có thể kể đến như:
– Cấu hình máy chủ: được hỗ trợ nâng cao và cho phép chỉnh sửa để hiệu suất được tăng cao.
– Nhật ký máy chủ: Nhật ký sẽ bao gồm thông tin các lỗi, bản ghi nhị phân và bản ghi InnodDB, từ đó làm căn cứ đưa ra các chuẩn đoán cho máy chủ. MySQL Workbench cung cấp công cụ trực quan cho phép người dùng, các lập trình viên, các nhà phát triển xem lịch sử, nhật ký của MySQL Server.
– Sao lưu và phục hồi dữ liệu: MySQL Workbench sở hữu các công cụ trực quan để dùng cho việc nhập hay xuất các file dump trong MySQL.
– Quản trị người dùng: MySQL Worckbench cho phép admin của database dễ dàng thêm hoặc xóa bớt người dùng khi cần thiết cũng như là xem hồ sơ của những người dùng.
2.4 Di chuyển cơ sở dữ liệu
Khả năng di chuyển cơ sở dữ liệu của MySQL Workbench được thiết kế để giúp các nhà phát triển tiết kiệm được thời gian bằng cách cung cấp công cụ trực quan và dễ sử dụng cho tất cả các giai đoạn của cấu hình và quản lý các quy trình dịch chuyển phức tạp như:
– Cho phép dịch chuyển cơ sở dữ liệu từ Microsoft SQL Server, Microsoft Access, PostgreSQL, Sybase ASE, Sybase SQL ở mọi nơi.
– Cho phép dịch chuyển được cấu hình, chỉnh sửa, sao chép cũng như thực hiện và lên lịch với các dự án.
Với trình hướng dẫn di chuyển dữ liệu của MySQL, người dùng có thể chuyển đổi cơ sở dữ liệu hiện có sang MySQL trong vài phút thay vì hàng giờ hoặc vài ngày đối với các phương pháp truyền thống khác.
3. Những ưu điểm của MySQL
Có rất nhiều hệ quản trị cơ sở dữ liệu mở trên thị trường, nhưng MySQL vẫn là hệ quan trị cơ sở dữ liệu phổ biến nhất. Để các ông lớn trong làng công nghệ tin tưởng sử dụng, MySQL phải có những ưu điểm nhất định chính là:
3.1 Dễ sử dụng và linh hoạt
Quá trình cài đặt nhanh chóng và đơn giản, thông thường sẽ không tốn của bạn quá ba mươi phút. Do là một hệ cơ sở dữ liệu đơn giản, ít phức tạp lại có những tính năng cao nên MySQL rất được nhiều nhà phát triển tin dùng. MySQL còn cho phép bạn sửa mã nguồn miễn phí để đáp ứng nhu cầu cá nhân của mình.
3.2 Hiệu năng cao
Là một hệ cơ sở dữ liệu có tốc độ cao và ổn định, cho dù dữ liệu lưu trữ của bạn có lớn đến đâu, lớn như dữ liệu của các trang thương mại điện tử hay dữ liệu nặng nề trong hoạt động kinh doanh liên quan đến công nghệ thông tin thì MySQL đều có thể đáp ứng được.
Hơn thế nữa, với độ phổ biến của nó, một cộng đồng những người sử dụng MySQL luôn sẵn sàng hỗ trợ bạn, tư vấn các giải pháp cho bạn đối với các vấn đề mà họ biết.
3.3 Hệ quản trị tiêu chuẩn
Do đã tồn tại và phát triển nhiều năm trong ngành công nghệ nên sử dụng MySQL dường như đã trở thành một kỹ năng cơ bản của mỗi chuyên gia lập trình. Nhờ vậy người dùng MySQL cũng dễ dàng triển khai nhanh các dự án và tìm kiếm những chuyên gia hỗ trợ với mức phí hợp lý.
3.4 Độ bảo mật cao
Một trong những lý do MySQL được các ông lớn trong làng công nghệ sử dụng chính là do khả năng bảo mật, giữ an toàn dữ liệu. Tiêu chuẩn bảo mật của MySQL rất cao nhờ hệ thống quản lý tài khoản cũng như phân chia quyền truy cập của mình.
4. Hướng dẫn cài đặt MySQL Workbench
Trước khi có thể bắt đầu cài đặt được MySQL Workbench bạn cần phải thực hiện:
– Tải MySQL Community Server.
Link: http://dev.mysql.com/downloads/mysql/
– Tải MySQL Workbench.
Link: http://dev.mysql.com/downloads/workbench/
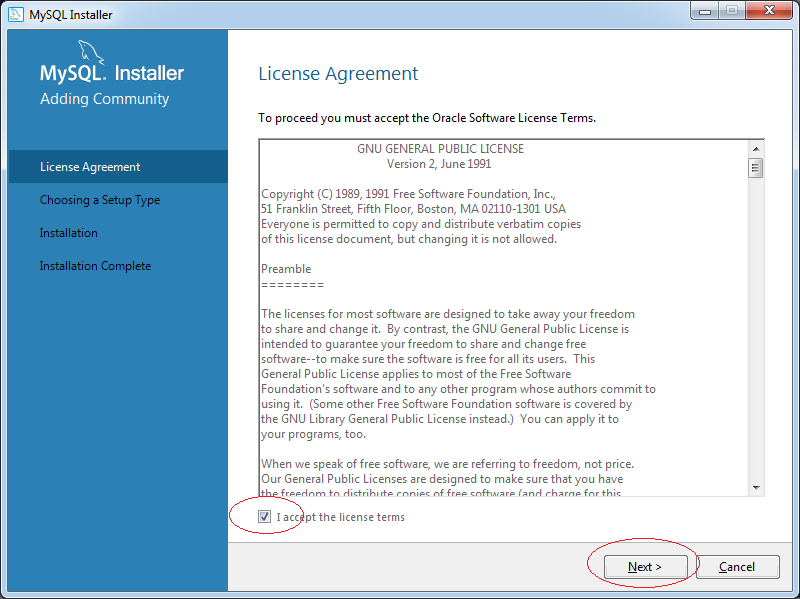
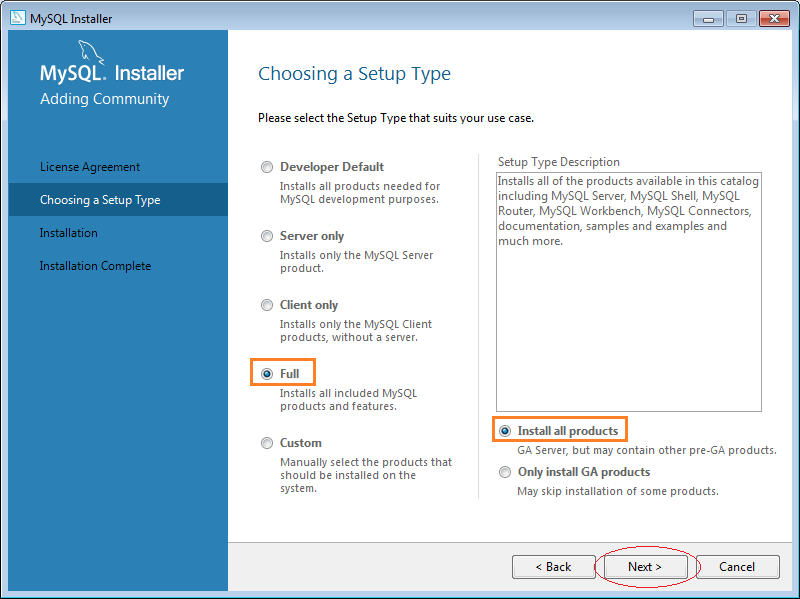
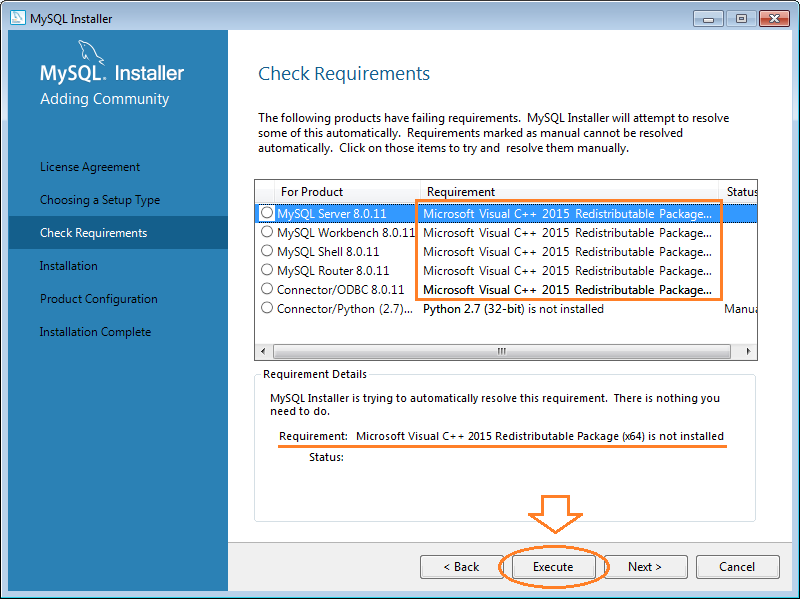
Sau đó, chúng ta tiến hành cài đặt như sau:

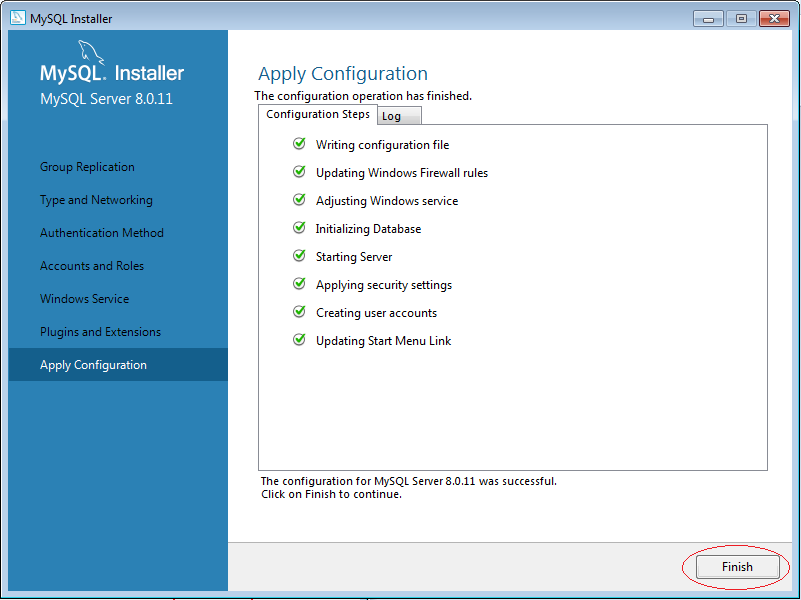

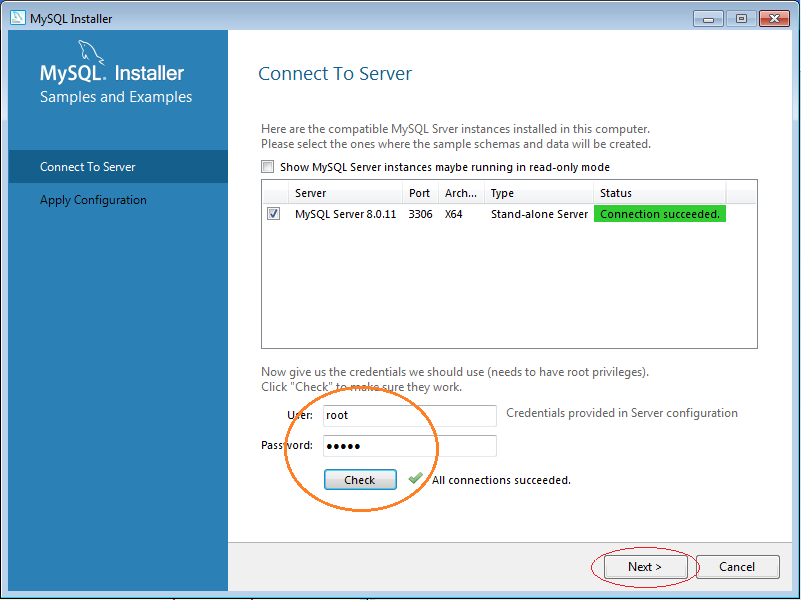
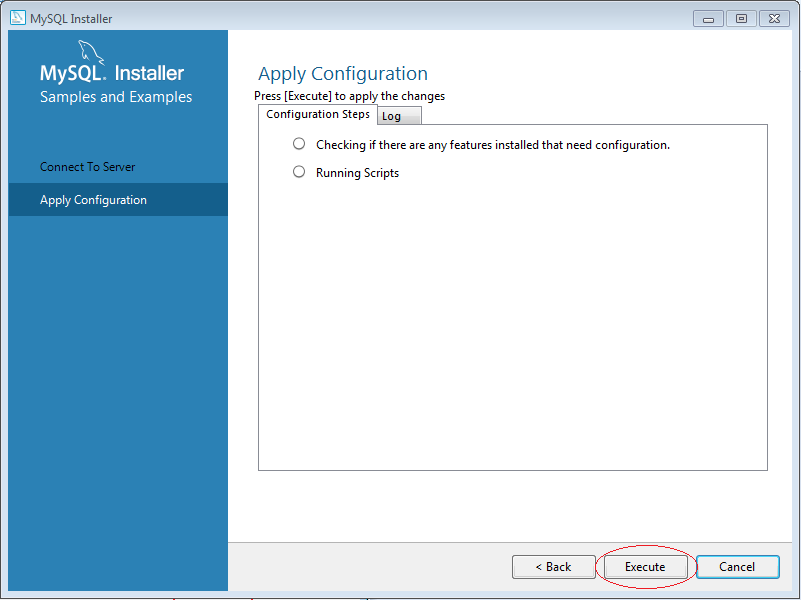
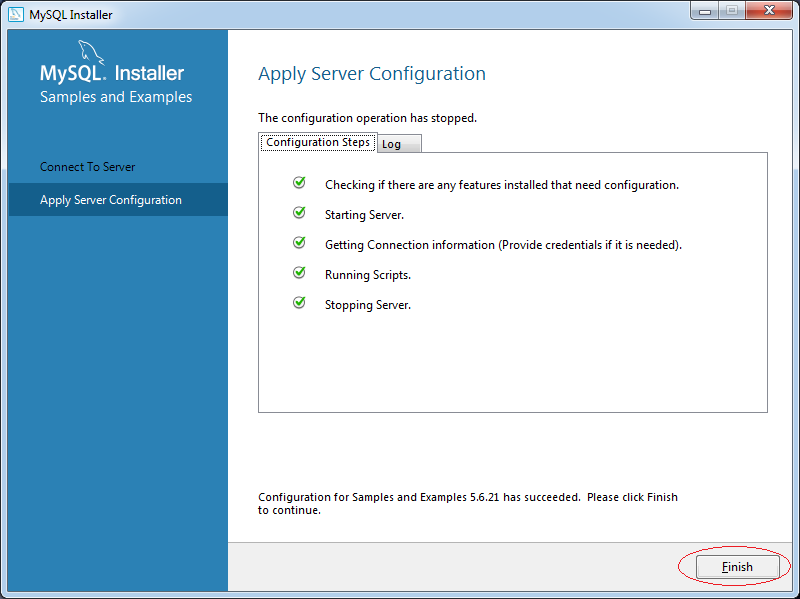
5. Cách sử dụng MySQL Workbench
5.1 Đặt cấu hình
Bước 1: Chạy chương trình MySQL Workbench
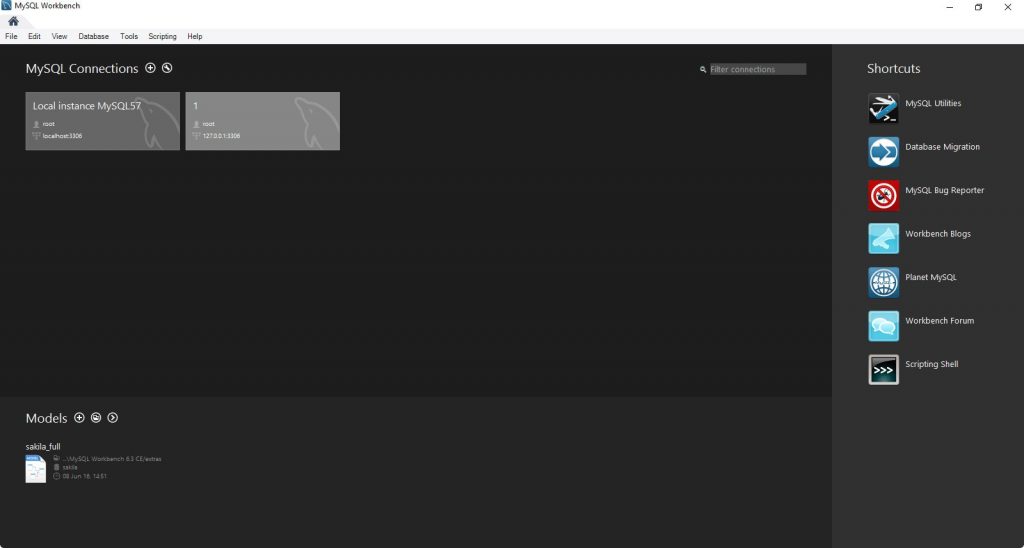
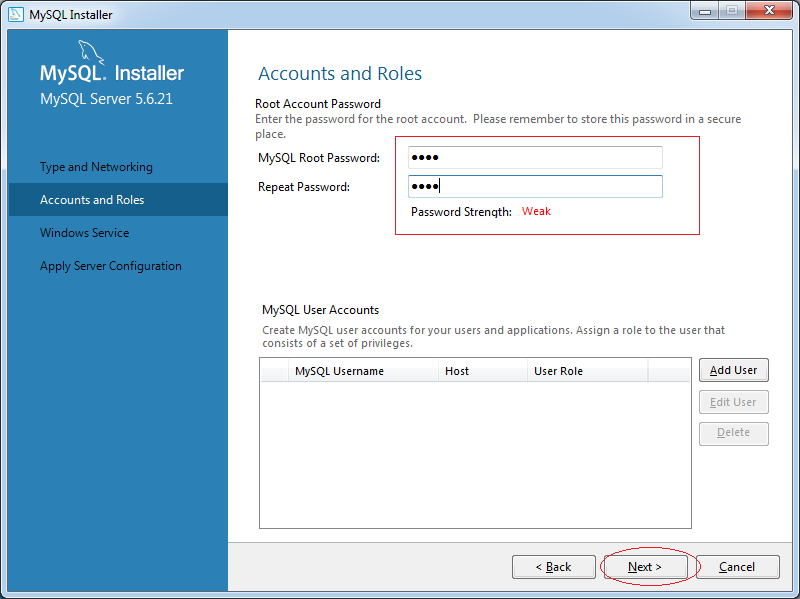
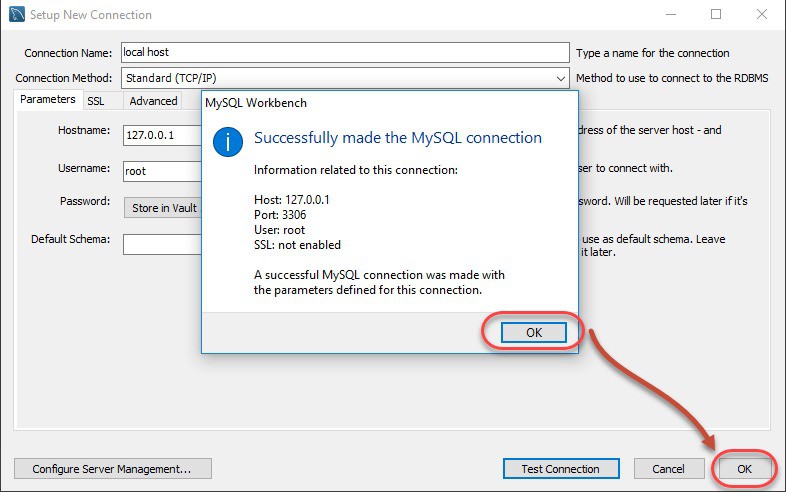
Bước 2: Tạo MySQL Server Connection bằng cách nhấn vào nút dấu cộng trong MySQL Workbench Home Window.

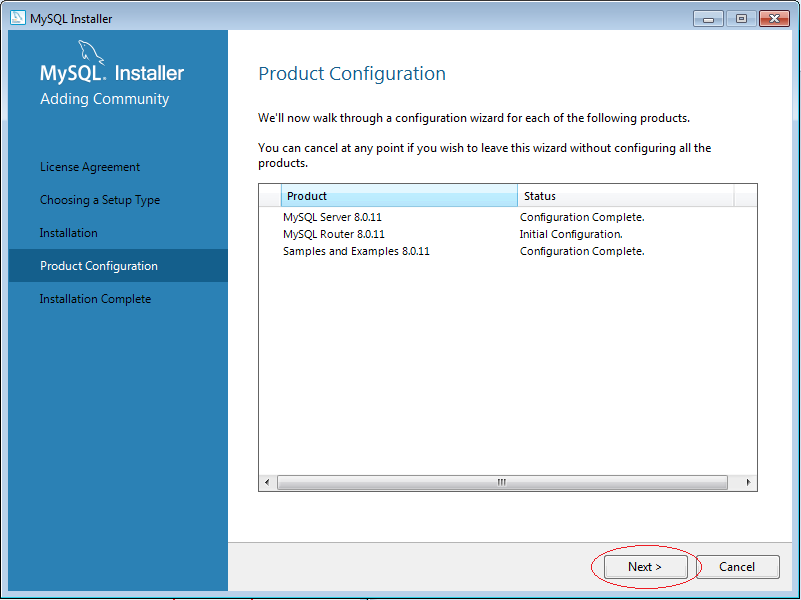
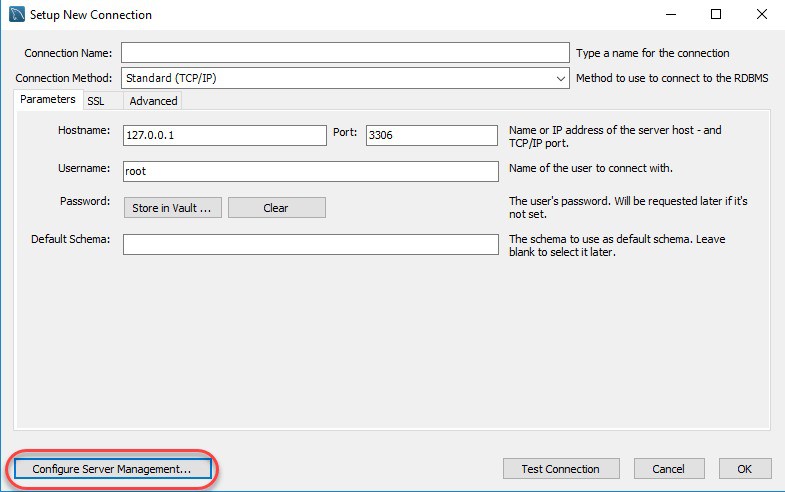
Bước 3: Nếu là người mới bắt đầu, bạn có thể cài đặt kết nối cục bộ cho server. Click vào Configure Server Management để kiểm tra cấu hình MySQL Server.
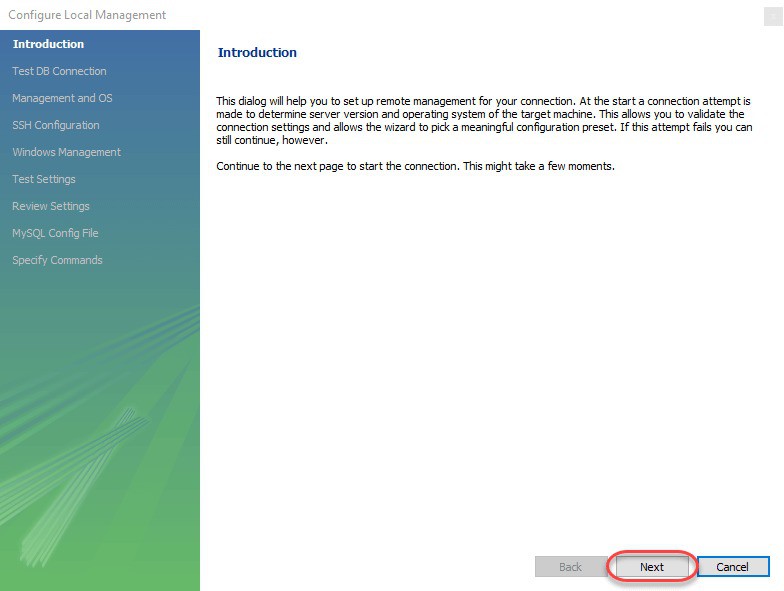
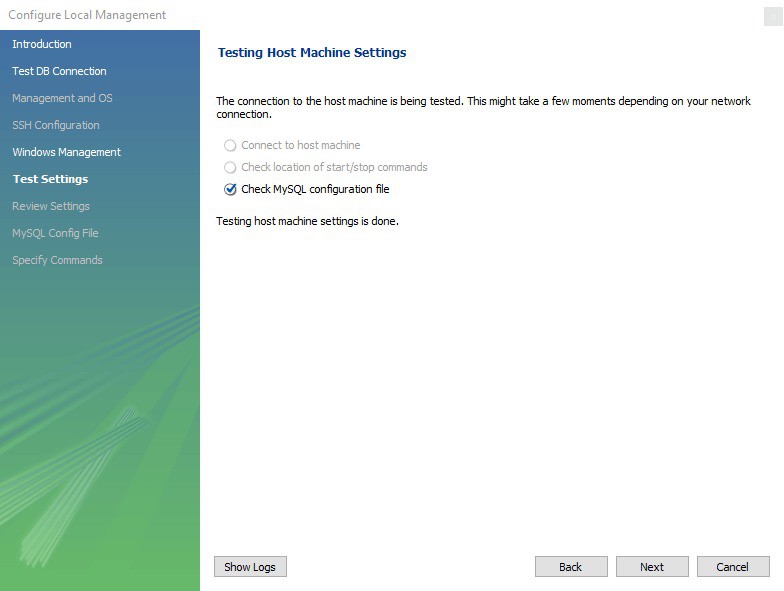
Bước 4: Click vào nút Next trong cửa sổ Configure Local Management để tiếp tục.
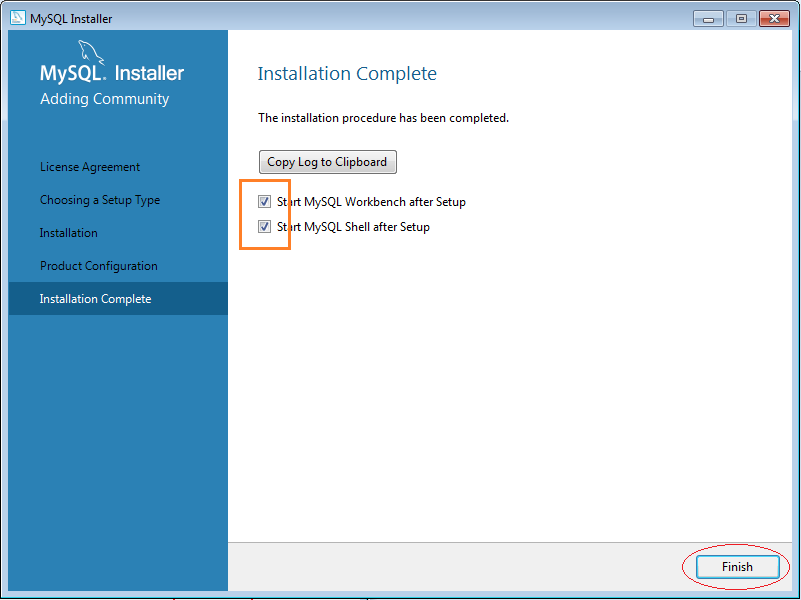
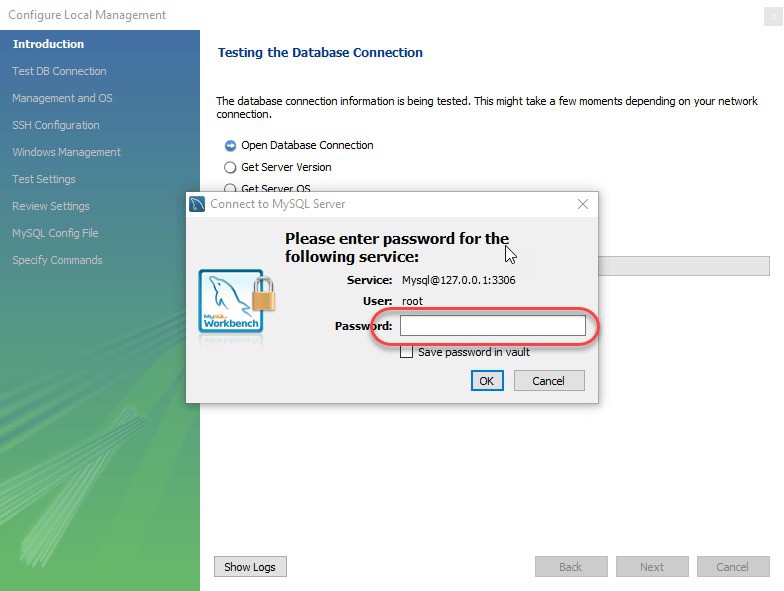
Bước 5: Sau khi kiểm tra các kết nối database, Winzard sẽ yêu cầu bạn nhập mật khẩu gốc để kiểm tra kết nối đến máy chủ MySQL cục bộ. Password được dùng là password mà bạn đặt khi cài đặt MySQL Workbench.
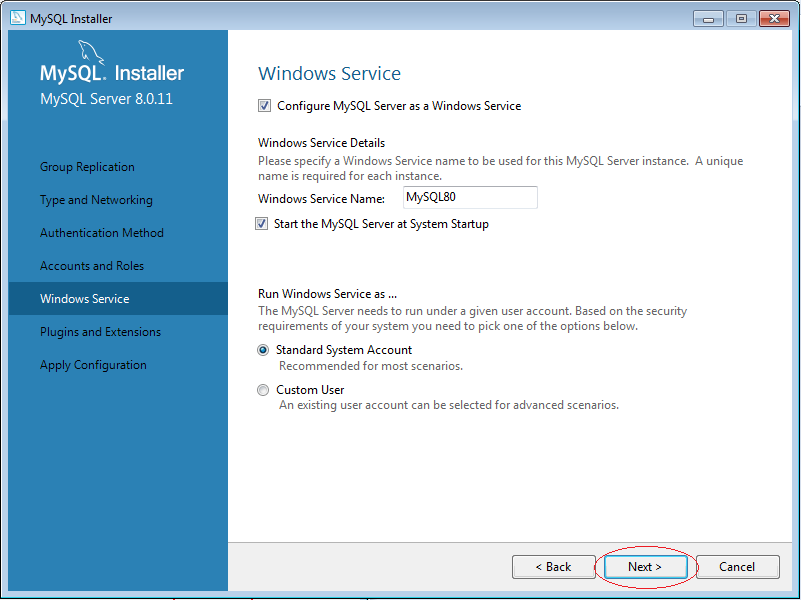
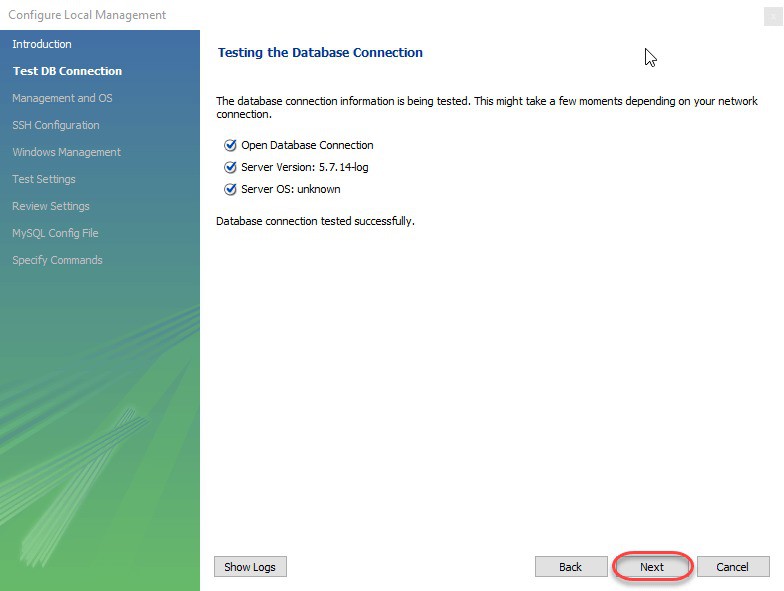
Bước 6: Wizard sẽ tiếp tục check kết nối đến database, cho phép bạn chuyển đổi giữa nhiều MySQL Server được cài trên cùng một máy, check khả năng truy cập vào Server Configuration Filetra và các lệnh Start/Stop. Việc của bạn là lick Next để đồng ý tiếp tục thực hiện các thao tác này.
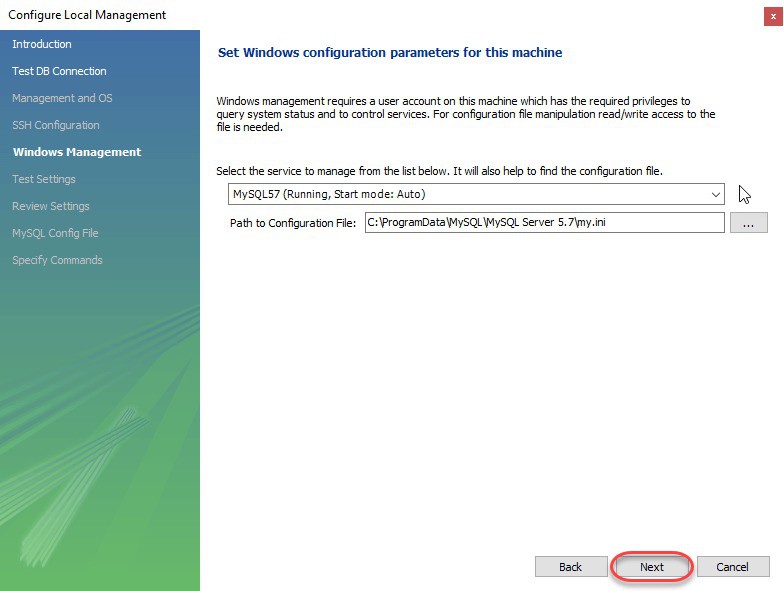
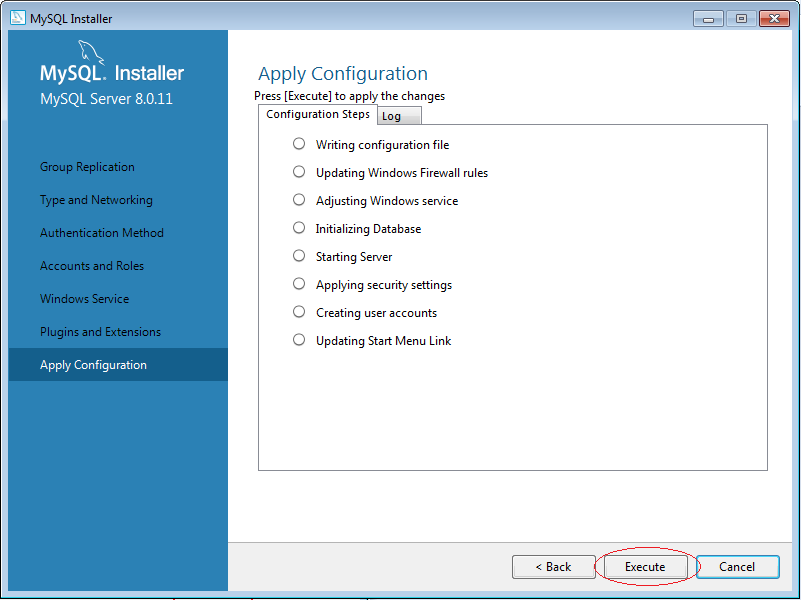
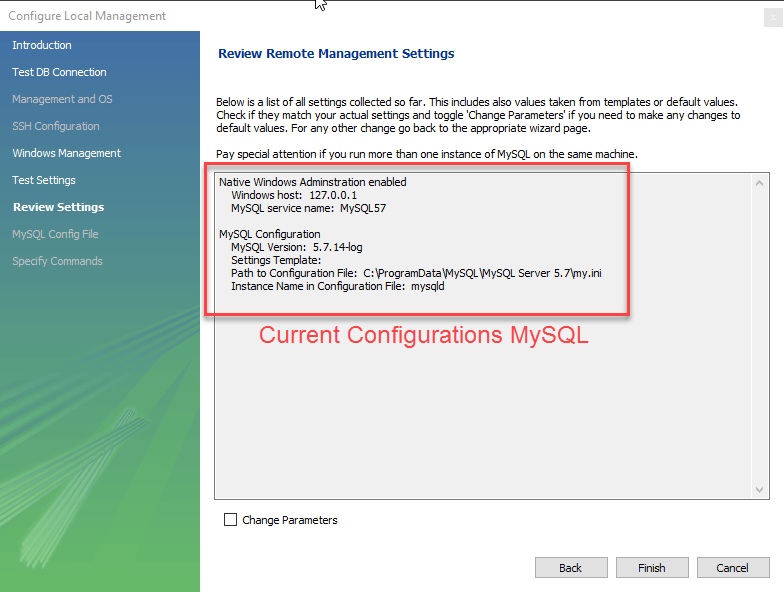
Bước 7: Cuối cùng, bạn nhấn Finish để hoài thành việc cài đặt sau khi xem lại các cấu hình.
5.2 Thiết lập kết nối
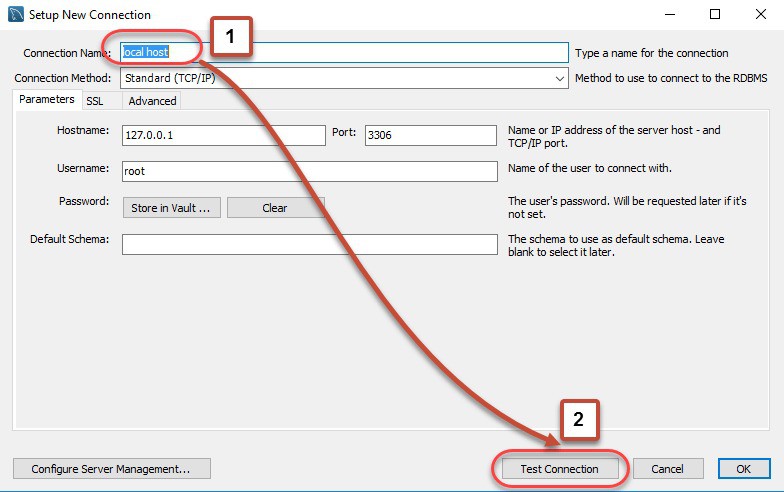
Bước 1: Để có thể kết nối đế server, bạn cần phải thực hiện giai đoạn thiết lập kết nối này. Ở bước này, bạn có thể tạo mới kết nối hoặc sử dụng những giá trị có sẵn được mặc định.
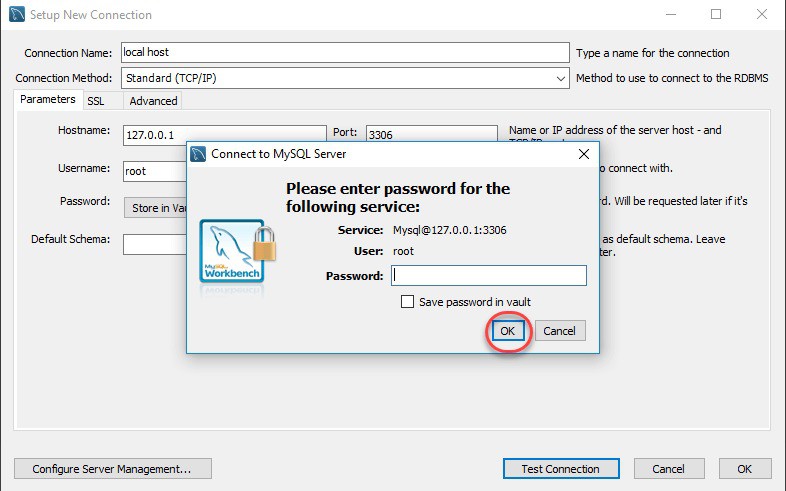
Bước 2: Nhập mật khẩu của root user MySQL của bạn và OK. Nếu đúng mật khẩu, tiếp tục lick vào OK để hoàn thành việc thiết lập kết nối.
Bước 3: Nhấn đúp vào hiển thị trên trang chủ và bắt đầu quá trình truy vấn của mình.

Trên đây bài viết của dbahire vừa gửi đến cho bạn đọc những thông tin về Mysql workbench và tổng quan về cách cài đặt cũng như những chức năng từ mysql workbench mang lại. Hi vọng bài viết hữu ích đến bạn.
The post Mysql Workbench là gì? Tại sao phải cài đặt Mysql Workbench appeared first on DBAhire.
↧