This webinar will cover the advantages and process for migrating from MariaDB/Galera cluster to MySQL InnoDB Cluster.
↧
Webinar – Migrating from MariaDB to MySQL
↧
DBLog: A Generic Change-Data-Capture Framework
Andreas Andreakis, Ioannis Papapanagiotou
Overview
Change-Data-Capture (CDC) allows capturing committed changes from a database in real-time and propagating those changes to downstream consumers [1][2]. CDC is becoming increasingly popular for use cases that require keeping multiple heterogeneous datastores in sync (like MySQL and ElasticSearch) and addresses challenges that exist with traditional techniques like dual-writes and distributed transactions [3][4].
In databases like MySQL and PostgreSQL, transaction logs are the source of CDC events. As transaction logs typically have limited retention, they aren’t guaranteed to contain the full history of changes. Therefore, dumps are needed to capture the full state of a source. There are several open source CDC projects, often using the same underlying libraries, database APIs, and protocols. Nonetheless, we found a number of limitations that could not satisfy our requirements e.g. stalling the processing of log events until a dump is complete, missing ability to trigger dumps on demand, or implementations that block write traffic by using table locks.
This motivated the development of DBLog, which offers log and dump processing under a generic framework. In order to be supported, a database is required to fulfill a set of features that are commonly available in systems like MySQL, PostgreSQL, MariaDB, and others.
Some of DBLog’s features are:
- Processes captured log events in-order.
- Dumps can be taken any time, across all tables, for a specific table or specific primary keys of a table.
- Interleaves log with dump events, by taking dumps in chunks. This way log processing can progress alongside dump processing. If the process is terminated, it can resume after the last completed chunk without needing to start from scratch. This also allows dumps to be throttled and paused if needed.
- No locks on tables are ever acquired, which prevent impacting write traffic on the source database.
- Supports any kind of output, so that the output can be a stream, datastore, or even an API.
- Designed with High Availability in mind. Hence, downstream consumers receive change events as they occur on a source.
Requirements
In a previous blog post, we discussed Delta, a data enrichment and synchronization platform. The goal of Delta is to keep multiple datastores in sync, where one store is the source of truth (like MySQL) and others are derived stores (like ElasticSearch). One of the key requirements is to have low propagation delays from the source of truth to the destinations and that the flow of events is highly available. These conditions apply regardless if multiple datastores are used by the same team, or if one team is owning data which another team is consuming. In our Delta blog post, we also described use cases beyond data synchronization, such as event processing.
For data synchronization and event processing use cases, we need to fulfill the following requirements, beyond the ability to capture changes in real-time:
- Capturing the full state. Derived stores (like ElasticSearch) must eventually store the full state of the source. We provide this via dumps from the source database.
- Triggering repairs at any time. Instead of treating dumps as a one-time setup activity, we aim to enable them at any time: across all tables, on a specific table, or for specific primary keys. This is crucial for repairs downstream when data has been lost or corrupted.
- Providing high availability for real-time events. The propagation of real-time changes has high availability requirements; it is undesired if the flow of events stops for a longer duration of time (such as minutes or longer). This requirement needs to be fulfilled even when repairs are in progress so that they don’t stall real-time events. We want real-time and dump events to be interleaved so that both make progress.
- Minimizing database impact. When connecting to a database, it is important to ensure that it is impacted as little as possible in terms of its bandwidth and ability to serve reads and writes for applications. For this reason, it is preferred to avoid using APIs which can block write traffic such as locks on tables. In addition to that, controls must be put in place which allow throttling of log and dump processing, or to pause the processing if needed.
- Writing events to any output. For streaming technology, Netflix utilizes a variety of options such as Kafka, SQS, Kinesis, and even Netflix specific streaming solutions such as Keystone. Even though having a stream as an output can be a good choice (like when having multiple consumers), it is not always an ideal choice (as if there is only one consumer). We want to provide the ability to directly write to a destination without passing through a stream. The destination may be a datastore or an external API.
- Supporting Relational Databases. There are services at Netflix that use RDBMS kind of databases such as MySQL or PostgreSQL via AWS RDS. We want to support these systems as a source so that they can provide their data for further consumption.
Existing Solutions
We evaluated a series of existing Open Source offerings, including: Maxwell, SpinalTap, Yelp’s MySQL Streamer, and Debezium. Existing solutions are similar in regard to capturing real-time changes that originate from a transaction log. For example by using MySQL’s binlog replication protocol, or PostgreSQL’s replication slots.
In terms of dump processing, we found that existing solutions have at least one of the following limitations:
- Stopping log event processing while processing a dump. This limitation applies if log events are not processed while a dump is in progress. As a consequence, if a dump has a large volume, log event processing stalls for an extended period of time. This is an issue when downstream consumers rely on short propagation delays of real-time changes.
- Missing ability to trigger dumps on demand. Most solutions execute a dump initially during a bootstrap phase or if data loss is detected at the transaction logs. However, the ability to trigger dumps on demand is crucial for bootstrapping new consumers downstream (like a new ElasticSearch index) or for repairs in case of data loss.
- Blocking write traffic by locking tables. Some solutions use locks on tables to coordinate the dump processing. Depending on the implementation and database, the duration of locking can either be brief or can last throughout the whole dump process [5]. In the latter case, write traffic is blocked until the dump completes. In some cases, a dedicated read replica can be configured in order to avoid impacting writes on the master. However, this strategy does not work for all databases. For example in PostgreSQL RDS, changes can only be captured from the master.
- Using proprietary database features. We found that some solutions use advanced database features that are not transferable to other systems, such as: using MySQL’s blackhole engine or getting a consistent snapshot for dumps from the creation of a PostgreSQL replication slot. This prevents code reuse across databases.
Ultimately, we decided to implement a different approach to handle dumps. One which:
- interleaves log with dump events so that both can make progress
- allows to trigger dumps at any time
- does not use table locks
- uses standardized database features
DBLog Framework
DBLog is a Java-based framework, able to capture changes in real-time and to take dumps. Dumps are taken in chunks so that they interleave with real-time events and don’t stall real-time event processing for an extended period of time. Dumps can be taken any time, via a provided API. This allows downstream consumers to capture the full database state initially or at a later time for repairs.
We designed the framework to minimize database impact. Dumps can be paused and resumed as needed. This is relevant both for recovery after failure and to stop processing if the database reached a bottleneck. We also don’t take locks on tables in order not to impact the application writes.
DBLog allows writing captured events to any output, even if it is another database or API. We use Zookeeper to store state related to log and dump processing, and for leader election. We have built DBLog with pluggability in mind allowing implementations to be swapped as desired (like replacing Zookeeper with something else).
The following subsections explain log and dump processing in more detail.
Log Processing
The framework requires a database to emit an event for each changed row in real-time and in a commit order. A transaction log is assumed to be the origin of those events. The database is sending them to a transport that DBLog can consume. We use the term ‘change log’ for that transport. An event can either be of type: create, update, or delete. For each event, the following needs to be provided: a log sequence number, the column state at the time of the operation, and the schema that applied at the time of the operation.
Each change is serialized into the DBLog event format and is sent to the writer so that it can be delivered to an output. Sending events to the writer is a non-blocking operation, as the writer runs in its own thread and collects events in an internal buffer. Buffered events are written to an output in-order. The framework allows to plugin a custom formatter for serializing events to a custom format. The output is a simple interface, allowing to plugin any desired destination, such as a stream, datastore or even an API.
Dump Processing
Dumps are needed as transaction logs have limited retention, which prevents their use for reconstituting a full source dataset. Dumps are taken in chunks so that they can interleave with log events, allowing both to progress. An event is generated for each selected row of a chunk and is serialized in the same format as log events. This way, a downstream consumer does not need to be concerned if events originate from the log or dumps. Both log and dump events are sent to the output via the same writer.
Dumps can be scheduled any time via an API for all tables, a specific table or for specific primary keys of a table. A dump request per table is executed in chunks of a configured size. Additionally, a delay can be configured to hold back the processing of new chunks, allowing only log event processing during that time. The chunk size and the delay allow to balance between log and dump event processing and both settings can be updated at runtime.
Chunks are selected by sorting a table in ascending primary key order and including rows, where the primary key is greater than the last primary key of the previous chunk. It is required for a database to execute this query efficiently, which typically applies for systems that implement range scans over primary keys.

Chunks need to be taken in a way that does not stall log event processing for an extended period of time and which preserves the history of log changes so that a selected row with an older value can not override newer state from log events.
In order to achieve this, we create recognizable watermark events in the change log so that we can sequence the chunk selection. Watermarks are implemented via a table at the source database. The table is stored in a dedicated namespace so that no collisions occur with application tables. Only a single row is contained in the table which stores a UUID field. A watermark is generated by updating this row to a specific UUID. The row update results in a change event which is eventually received through the change log.
By using watermarks, dumps are taken using the following steps:
- Briefly pause log event processing.
- Generate low watermark by updating the watermark table.
- Run SELECT statement for the next chunk and store result-set in-memory, indexed by primary key.
- Generate a high watermark by updating the watermark table.
- Resume sending received log events to the output. Watch for the low and high watermark events in the log.
- Once the low watermark event is received, start removing entries from the result-set for all log event primary keys that are received after the low watermark.
- Once the high watermark event is received, send all remaining result-set entries to the output before processing new log events.
- Go to step 1 if more chunks present.
The SELECT is assumed to return state from a consistent snapshot, which represents committed changes up to a certain point in history. Or equivalently: the SELECT executed on a specific position of the change log, considering changes up to that point. Databases typically don’t expose the log position which corresponds to a select statement execution (MariaDB is an exception).
The core idea of our approach is to determine a window on the change log which guarantees to contain the SELECT. As the exact selection position is unknown, all selected rows are removed which collide with log events within that window. This ensures that the chunk selection can not override the history of log changes. The window is opened by writing the low watermark, then the selection runs, and finally, the window is closed by writing the high watermark. In order for this to work, the SELECT must read the latest state from the time of the low watermark or later (it is ok if the selection also includes writes that committed after the low watermark write and before the read).
Figures 2a and 2b are illustrating the chunk selection algorithm. We provide an example with a table that has primary keys k1 to k6. Each change log entry represents a create, update, or delete event for a primary key. In figure 2a, we showcase the watermark generation and chunk selection (steps 1 to 4). Updating the watermark table at step 2 and 4 creates two change events (magenta color) which are eventually received via the log. In figure 2b, we focus on the selected chunk rows that are removed from the result set for primary keys that appear between the watermarks (steps 5 to 7).


Note that a large count of log events may appear between the low and high watermark, if one or more transactions committed a large set of row changes in between. This is why our approach is briefly pausing log processing during steps 2–4 so that the watermarks are not missed. This way, log event processing can resume event-by-event afterwards, eventually discovering the watermarks, without ever needing to cache log event entries. Log processing is paused only briefly as steps 2–4 are expected to be fast: watermark updates are single write operations and the SELECT runs with a limit.
Once the high watermark is received at step 7, the non-conflicting chunk rows are handed over to the written for in-order delivery to the output. This is a non-blocking operation as the writer runs in a separate thread, allowing log processing to quickly resume after step 7. Afterwards, log event processing continues for events that occur post the high watermark.
In Figure 2c we are depicting the order of writes throughout a chunk selection, by using the same example as figures 2a and 2b. Log events that appear up to the high watermark are written first. Then, the remaining rows from the chunk result (magenta color). And finally, log events that occur after the high watermark.

Database support
In order to use DBLog a database needs to provide a change log from a linear history of committed changes and non-stale reads. These conditions are fulfilled by systems like MySQL, PostgreSQL, MariaDB, etc. so that the framework can be used uniformly across these kind of databases.
So far, we added support for MySQL and PostgreSQL. Integrating log events required using different libraries as each database uses a proprietary protocol. For MySQL, we use shyiko/mysql-binlog-connector which implementing the binlog replication protocol in order to receive events from a MySQL host. For PostgreSQL, we are using replication slots with the wal2json plugin. Changes are received via the streaming replication protocol which is implemented by the PostgreSQL jdbc driver. Determining the schema per captured change varies between MySQL and PostgreSQL. In PostgreSQL, wal2json contains the column names and types alongside with the column values. For MySQL schema changes must be tracked which are received as binlog events.
Dump processing was integrated by using SQL and JDBC, only requiring to implement the chunk selection and watermark update. The same code is used for MySQL and PostgreSQL and can be used for other similar databases as well. The dump processing itself has no dependency on SQL or JDBC and allows to integrate databases which fulfill the DBLog framework requirements even if they use different standards.

High Availability
DBLog uses active-passive architecture. One instance is active and the others are passive standbys. We leverage Zookeeper for leader election to determine the active instance. The leadership is a lease and is lost if it is not refreshed in time, allowing another instance to take over. We currently deploy one instance per AZ (typically we have 3 AZs), so that if one AZ goes down, an instance in another AZ can continue processing with minimal overall downtime. Passive instances across regions are also possible, though it is recommended to operate in the same region as the database host in order to keep the change capture latencies low.
Production usage
DBLog is the foundation of the MySQL and PostgreSQL Connectors at Netflix, which are used in Delta. Delta is used in production since 2018 for datastore synchronization and event processing use cases in Netflix studio applications. On top of DBLog, the Delta Connectors are using a custom event serializer, so that the Delta event format is used when writing events to an output. Netflix specific streams are used as outputs such as Keystone.

Beyond Delta, DBLog is also used to build Connectors for other Netflix data movement platforms, which have their own data formats.
Stay Tuned
DBLog has additional capabilities which are not covered by this blog post, such as:
- Ability to capture table schemas without using locks.
- Schema store integration. Storing the schema of each event that is sent to an output and having a reference in the payload of each event to the schema store.
- Monotonic writes mode. Ensuring that once the state has been written for a specific row, a less recent state can not be written afterward. This way downstream consumers experience state transitions only in a forward direction, without going back-and-forth in time.
We are planning to open source DBLog in 2020 and include additional documentation.
Credits
We would like to thank the following persons for contributing to the development of DBLog: Josh Snyder, Raghuram Onti Srinivasan, Tharanga Gamaethige, and Yun Wang.
References
[1] Das, Shirshanka, et al. “All aboard the Databus!: Linkedin’s scalable consistent change data capture platform.” Proceedings of the Third ACM Symposium on Cloud Computing. ACM, 2012
[2] “About Change Data Capture (SQL Server)”, Microsoft SQL docs, 2019
[3] Kleppmann, Martin, “Using logs to build a solid data infrastructure (or: why dual writes are a bad idea)“, Confluent, 2015
[4] Kleppmann, Martin, Alastair R. Beresford, and Boerge Svingen. “Online event processing.” Communications of the ACM 62.5 (2019): 43–49
[5] https://debezium.io/documentation/reference/0.10/connectors/mysql.html#snapshots
DBLog: A Generic Change-Data-Capture Framework was originally published in Netflix TechBlog on Medium, where people are continuing the conversation by highlighting and responding to this story.
↧
↧
Webinar 12/19: Top 3 Features of MySQL

MySQL has been ranked as the second most popular database since 2012 according to DB-Engines. Three features help it retain its top position: replication, storage engines, and NoSQL support. During this webinar, we’ll discuss the MySQL architecture surrounding these features and how to utilize their full power when your application hits performance or design limits.
This webinar is geared towards new MySQL users as well as those with other database administration experience. However, it’s also useful for experienced users looking to refresh their knowledge.
Please join Sveta Smirnova on Thurs, Dec 19, 10 to 11 am PST.
If you can’t attend, sign up anyways we’ll send you the slides and recording afterward.
↧
Use Case: MySQL High Availability, Zero Downtime Maintenance and Disaster Recovery for SaaS
Zero Downtime SaaS Provider — How to Easily Deploy MySQL Clusters in AWS and Recover from Multi-Zone AWS Outages
This is the second post in a series of blogs in which we cover a number of different Continuent Tungsten customer use cases that center around achieving continuous MySQL operations with commercial-grade high availability (HA), geographically redundant disaster recovery (DR) and global scaling – and how we help our customers achieve this.
This use case looks at a multi-year (since 2012) Continent customer who is a large Florida-based SaaS provider dealing with sensitive (HIPAA Compliant) medical data, which offers electronic health records, practice management, revenue cycle management and data analytics for thousands of doctors.
What is the Challenge?
Lack of high availability in AWS. The challenge they were facing came from using AWS, which allowed them to rapidly provision database and application servers – BUT the instances, underlying storage, and management interface were not highly available.
What is the Solution?
By using Tungsten Clustering, they could and can quickly deploy large numbers of Tungsten MySQL clusters in AWS and recover from multi-zone AWS outages. The solution uses the Composite Active/Passive Tungsten Clustering topology – a Pod Architecture with multiple 3-node Active Clusters (for High Availability) and 3-node Passive Clusters (for Disaster Recovery).
The Pod Architecture provides practically infinite scalability for the SaaS providers as they can just keep adding new Pods when and as their customer base grows. Each Pod includes a 3-node Tungsten Cluster deployed in multi-AZ AWS, and a 3-node DR cluster deployed in another AWS Region with all sensitive traffic encrypted in flight (this covers application traffic as well).

What are the Benefits?
The benefits this SaaS provider customer is able to reap from our solution include continuous operations, high availability, scalability and better data protection.
One very important item, often overlooked, is that beside the excellent MySQL HA/DR/Geo-clustering software we offer, Continuent also helps sustain our customer’s continuous operations with our 24/7/365 support.
Our average response time for urgent support requests has been less than three (3) minutes during the past two years. All requests are handled by highly qualified MySQL experts with decades of operational experience with business-critical deployments.
This use case, like the others we’re covering in this blog series, clearly showcases how our solutions and best practices can help customers who manage business-critical MySQL environments achieve the availability, scalability and safe operations with fast response times they are looking for.

Related Resources
- Use Case Blog: Geo-Scale MySQL for Continuous Global Operations & Fast Response Times
- Technical Product Blog: Global Read-Scaling for MySQL / MariaDB / Percona Server using Tungsten Clustering
- Technical Blog: How To Architect MySQL to be Available No Matter What
- Technical Blog: How To Architect MySQL for Zero Downtime Maintenance
About Tungsten Clustering
Tungsten Clustering allows enterprises running business-critical MySQL database applications to cost-effectively achieve continuous operations with commercial-grade high availability (HA), geographically redundant disaster recovery (DR) and global scaling.
To find out more, visit our Tungsten Clustering product page.
↧
WEBINAR: From MariaDB to MySQL 8.0
WORDS OF WISDOM:
Like they say in Asia, nobody should use a fork. Tradition even dictates to “chop” all your forks and “stick” to the original.
Now, for those few of you, who by mistake, ventured to use a fork, Matthias from Pythian will show you the many reasons why you should always use the original and will demo the easy way to get back to using the real thing.
Register now: http://ora.cl/zy5BH
This webinar will cover the advantages and process for migrating from MariaDB/Galera cluster to InnoDB cluster. Over these last 2 years and especially with MySQL 8.0, MySQL Innodb Cluster has matured a lot. In this webinar our guest speaker Matthias Crauwels from Pythian will go over the key difference between both solutions.
Matthias will use his experience to show how to migrate your application from MariaDB/Galera cluster over to MySQL InnoDB cluster with the least possible amount of downtime.
WHO:
- Matthias Crauwels, Lead Database Consultant, Pythian
WHEN:
Thu, Dec 19: 09:00 Pacific time (America)
Thu, Dec 19: 10:00 Mountain time (America)
Thu, Dec 19: 11:00 Central time (America)
Thu, Dec 19: 12:00 Eastern time (America)
Thu, Dec 19: 14:00 São Paulo time
Thu, Dec 19: 17:00 UTC
Thu, Dec 19: 17:00 Western European time
Thu, Dec 19: 18:00 Central European time
Thu, Dec 19: 19:00 Eastern European time
Thu, Dec 19: 22:30 India, Sri Lanka
Fri, Dec 20: 00:00 Indonesia Western Time
Fri, Dec 20: 01:00 Singapore/Malaysia/Philippines time
Fri, Dec 20: 01:00 China time
Fri, Dec 20: 02:00 日本
Fri, Dec 20: 04:00 NSW, ACT, Victoria, Tasmania (Australia)
The presentation will be approximately 60 minutes long followed by Q&A.
↧
↧
Paving The Way Of Continuous MySQL Operations
Our team has continued to pave the way for Continuous MySQL Operations this year with our Continuent Tungsten products: Tungsten Clustering and Tungsten Replicator.
And we’d like to take this opportunity to thank you all – our customers, partners, followers and colleagues – for your support in 2019, and celebrate some of our successes with you…
2019 Continuent Momentum Highlights
- Launched three new Tungsten Clustering & Tungsten Replicator releases
- Introduced the new Tungsten Replicator (AMI) on the Amazon Marketplace
- Were named a 2020 Top Trending Product by Database Trends & Applications Magazine

2019 Continuent Customer Highlights
- 100%: Customer Satisfaction during the most recent customer survey
- 97.5%: our customer renewal rate, many with multi-year subscription renewals
- Three (3) minutes: our average response time for urgent customer support tickets
- 7 years: our average customer life-span using Continuent solutions
- 900+ & 700+: the number of Tungsten MySQL clusters (900+) deployed by our largest customer, with Tungsten Replicator instances (700+) feeding into their various web front-end applications
This is a key element of our offering: beside the state-of-the-art MySQL HA/DR/Geo-clustering software we offer, Continuent also helps sustain our customer’s continuous operations with our 24/7/365 support. All requests are handled by highly qualified MySQL experts with decades of operational experience with business-critical deployments.
Latest Tungsten Clustering & Tungsten Replicator Releases
Tungsten Clustering and Tungsten Replicator 6.1.1 for MySQL and MariaDB are our current releases (out of three this year).
The 6.1 product line comes with MySQL 8 support and has the ability to do active/active Composite Multi-Master.

The Tungsten Replicator (AMI) on the Amazon Marketplace
Tungsten Replicator (AMI) is a real-time replication engine for all MySQL variants (incl. Amazon Aurora and Amazon RDS), that runs in AWS cloud and provides real-time data feeds into Big Data Analytics, such as Amazon Redshift, Vertica and more.
To get started with the new Tungsten Replicator AMI, simply launch the types that you need – and the first of each type is FREE for 14 days (AWS infrastructure charges still apply). You will typically need two – one MySQL extractor and one applier into your choice of targets. Please note that free trials will automatically convert to a paid hourly subscription upon expiration.
Top Three Continuent Tungsten Features
- MySQL 8 Support
- Active/Active Composite Multi-Master
- Industry-best 24/7 MySQL Customer Service
Top Three Most Read New Blogs
Using Keep-Alives To Ensure Long-Running MySQL & MariaDB Sessions Stay Connected
Our most popular blog post this year discusses how to use the Tungsten Connector keep-alive feature to ensure long-running MySQL & MariaDB/Percona Server client sessions stay connected in a Tungsten Cluster. Read more…
Make It Faster: Improving MySQL Write Performance for Tungsten Cluster Slaves
Learn about the various options for performance tuning MySQL server for better slave replication performance with this blog post. Read more…
Why is My Java Application Freezing Under Heavy I/O Load?
Latency-sensitive applications running in Java sometimes experience unacceptable delays under heavy I/O load. This blog discusses why this problem occurs and what to do about it for applications running Tungsten Clustering for MySQL. Read more…
Top Three Most Watched Webinars
Is ‘Free’ Good Enough for Your MySQL Environment?
Watch the replay of this webinar with our partner Datavail hosted by Database Trends & Applications on whether free is good enough for business-critical MySQL database environments.
Listen in as Srinivasa Krishna, MySQL Practice Leader at Datavail, and Eero Teerikorpi, CEO & Founder at Continuent discuss the pros and cons of the DIY approach vs getting professional help in. Watch the replay
Geo-Scale MySQL & MariaDB in AWS
Learn how to build a global, multi-region MySQL / MariaDB / Percona cloud back-end capable of serving hundreds of millions of online multiplayer game accounts. Watch the replay
Multi-Region AWS Aurora vs Continuent Tungsten for MySQL & MariaDB
This webinar walks you through a comparison of building a global, multi-region MySQL / MariaDB / Percona cloud back-end using AWS Aurora versus Continuent Tungsten. Watch replay
Since 2004, we have been at the forefront of the market need with our solutions for platform agnostic, highly available, globally scaling, clustered MySQL databases that are driving businesses to the cloud (whether hybrid or not) today; and our software solutions are the expression of that. And plan to continue to do so.
These were some of our main highlights of 2019 – we look forward to more next year!
Smooth Sailing!
↧
Antijoin in MySQL 8
In MySQL 8.0.17, we made an observation in the well-known TPC-H benchmark for one particular query. The query was executing 20% faster than in MySQL 8.0.16. This improvement is because of the “antijoin” optimization which I implemented. Here is its short mention in the release notes:
“The optimizer now transforms a WHERE condition having NOT IN (subquery), NOT EXISTS (subquery), IN (subquery) IS NOT TRUE, or EXISTS (subquery) IS NOT TRUE internally into an antijoin, thus removing the subquery.”…
↧
Antijoin in MySQL 8
↧
The Shared Responsibility Model of Security in the Cloud

 When we think about the cloud, often we consider many of the benefits: scalability, elasticity, agility, and flexible pricing. As great as these features are, security also remains a business-critical concern. In an on-premise environment, every aspect of security is owned by you. Looking at the database layer specifically, these include (but are not limited to):
- Data encryption
- Database access control
- Network security
- OS security (both host and guest if in VM environment)
- Physical security
When done properly, that entails a significant amount of work and generally cost. In the cloud, those aspects are all still relevant and necessary for proper security. However, under the shared responsibility model, some of that work is offloaded from you and shifted to the cloud provider. Let’s look at what that model entails and how it is realized with the two most common cloud database deployments: IaaS and DBaaS.
Shared Responsibility Model
While each cloud provider may have some specific terms, the general concept is the same. Security is broken into two components: security “of” the cloud and security “in” the cloud. For the sake of discussion, here is the AWS definition of this model:

Security of the Cloud
This is the portion of the shared responsibility model that is handled by the cloud provider. It includes the hardware, host operating system, and physical security of the infrastructure. By moving to the cloud, many of these logistical challenges are immediately offloaded from the customer.
Security in the Cloud
With the physical security of the cloud handled by the cloud vendor, the security responsibility of the customer is much more targeted. Access to customer data remains the most critical component. Even with armed guards standing next to your servers, you don’t want to open port 3306 to the world and allow root access to the database. This is where the deployment type determines the level of security “in” the cloud implemented by the customer.
Self Managed Deployment (IaaS)
With a seasoned database team or complex environment, a self-managed deployment is often preferred. This approach uses the IaaS components of the cloud (compute instances, storage, and networking) to mimic the existing environment. While there is nothing wrong with this approach, the customer will assume more security responsibility. In fact, the base model highlighted above is identical when looking at a self-managed deployment. The customer is responsible for:
-
Managing compute guest OS
- Updates, security patches, etc
- Managing and configuring all network components
- Firewall management
-
Database operation
- Security, patches, backups, etc
- Access management
- Customer Data
Again, this is a completely viable approach and sometimes fully required depending on use case. However, let’s look at how that model shifts when leveraging a DBaaS offering.
Managed Deployment (DBaaS)
Even when looking at a managed offering (Amazon RDS for example), there is still a level of responsibility that falls with the customer. However, the scope and focus is different. Here is how the shared model differs when looking at a managed offering:

The first thing that jumps out is all of the guest OS and application responsibility has shifted to the cloud provider. This can free up your team to focus on the core of the database layer – the customer data. The customer is still responsible to manage any client-side encryption, the database firewall, and access to the customer data. However, there is a massive amount of day-to-day operational work is shifted away from your team as the burden is moved to the cloud provider.
Keep in mind that “managed” doesn’t remove the need for a DBA. While much of the operational support is covered, standard DBA tasks remain. In an upcoming post, we’ll discuss the tasks that are still required and why you need to continue to pay attention to your database.
Summary
As you can see, the cloud does help to remove some of the traditional work and overhead associated with managing a database tier. Regardless of which deployment type is used, the customer is always (and will always be) responsible for managing the most important asset: customer data. Similarly, analyzing the workload, traffic, and performance is always the responsibility of the customer. While cloud services guarantee individual components are within SLAs, the customer is always responsible for managing their own workload, including:
- Query Tuning
- Capacity Planning
- Right-sizing resources
- Disaster Recovery
These are the core aspects of the database tier and moving to cloud simply allows you to focus your efforts on building the best application possible while leaving the infrastructure details to someone else. So if you are investigating a migration into the cloud, Percona can help you to review your options and architect a system that works best for your organization. Let us know how we can help!
Companies are increasingly embracing database automation and the advantages offered by the cloud. Our new white paper discusses common database scenarios and the true cost of downtime to your business, including the potential losses that companies can incur without a well-configured database and infrastructure setup.
Download “The Hidden Costs of Not Properly Managing Your Databases”
↧
↧
Webinar 12/20: Pros and Cons of PCI/DSS Certification with MySQL

 This talk uncovers which tools/plugins/settings you need to use to comply with PCI/DSS when using MySQL. Gain a solid grasp of the possibilities, as well as the limitations, MySQL offers to someone looking to become PCI/DSS certified.
Please join Percona Support Engineer Carlos Tutte on Friday, Dec 20, 2 – 3 pm EST to learn the pros and cons of PCI/DSS Certification with MySQL.
If you can’t attend, sign up anyways we’ll send you the slides and recording afterward.
↧
Give Love to Your SSDs – Reduce innodb_io_capacity_max!

 The innodb_io_capacity and innodb_io_capacity_max are often misunderstood InnoDB parameters. As consultants, we see, at least every month, people setting this variable based on the top IO write specifications of their storage. Is this a correct choice? Is it an optimal value for performance? What about the SSD/Flash wear leveling?
Innodb_io_capacity 101
Let’s begin with what the manual has to say about innodb_io_capacity:
“The innodb_io_capacity variable defines the number of I/O operations per second (IOPS) available to InnoDB background tasks, such as flushing pages from the buffer pool and merging data from the change buffer.“
What does this mean exactly? Like most database engines, when you update a piece of data inside InnoDB, the update is made in memory and only a short description of the modification is written to the redo log files before the command actually returns. The affected page (or pages) in the buffer pool are marked as dirty. As you write more data, the number of dirty pages will rise, and at some point, they need to be written to disk. This process happens in the background and is called flushing. The innodb_io_capacity defines the rate at which InnoDB will flush pages. To better illustrate, let’s consider the following graph:

Impacts of innodb_io_capacity on idle flushing
We used the tool sysbench for a few seconds to generate about 45000 dirty pages in the buffer pool and then we let the flushing process run for three values of innodb_io_capacity: 300, 200, and 100. The configuration was adjusted to avoid other sources of writes. As we can see, the number of pages written per second matches the innodb_io_capacity value. This type of flushing is called the idle flushing. The idle flushing happens only when InnoDB is not processing writes. It is the only time the flushing is dominated by innodb_io_capacity. The variable innodb_io_capacity is also used for the adaptive flushing and by the change buffer thread for the background merges of secondary index updates. On a busy server, when the adaptive flushing algorithm is active, the innodb_io_capacity_max variable is much more important. A blog post devoted to the internals of the InnoDB adaptive flushing algorithm is in preparation.
Are Dirty Pages Evil?
What are the pros and cons of having a large number of dirty pages? Are there good reasons to flush them as fast as possible?
If we start with the cons, a large number of dirty pages will increase the MySQL shutdown time since the database will have to flush all those pages before stopping. With some planning, the long shutdown time issue can easily be mitigated. Another negative impact of a large number of dirty pages is the recovery time after a crash, but that is quite exceptional.
If a page stays dirty for a while in the buffer pool, it has the opportunity to receive an additional write before it is flushed to disk. The end result is a deflation of the write load. There are schema and query patterns that are more susceptible to a write load reduction. For example, if you are inserting collected metrics in a table with the following schema:
CREATE TABLE `Metrics` (
  `deviceId` int(10) unsigned NOT NULL,
  `metricId` smallint(5) unsigned NOT NULL,
  `Value` float NOT NULL,
  `TS` int(10) unsigned NOT NULL,
  PRIMARY KEY (`deviceId`,`metricId`,`TS`),
  KEY `idx_ts` (`TS`)
) ENGINE=InnoDB DEFAULT CHARSET=latin1
If there are 20k devices each with 8 metrics, you know there are 160k hot pages. Ideally, these pages shouldn’t be written to disk until they are full, actually half-full since they are part of a mid-inserted b-tree.
Another example is a users table where the last activity time is logged. A typical schema could be:
CREATE TABLE `users` (
  `user_id` int(10) unsigned NOT NULL AUTO_INCREMENT,
  `last_login` timestamp NOT NULL DEFAULT CURRENT_TIMESTAMP,
  `last_activity` timestamp NOT NULL DEFAULT CURRENT_TIMESTAMP,
  `user_pref` json NOT NULL,
  PRIMARY KEY (`user_id`)
) ENGINE=InnoDB AUTO_INCREMENT=6521901 DEFAULT CHARSET=latin1
Often, only a small subset of the users is active at a given time so the same pages will be updated multiple times as the users navigate in the application. To illustrate this behavior, we did a little experiment using the above schema and actively updating a random subset of only 30k rows out of about 6.5M. A more realistic example would require a lab more capable than this old laptop. During the experiment the following settings were used:
innodb_adaptive_flushing_lwm = 0
innodb_io_capacity = 100
Innodb_flush_neighbors = off
For each run, we varied innodb_io_capacity_max and calculated the ratio of updates over page flushed over a duration of 30 minutes. We never reached a furious flushing situation.

As we can see, when we limit innodb_io_capacity_max to 100, there are about 62 updates per page flushed, while at the other end, with the IO capacity set to 5000, there were only about 20 updates per page flushed. This means, just by tuning innodb_io_capacity_max, we modified the overall write load by a factor of three.
Impacts of Excessive Flushing on Performance
When an InnoDB page is in the process of being flushed to disk, its access is limited and a query needing its content may have to wait until the IO operation completes. An excessive write load also puts pressure on storage and CPU resources. In the above experiment where we varied innodb_io_capacity_max, the update rate went from above 6000 trx/s with innodb_io_capacity_max at 100 to less than 5400 trx/s with innodb_io_capacity_max at 4000. Simply overshooting the values of innodb_io_capacity and innodb_io_capacity_max is not optimal for performance.
SSD/Flash Wear Leveling
But why is the amount of writes so important and what has it to do with flash devices?
Flash devices are good, we know that, but this performance improvement comes with a downside: endurance. Normally SSDs are capable of doing much less write operations in each sector than regular spinning drives. It all boils down to the way bits are stored using NAND gates. The bits are represented by a voltage level across a set of gates and the slightest deterioration of a gate, as it is cycled between values, affects these voltage levels. Over time, a memory element is no longer reaching the proper voltage. Cheaper flash devices store more bits per set of gates, per storage cells, so they are more affected by the deterioration of voltage levels. SSDs also have more or less spare storage cells to fix broken ones.
Let’s look at the endurance of some SSDs. We chose a few models from the Intel web site mostly because estimate prices are provided.
| Model | Type | Size | Endurance (cycle) | Price |
| Optane DC P4800X | Enterprise | 1.5 TB | 112,000 | $ 4,975 |
| DC P4610 | Enterprise | 1.6 TB | 7,840 | $ 467 |
| 545S | Consumer | 512 GB | 576 | $ 120 |
The endurance is expressed in full write cycles, the number of times the device can be completely overwritten. The endurance is one of the main variables affecting the price. The enterprise-grade SSDs have a higher endurance than the consumer-grade ones. The Optane series is at the high end of the enterprise offering.
Devices like the DC P4610 are fairly common. The specs of the drive in the above table show a total write endurance of 12.25 PB (7,840 full device writes) and the ability to perform 640k read IOPS and about 200k write IOPS. If we assume a server life of five years, this means the average write bandwidth has to be less than:
12.25 PB * 1024^3 MB/PB / (5y * 365 d/y * 24 h/d * 3600 s/h) ~ 83 MB/sec.
The Impact of the Filling Factor
So, in theory, you could write at 83MB/sec for five years. This is very high but… it implies an empty device. If there is a static dataset, like old data nobody wants to prune, filling 75% of the SSD, the situation is very different. Now, only 25% of the drive is getting all the writes and those storage cells are cycled much faster. We are down to an average of about 21 MB/sec over five years. That is still a decent bandwidth but it falls into more realistic use cases.
The following figure shows the average write bandwidth needed to reach the SSD endurance specification as a function of the filling factor. With SSDs, if the disks are rather full, it is a good idea to regularly, maybe yearly or every 6 months, wipe out the data and reload it. This process reshuffles the data and helps spread the strain to all the storage cells. If you are using Percona XtraDB Cluster, that amounts at triggering a full SST after deleting the dataset and maybe run fstrim if the filesystem is not mounted with the discard option.

Now, in terms of InnoDB write load, because of things like the doublewrite buffer, the redo log, the undo log, and the binary log, when InnoDB writes a 16KB page to disk, the actual amount of data written is higher, between 32KB and 48KB. This estimate is highly dependent on the schema and workload but as a rough estimate, we can estimate 36KB written per page flushed.
We often see very high values for both innodb_io_capacity and innodb_io_capacity_max, as people look at the specs of their SSDs and set a very high number. Values of many tens of thousands are common; we have even seen more than 100k a few times. Such high values lead to an aggressive InnoDB flushing – way more than needed. There are very few dirty pages in the buffer pool and performance is degraded. The InnoDB checkpoint age value is likely very close to innodb_adaptive_flushing_lwm times the max checkpoint age value.
On a moderately busy server, sustained InnoDB flushing rates of 2000 pages per second can easily be reached. Given our estimate of 36KB written per page flushed, such a flushing rate produces a write bandwidth of 70 MB/s. Looking at the previous figure, if the SSD used has similar specs and is more than 75% filled, it will not last 5 years; rather, likely less than one and a half years.
Conclusion
This post is trying to shed some light on a common problem we are observing much more frequently than we would like. Actually, we are surprised to see a lot of people recommending increasing the IO capacity settings practically out of the box instead of paying attention to some other settings.
So, be nice, keep io_capacity settings as low as you need them – your SSDs will thank you! 🙂
↧
preFOSDEM 2020 MySQL Days: the schedule
The schedule of the preFOSDEM Day is now available !

We had a lot of proposals to deal with. Also this is a MySQL event where we, the MySQL Team has the possibility to show to you, our Community, all what we have working on to improve MySQL but also new stuff. We also invite some of our friends from the MySQL Community to talk about their experience.
I think we did a good selection and propose you new content. We are extremely happy to have Saverio Miroddi from TicketSolve talking about MySQL 8.0, Uber talking about InnoDB Cluster, and Facebook about Binlog.
As you can see, we will have 2 rooms, where one will be dedicated mostly to SQL and Optimizer topics but also tutorials.
You can also see that this year we also want to put some spot lights to MySQL NDB Cluster. You will see what is it, how is it used and what’s new. We will also have 2 community speakers sharing their MySQL NDB knowledge: Giuseppe Maxia, will show you how to get familiar with NDB without having to deploy it on complicated architecture and Marco Tusa from Percona will also show you how to used it with ProxySQL.
I’ve also heard that there will be new stuff…. 
Don’t forget to register if you want to join this event that will be held in Brussels, January 30 and 31: https://mysqldays2020.eventbrite.com
Day 1 – Thursday, January 30
| Madera | Azzar |
||||||||
|---|---|---|---|---|---|---|---|---|---|
| From | To | Title | Speaker | Company | Title | Speaker | Company | ||
| 9:30 | 10:00 | MySQL Community Welcome | Lenka Kasporova, David Stokes, Frédéric Descamps |
Oralce | |||||
| 10:00 | 10:30 | Simplifying MySQL | Geir Hoydalsvik | Oracle | |||||
| 10:30 | 11:05 | MySQL Replication | Kenny Gryp | Oracle | |||||
| 11:05 | 11:25 | Coffee Break | |||||||
| 11:25 | 11:55 | MySQL Clone: A better way to migrate databases | Georgi Kodinov | Oracle | Indexing JSON Arrays in MySQL | Dag Wanvik | Oracle | ||
| 12:00 | 12:30 | MySQL Group Replication: Best Practices for Handling Network Glitches |
Pedro Gomes | Oracle | Everything you always wanted to know about datetime types but didn’t have time to ask – How to avoid the most common pitfalls of date and time types in MySQL |
Martin Hansson | Oracle | ||
| 12:35 | 13:30 | Lunch Break | |||||||
| 13:30 | 14:00 | Friends let real friends use MySQL 8.0 | Saverio Miroddi | TicketSolve | CHECK Constraints in MySQL 8.0 | Dmitry Lenev | Oracle | ||
| 14:05 | 14:35 | MySQL Connectors | Kenny Gryp | Oracle |
Table value constructors in MySQL 8.0 | Catalin Beleaga | Oracle | ||
| 14:40 | 15:10 | MySQL InnoDB Cluster Making Provisioning and Troubleshooting as easy as pie |
Miguel Araújo | Oracle | MySQL 8.0 Security | Georgi Kodinovg | Oracle | ||
| 15:15 | 15:40 | Coffee Break | |||||||
| 15:40 | 16:10 | Best practices to upgrade to MySQL 8.0 | Frédéric Descamps | Oracle | MySQL 8.0 Document Store Tutorial |
David Stokes | Oracle | ||
| 16:15 | 16:45 | New Redo Log in MySQL 8.0 InnoDB: Improvements for high concurrency |
Pawel Olchawa | Oracle | |||||
| 16:50 | 17:20 | Hash Join in MySQL 8.0 | Erik Frøseth | Oracle | |||||
| 17:25 | 17:55 | MySQL 8.0 EXPLAIN ANALYZE | Norvald H. Ryeng | Oracle | |||||
Day 2 – Friday, January 31
| Madera | Azzar |
||||||||
|---|---|---|---|---|---|---|---|---|---|
| From | To | Title | Speaker | Company | Title | Speaker | Company | ||
| 9:30 | 10:00 | MySQL Community Welcome | Lenka Kasporova, David Stokes, Frédéric Descamps |
Oralce | |||||
| 10:00 | 10:30 | Extreme Performance with MySQL Analytics Service | Nipun Agarwal | Oracle | |||||
| 10:30 | 11:05 | MySQL Replication Performance in the Cloud | Vitor Oliveira |
Oracle | |||||
| 11:05 | 11:25 | Coffee Break | |||||||
| 11:25 | 11:55 | MySQL NDB 8.0 101 | Bernd Ocklin |
Oracle | MySQL Database Architectures Tutorial – part I |
Miguel Araújo Luis Soares |
Oracle | ||
| 12:00 | 12:30 | MySQL NDB 8.0 clusters in your laptop with DBdeployer |
Giuseppe Maxia |
DBdeployer |
|||||
| 12:35 | 13:30 | Lunch Break | |||||||
| 13:30 | 14:00 | SQL with MySQL NDB 8.0 faster than your NoSQL allow | Bernd Ocklin | Oracle |
MySQL Database Architectures Tutorial – part II |
Miguel Araújo Luis Soares |
Oracle | ||
| 14:05 | 14:35 |
Boosting MySQL NDB Cluster & MySQL InnoDB Cluster with ProxySQL V2 |
Marco Tusa | Percona | |||||
| 14:40 | 15:10 | Machine Learning for automating MySQL service |
Nipun Agarwal | Oracle | |||||
| 15:15 | 15:40 | Coffee Break | |||||||
| 15:40 | 16:10 | Binlog and Engine Consistency Under Reduced Durability | Yoshinori Matsunobu | Facebook |
MySQL NDB 8.0 Cluster Tutorial |
Frazer Clement | Oracle | ||
| 16:15 | 16:45 | Benchmarks -vs- Benchmarks | Dimitri Kravtchuk |
Oracle | |||||
| 16:50 | 17:20 | Onboarding to MySQL Group Replication at Uber | Giedrius Jaraminas Henrik Korku |
Uber | |||||
| 17:25 | 17:55 | Vitess: the sharding solution for MySQL 8.0 | Liz Van Dijk | PlanetScale | |||||

Please note that the current schedule is subject to change.
↧
Maximizing Database Query Efficiency for MySQL - Part One
Slow queries, inefficient queries, or long running queries are problems that regularly plague DBA's. They are always ubiquitous, yet are an inevitable part of life for anyone responsible for managing a database.
Poor database design can affect the efficiency of the query and its performance. Lack of knowledge or improper use of function calls, stored procedures, or routines can also cause database performance degradation and can even harm the entire MySQL database cluster.
For a master-slave replication, a very common cause of these issues are tables which lack primary or secondary indexes. This causes slave lag which can last for a very long time (in a worse case scenario).
In this two-part series blog, we'll give you a refresher course on how to tackle the maximizing of your database queries in MySQL to driver better efficiency and performance.
Always Add a Unique Index To Your Table
Tables that do not have primary or unique keys typically create huge problems when data gets bigger. When this happens a simple data modification can stall the database. Lack of proper indices and an UPDATE or DELETE statement has been applied to the particular table, a full table scan will be chosen as the query plan by MySQL. That can cause high disk I/O for reads and writes and degrades the performance of your database. See an example below:
root[test]> show create table sbtest2\G

*************************** 1. row ***************************

       Table: sbtest2

Create Table: CREATE TABLE `sbtest2` (

  `id` int(10) unsigned NOT NULL,

  `k` int(10) unsigned NOT NULL DEFAULT '0',

  `c` char(120) NOT NULL DEFAULT '',

  `pad` char(60) NOT NULL DEFAULT ''

) ENGINE=InnoDB DEFAULT CHARSET=latin1

1 row in set (0.00 sec)


root[test]> explain extended update sbtest2 set k=52, pad="xx234xh1jdkHdj234" where id=57;

+----+-------------+---------+------------+------+---------------+------+---------+------+---------+----------+-------------+

| id | select_type | table   | partitions | type | possible_keys | key  | key_len | ref | rows | filtered | Extra       |

+----+-------------+---------+------------+------+---------------+------+---------+------+---------+----------+-------------+

|  1 | UPDATE      | sbtest2 | NULL       | ALL | NULL | NULL | NULL    | NULL | 1923216 | 100.00 | Using where |

+----+-------------+---------+------------+------+---------------+------+---------+------+---------+----------+-------------+

1 row in set, 1 warning (0.06 sec)
Whereas a table with primary key has a very good query plan,
root[test]> show create table sbtest3\G

*************************** 1. row ***************************

       Table: sbtest3

Create Table: CREATE TABLE `sbtest3` (

  `id` int(10) unsigned NOT NULL AUTO_INCREMENT,

  `k` int(10) unsigned NOT NULL DEFAULT '0',

  `c` char(120) NOT NULL DEFAULT '',

  `pad` char(60) NOT NULL DEFAULT '',

  PRIMARY KEY (`id`),

  KEY `k` (`k`)

) ENGINE=InnoDB AUTO_INCREMENT=2097121 DEFAULT CHARSET=latin1

1 row in set (0.00 sec)


root[test]> explain extended update sbtest3 set k=52, pad="xx234xh1jdkHdj234" where id=57;

+----+-------------+---------+------------+-------+---------------+---------+---------+-------+------+----------+-------------+

| id | select_type | table   | partitions | type | possible_keys | key     | key_len | ref | rows | filtered | Extra   |

+----+-------------+---------+------------+-------+---------------+---------+---------+-------+------+----------+-------------+

|  1 | UPDATE      | sbtest3 | NULL       | range | PRIMARY | PRIMARY | 4       | const | 1 | 100.00 | Using where |

+----+-------------+---------+------------+-------+---------------+---------+---------+-------+------+----------+-------------+

1 row in set, 1 warning (0.00 sec)
Primary or unique keys provides vital component for a table structure because this is very important especially when performing maintenance on a table. For example, using tools from the Percona Toolkit (such as pt-online-schema-change or pt-table-sync) recommends that you must have unique keys. Keep in mind that the PRIMARY KEY is already a unique key and a primary key cannot hold NULL values but unique key. Assigning a NULL value to a Primary Key can cause an error like,
ERROR 1171 (42000): All parts of a PRIMARY KEY must be NOT NULL; if you need NULL in a key, use UNIQUE insteadFor slave nodes, it is also common that in certain occasions, the primary/unique key is not present on the table which therefore are discrepancy of the table structure. You can use mysqldiff to achieve this or you can mysqldump --no-data … params and and run a diff to compare its table structure and check if there's any discrepancy.
Scan Tables With Duplicate Indexes, Then Dropped It
Duplicate indices can also cause performance degradation, especially when the table contains a huge number of records. MySQL has to perform multiple attempts to optimize the query and performs more query plans to check. It includes scanning large index distribution or statistics and that adds performance overhead as it can cause memory contention or high I/O memory utilization.
Degradation for queries when duplicate indices are observed on a table also attributes on saturating the buffer pool. This can also affect the performance of MySQL when the checkpointing flushes the transaction logs into the disk. This is due to the processing and storing of an unwanted index (which is in fact a waste of space in the particular tablespace of that table). Take note that duplicate indices are also stored in the tablespace which also has to be stored in the buffer pool.
Take a look at the table below which contains multiple duplicate keys:
root[test]#> show create table sbtest3\G

*************************** 1. row ***************************

       Table: sbtest3

Create Table: CREATE TABLE `sbtest3` (

  `id` int(10) unsigned NOT NULL AUTO_INCREMENT,

  `k` int(10) unsigned NOT NULL DEFAULT '0',

  `c` char(120) NOT NULL DEFAULT '',

  `pad` char(60) NOT NULL DEFAULT '',

  PRIMARY KEY (`id`),

  KEY `k` (`k`,`pad`,`c`),

  KEY `kcp2` (`id`,`k`,`c`,`pad`),

  KEY `kcp` (`k`,`c`,`pad`),

  KEY `pck` (`pad`,`c`,`id`,`k`)

) ENGINE=InnoDB AUTO_INCREMENT=2048561 DEFAULT CHARSET=latin1

1 row in set (0.00 sec)
and has a size of 2.3GiB
root[test]#> \! du -hs /var/lib/mysql/test/sbtest3.ibd

2.3G    /var/lib/mysql/test/sbtest3.ibd
Let's drop the duplicate indices and rebuild the table with a no-op alter,
root[test]#> drop index kcp2 on sbtest3; drop index kcp on sbtest3 drop index pck on sbtest3;

Query OK, 0 rows affected (0.01 sec)

Records: 0  Duplicates: 0  Warnings: 0

Query OK, 0 rows affected (0.01 sec)

Records: 0  Duplicates: 0  Warnings: 0

Query OK, 0 rows affected (0.01 sec)

Records: 0  Duplicates: 0  Warnings: 0


root[test]#> alter table sbtest3 engine=innodb;

Query OK, 0 rows affected (28.23 sec)

Records: 0  Duplicates: 0  Warnings: 0


root[test]#> \! du -hs /var/lib/mysql/test/sbtest3.ibd

945M    /var/lib/mysql/test/sbtest3.ibd
It has been able to save up to ~59% of the old size of the table space which is really huge.
To determine duplicate indexes, you can use pt-duplicate-checker to handle the job for you.
Tune Up your Buffer Pool
For this section I’m referring only to the InnoDB storage engine.
Buffer pool is an important component within the InnoDB kernel space. This is where InnoDB caches table and index data when accessed. It speeds up processing because frequently used data are being stored in the memory efficiently using BTREE. For instance, If you have multiple tables consisting of >= 100GiB and are accessed heavily, then we suggest that you delegate a fast volatile memory starting from a size of 128GiB and start assigning the buffer pool with 80% of the physical memory. The 80% has to be monitored efficiently. You can use SHOW ENGINE INNODB STATUS \G or you can leverage monitoring software such as ClusterControl which offers a fine-grained monitoring which includes buffer pool and its relevant health metrics. Also set the innodb_buffer_pool_instances variable accordingly. You might set this larger than 8 (default if innodb_buffer_pool_size >= 1GiB), such as 16, 24, 32, or 64 or higher if necessary.
When monitoring the buffer pool, you need to check global status variable Innodb_buffer_pool_pages_free which provides you thoughts if there's a need to adjust the buffer pool, or maybe consider if there are also unwanted or duplicate indexes that consumes the buffer. The SHOW ENGINE INNODB STATUS \G also offers a more detailed aspect of the buffer pool information including its individual buffer pool based on the number of innodb_buffer_pool_instances you have set.
Use FULLTEXT Indexes (But Only If Applicable)
Using queries like,
SELECT bookid, page, context FROM books WHERE context like '%for dummies%';wherein context is a string-type (char, varchar, text) column, is an example of a super bad query! Pulling large content of records with a filter that has to be greedy ends up with a full table scan, and that is just crazy. Consider using FULLTEXT index. A FULLTEXT indexes have an inverted index design. Inverted indexes store a list of words, and for each word, a list of documents that the word appears in. To support proximity search, position information for each word is also stored, as a byte offset.
In order to use FULLTEXT for searching or filtering data, you need to use the combination of MATCH() ...AGAINST syntax and not like the query above. Of course, you need to specify the field to be your FULLTEXT index field.
To create a FULLTEXT index, just specify with FULLTEXT as your index. See the example below:
root[minime]#> CREATE FULLTEXT INDEX aboutme_fts ON users_info(aboutme);

Query OK, 0 rows affected, 1 warning (0.49 sec)

Records: 0  Duplicates: 0  Warnings: 1


root[jbmrcd_date]#> show warnings;

+---------+------+--------------------------------------------------+

| Level   | Code | Message                                          |

+---------+------+--------------------------------------------------+

| Warning |  124 | InnoDB rebuilding table to add column FTS_DOC_ID |

+---------+------+--------------------------------------------------+

1 row in set (0.00 sec)
Although using FULLTEXT indexes can offer benefits when searching words within a very large context inside a column, it also creates issues when used incorrectly.
When doing a FULLTEXT search for a large table that is constantly accessed (where a number of client requests are searching for different, unique keywords) it could be very CPU intensive.
There are certain occasions as well that FULLTEXT is not applicable. See this external blog post. Although I haven't tried this with 8.0, I don't see any changes relevant to this. We suggest that do not use FULLTEXT for searching a big data environment, especially for high-traffic tables. Otherwise, try to leverage other technologies such as Apache Lucene, Apache Solr, tsearch2, or Sphinx.
Avoid Using NULL in Columns
Columns that contain null values are totally fine in MySQL. But if you are using columns with null values into an index, it can affect query performance as the optimizer cannot provide the right query plan due to poor index distribution. However, there are certain ways to optimize queries that involves null values but of course, if this suits the requirements. Please check the documentation of MySQL about Null Optimization. You may also check this external post which is helpful as well.
Design Your Schema Topology and Tables Structure Efficiently
To some extent, normalizing your database tables from 1NF (First Normal Form) to 3NF (Third Normal Form) provides you some benefit for query efficiency because normalized tables tend to avoid redundant records. A proper planning and design for your tables is very important because this is how you retrieved or pull data and in every one of these actions has a cost. With normalized tables, the goal of the database is to ensure that every non-key column in every table is directly dependent on the key; the whole key and nothing but the key. If this goal is reached, it pays of the benefits in the form of reduced redundancies, fewer anomalies and improved efficiencies.
While normalizing your tables has many benefits, it doesn't mean you need to normalize all your tables in this way. You can implement a design for your database using Star Schema. Designing your tables using Star Schema has the benefit of simpler queries (avoid complex cross joins), easy to retrieve data for reporting, offers performance gains because there's no need to use unions or complex joins, or fast aggregations. A Star Schema is simple to implement, but you need to carefully plan because it can create big problems and disadvantages when your table gets bigger and requires maintenance. Star Schema (and its underlying tables) are prone to data integrity issues, so you may have a high probability that bunch of your data is redundant. If you think this table has to be constant (structure and design) and is designed to utilize query efficiency, then it's an ideal case for this approach.
Mixing your database designs (as long as you are able to determine and identify what kind of data has to be pulled on your tables) is very important since you can benefit with more efficient queries and as well as help the DBA with backups, maintenance, and recovery.
Get Rid of Constant and Old Data
We recently wrote some Best Practices for Archiving Your Database in the Cloud. It covers about how you can take advantage of data archiving before it goes to the cloud. So how does getting rid of old data or archiving your constant and old data help query efficiency? As stated in my previous blog, there are benefits for larger tables that are constantly modified and inserted with new data, the tablespace can grow quickly. MySQL and InnoDB performs efficiently when records or data are contiguous to each other and has significance to its next row in the table. Meaning, if you have no old records that are no longer need to be used, then the optimizer does not need to include that in the statistics offering much more efficient result. Make sense, right? And also, query efficiency is not only on the application side, it has also need to consider its efficiency when performing a backup and when on maintenance or failover. For example, if you have a bad and long query that can affect your maintenance period or a failover, that can be a problem.
Enable Query Logging As Needed
Always set your MySQL's slow query log in accordance to your custom needs. If you are using Percona Server, you can take advantage of their extended slow query logging. It allows you to customarily define certain variables. You can filter types of queries in combination such as full_scan, full_join, tmp_table, etc. You can also dictate the rate of slow query logging through variable log_slow_rate_type, and many others.
The importance of enabling query logging in MySQL (such as slow query) is beneficial for inspecting your queries so that you can optimize or tune your MySQL by adjusting certain variables that suits to your requirements. To enable slow query log, ensure that these variables are setup:
- long_query_time - assign the right value for how long the queries can take. If the queries take more than 10 seconds (default), it will fall down to the slow query log file you assigned.
- slow_query_log - to enable it, set it to 1.
- slow_query_log_file - this is the destination path for your slow query log file.
The slow query log is very helpful for query analysis and diagnosing bad queries that cause stalls, slave delays, long running queries, memory or CPU intensive, or even cause the server to crash. If you use pt-query-digest or pt-index-usage, use the slow query log file as your source target for reporting these queries alike.
Conclusion
We have discussed some ways you can use to maximize database query efficiency in this blog. In this next part we'll discuss even more factors which can help you maximize performance. Stay tuned!
↧
↧
Q & A on Webinar “Introduction to MySQL Query Tuning for DevOps”

 First I want to thank everyone who attended my December 5, 2019 webinar “Introduction to MySQL Query Tuning for DevOps“. Recording and slides are available on the webinar page.
Here are answers to the questions from participants which I was not able to provide during the webinar.
Q: How to find stored execution plans and optimizer metadata stored in mysql data dictionary (i.e. PS, IS, sys schema)?
A: The Optimizer creates the query execution plan each time when MySQL Server executes the query. These plans are never stored.
However, some information, used by the optimizer, to create the execution plan, is stored and available. It includes.
- Index statistics. You can find details using the
SHOW INDEX
command:mysql> show index from employees; +-----------+------------+------------+--------------+-------------+-----------+-------------+----------+--------+------+------------+---------+---------------+ | Table | Non_unique | Key_name | Seq_in_index | Column_name | Collation | Cardinality | Sub_part | Packed | Null | Index_type | Comment | Index_comment | +-----------+------------+------------+--------------+-------------+-----------+-------------+----------+--------+------+------------+---------+---------------+ | employees | 0 | PRIMARY | 1 | emp_no | A | 299556 | NULL | NULL | | BTREE | | | | employees | 1 | first_name | 1 | first_name | A | 1196 | NULL | NULL | | BTREE | | | | employees | 1 | first_name | 2 | last_name | A | 280646 | NULL | NULL | | BTREE | | | +-----------+------------+------------+--------------+-------------+-----------+-------------+----------+--------+------+------------+---------+---------------+ 3 rows in set (0,00 sec)
Or by queryinginformation_schema.statistics
table:mysql> select * from information_schema.statistics where TABLE_SCHEMA='employees' and table_name='employees'; +---------------+--------------+------------+------------+--------------+------------+--------------+-------------+-----------+-------------+----------+--------+----------+------------+---------+---------------+ | TABLE_CATALOG | TABLE_SCHEMA | TABLE_NAME | NON_UNIQUE | INDEX_SCHEMA | INDEX_NAME | SEQ_IN_INDEX | COLUMN_NAME | COLLATION | CARDINALITY | SUB_PART | PACKED | NULLABLE | INDEX_TYPE | COMMENT | INDEX_COMMENT | +---------------+--------------+------------+------------+--------------+------------+--------------+-------------+-----------+-------------+----------+--------+----------+------------+---------+---------------+ | def | employees | employees | 0 | employees | PRIMARY | 1 | emp_no | A | 299556 | NULL | NULL | | BTREE | | | | def | employees | employees | 1 | employees | first_name | 1 | first_name | A | 1196 | NULL | NULL | | BTREE | | | | def | employees | employees | 1 | employees | first_name | 2 | last_name | A | 280646 | NULL | NULL | | BTREE | | | +---------------+--------------+------------+------------+--------------+------------+--------------+-------------+-----------+-------------+----------+--------+----------+------------+---------+---------------+ 3 rows in set (0,00 sec)
- For InnoDB tables, you can additionally query
mysql.innodb_index_stats
table which stores physical data which the engine passes to the Optimizer:mysql> select * from mysql.innodb_index_stats where database_name='employees' and table_name='employees'; +---------------+------------+------------+---------------------+--------------+------------+-------------+-----------------------------------+ | database_name | table_name | index_name | last_update | stat_name | stat_value | sample_size | stat_description | +---------------+------------+------------+---------------------+--------------+------------+-------------+-----------------------------------+ | employees | employees | PRIMARY | 2019-12-12 18:22:40 | n_diff_pfx01 | 299556 | 20 | emp_no | | employees | employees | PRIMARY | 2019-12-12 18:22:40 | n_leaf_pages | 886 | NULL | Number of leaf pages in the index | | employees | employees | PRIMARY | 2019-12-12 18:22:40 | size | 929 | NULL | Number of pages in the index | | employees | employees | first_name | 2019-12-12 21:49:02 | n_diff_pfx01 | 1196 | 20 | first_name | | employees | employees | first_name | 2019-12-12 21:49:02 | n_diff_pfx02 | 280646 | 20 | first_name,last_name | | employees | employees | first_name | 2019-12-12 21:49:02 | n_diff_pfx03 | 298471 | 20 | first_name,last_name,emp_no | | employees | employees | first_name | 2019-12-12 21:49:02 | n_leaf_pages | 460 | NULL | Number of leaf pages in the index | | employees | employees | first_name | 2019-12-12 21:49:02 | size | 545 | NULL | Number of pages in the index | +---------------+------------+------------+---------------------+--------------+------------+-------------+-----------------------------------+ 8 rows in set (0,01 sec)
Difference betweenSHOW INDEX
output andmysql.innodb_index_stats
table content is that information inSHOW INDEX
is absolutely virtual and calculated on each access while data in themysql.innodb_index_stats
table physically stored and updated only when InnoDB storage engine updates statistics. - Since version 8.0: Optimizer statistics aka Histograms. You can find details by querying
information_schema.column_statistics
table:mysql> select HISTOGRAM from information_schema.column_statistics -> where table_name=’example’\G *************************** 1. row *************************** HISTOGRAM: {"buckets": [[1, 0.6], [2, 0.8], [3, 1.0]], "data-type": "int", "null-values": 0.0, "collation-id": 8, "last-updated": "2018-11-07 09:07:19.791470", "sampling-rate": 1.0, "histogram-type": "singleton", "number-of-buckets-specified": 3} 1 row in set (0.00 sec) - Optimizer trace: which actions Optimizer performed to resolve last
optimizer_trace_limitqueries. This data stored in memory, disabled by default and available in theinformation_schema.optimizer_trace
table:mysql> set optimizer_trace=1; Query OK, 0 rows affected (0,00 sec) mysql> select count(*) from employees where first_name like 'A%'; +----------+ | count(*) | +----------+ | 22039 | +----------+ 1 row in set (0,16 sec) mysql> select * from information_schema.optimizer_trace\G *************************** 1. row *************************** QUERY: select count(*) from employees where first_name like 'A%' TRACE: { "steps": [ { "join_preparation": { "select#": 1, "steps": [ { "expanded_query": "/* select#1 */ select count(0) AS `count(*)` from `employees` where (`employees`.`first_name` like 'A%')" } ] } }, { "join_optimization": { "select#": 1, "steps": [ { ...
Q: Is it possible to list all possible plans available to optimizer for an individual query? how?
A: Since query execution plans created each time when the query is executed it is not possible to list them all.
Q: How to clear an existing plan for a particular query or all optimizer metadata from the data dictionary?
A: Since query execution plans are not stored anywhere, there is no need to clear them.
Q: Hey there, I have been working with mysql for a long time, now I want to make a system that will have complex queries with a combination of group by columns, I want them to get completed in a couple of seconds and use the lowest ram, your advise may be helpful.
A: This is a complicated question. I recommend you to learn how MySQL can use indexes for
GROUP BY. Start from “GROUP BY Optimization” chapter of the MySQL User Reference Manual.
↧
Cluster Level Consistency in InnoDB Group Replication
When you have multiple database servers working together as nodes in a cluster, it’s beneficial to understand how data consistency is established. In this post, we’re going to take a look at the various cluster consistency levels that you can choose from within InnoDB Group Replication and see how they impact data flow and failure recovery.
Let’s start with a quick refresher on what data consistency is. In a nutshell, consistency is just a way of thinking about how data is duplicated across multiple nodes in a cluster. If you write a row of data to one node, that data is not considered to be consistent within the cluster until it has been written to all of the other participating nodes. Without consistency, it’s possible to write data to one node in the cluster but not see it immediately when reading from another node in the cluster. In some cases, the aforementioned scenario, better known as eventual consistency, is acceptable but sometimes you need to ensure the data you wrote is available on all your nodes before any subsequent reads occur. For that, we need to look at the system server variables group_replication_consistency, which allows you to control consistency levels globally or per transaction.
Let’s have a look at each option and see what they mean for consistency and your workload.
Eventual
The value of ‘EVENTUAL’ implies that you are okay with having eventual consistency in your cluster. This means that as data gets written on one node, it’s possible that immediate reads on other nodes may not see that data.
This is the default value for group_replication_consistency and this is going to be the cluster consistency level that most of us are familiar with if you’ve been working with Galera or earlier versions of InnoDB Group Replication. When you get an ‘OK’ return status on your transaction, you are only getting confirmation that the write you’re performing doesn’t conflict with anything pending on the other participating nodes and that the other participating nodes have the change logged so that it can eventually be replayed. This is part of why we consider Galera to be ‘virtually synchronous’ replication.
The advantage of using this cluster consistency level is speed. You lose overhead of consistency verification as part of your transaction which allows you to commit data changes much faster.
But what if we want to introduce a bit more consistency?
Before
We may want to consider using the ‘BEFORE’ option for group_replication_consistency. When set to this value, any transaction or request will wait for the node to complete any pending transactions in its queue before allowing the request to occur. This ensures that that request is looking at the most up-to-date version of the data, which in turn assures consistency for the transaction or request.
The advantage here is obviously the fact that we get greater consistency, but the disadvantage is greater overhead and potential delays. Depending on the number of data changes pending in the node’s queue, you could notice delays in getting the results for your request.
Keep in mind there is no data checking on any of the other nodes in order to ensure consistency like you might see in a similar database shared-nothing clustering products like Cassandra. It simply checks the log and assumes that if the queue is up to date with the time the request was submitted, that data is consistent. However, the fact that it has to wait for transactions to process prior to the execution of the request will still add overhead.
If you have a write-heavy workload and want to ensure that your reads are consistent, you can consider working with this option.
After
Another option for consideration is ‘AFTER’. When set to this value, any transaction will wait to complete until the associated changes are applied to all the other participating nodes in the cluster. This takes things one step further than the basic conflict checking that occurs with eventual consistency.
The advantage, once again, is that you have greater assured cluster consistency, but it comes at the cost of performance as you’ll have to wait for all participating nodes to write the request before getting an ‘OK’. If you have a node with a large queue, this can cause further delays.
Another limitation to consider is that if you use this option, there will be an impact on other concurrently running transactions as they have to be committed in the order in which they were received. For example, if you have one transaction executing with the ‘AFTER’ option enabled, any other transaction that commits after will have to wait, even if the other transactions are using the ‘EVENTUAL’ consistency option.
If you have a read-heavy workload and want to ensure that your writes are consistent, you can consider working with this option.
Before and After
The option ‘before_and_after’ is simply a combination of the logic found in options ‘BEFORE’ and ‘AFTER’. Before any request occurs, it will make sure the node is up to date with transactions waiting in its queue. Once the transaction is complete it will verify that the write is done on all nodes prior to giving an ‘OK’.
This will offer the highest level of consistency and may sometimes be applicable when you are not operating in single-primary mode, but it obviously comes with the highest overhead cost.
If you are using multi-primary, have a read-heavy workload, and want to ensure that your writes with read dependencies are consistent, you can consider working with this option.
Before on Primary Failover
If you’ve checked the documentation for this option, you will notice that there is a fifth option, called ‘BEFORE_ON_PRIMARY_FAILOVER’. This does have an impact on cluster level consistency but mainly for when a failover occurs when running in single-primary mode.
Single primary mode in InnoDB Group Replication means that you have one node in your cluster designated as the primary. All write requests should be directed to this node, whereas read requests can be evenly distributed over the remaining nodes in the cluster. Should the single primary node fail, a promotion will need to occur and the value of ‘BEFORE_ON_PRIMARY_FAILOVER’ denotes how soon traffic should be directed to the promoted node.
If you use the option ‘EVENTUAL’, the newly promoted node will start taking write traffic immediately after the promotion is complete. If you use ‘BEFORE_ON_PRIMARY_FAILOVER’, then it will wait for all pending transactions in its queue to complete before accepting any new write traffic.
The big trade-off here is availability vs consistency. You’ll have to determine what is best for your use case.
Recommended Variable Configuration
Given that the value of this variable impacts cluster level recovery and data flow, I would be inclined to set the global value of this variable to either ‘EVENTUAL’ or ‘BEFORE_ON_PRIMARY_FAILOVER’ so you have a default configuration on how write requests are handled during a promotion. Beyond that, I would consider setting the variable to other values like ‘BEFORE’, ‘AFTER’, or ‘BEFORE_AND_AFTER’ at the session level in accordance with the consistency requirements of my specific transaction.
Conclusion
InnoDB Group Replication takes us a step forward when it comes to providing options for cluster level data consistency in MySQL-based virtually synchronous clustering solutions, but we have to be aware of the cost of overhead that comes with them. Ensure that you run adequate performance tests before increasing your cluster consistency level!
↧
The Benefits of Amazon RDS for MySQL

 As the world’s most popular open-source database, MySQL has been around the block more than a few times. Traditionally installed in on-premise data centers, recent years have shown a major trend for MySQL in the cloud, and near the top of this list is Amazon RDS.
Amazon RDS allows you to deploy scalable MySQL servers within minutes in a cost-efficient manner with easily resizable hardware capacity. This frees you up to focus on application development and leaves many of the traditional database administration tasks such as backups, patching, and monitoring in the hands of AWS.
In this post I’d like to go over six important benefits of Amazon RDS, and why a move into RDS may be the right move for you.
Easy Deployment
Amazon RDS allows you to use either the AWS Management Console or a set of APIs to create, delete, and modify your database instances. You have full control of access and security for your instances, as well as an easy process to manage your database backups and snapshots.
Amazon RDS for MySQL instances are pre-configured with parameters and settings tuned for the instance type you have chosen. Fear not, however, as you have a massive amount of control over these parameters with easy to manage database parameter groups that provide granular control and tuning options for your database instances.
Fast Storage Options
Amazon RDS provides two SSD-backed storage options for your database instances. The General Purpose storage option provides cost-effective storage for smaller or medium-sized workloads. For those applications that demand higher performance (such as heavy OLTP workloads), Provisioned IOPS Storage delivers consistent storage performance of up to 40,000 I/O’s per second.
Easily expandable as your storage requirements grow, you can provision additional storage on the fly with no downtime.
Backup & Recovery
A good DBA is only as good as their last backup. This is a saying I’ve heard ever since I started working with MySQL back in the 3.2.3 days. It was true then, and it is true now – without the data, what can even the best DBA do to restore production services?
With Amazon RDS, the automated backup features enable backup and recovery of your MySQL database instances to any point in time within your specified retention periods (up to 35 days). You can also manually initiate backups of your instances, and all of these backups will be stored by Amazon RDS until you explicitly delete them. Backups have never been so easy.
High Availability
On-premise high availability is often a challenge, as so many pieces of the puzzle need to work together in unison, and this is discounting the need for multiple data centers that are geographically separated.
Using Amazon RDS Multi-AZ deployments, you can achieve enhanced availability and durability for your MySQL database instances, making them a great fit for production database workloads. By using Amazon RDS Read Replicas, it is easy to elastically scale out beyond the capacity constraints of a single database instance for read-heavy workloads.
Monitoring/Metrics
With the available RDS monitoring features in Amazon Cloudwatch, all of the metrics for your RDS database instances are available at no additional charge. Should you want more detailed and in-depth monitoring options, CloudWatch Enhanced Monitoring provides access to over 50 CPU, memory, file system, and disk I/O metrics.
You can view key operational metrics directly within the AWS Management Console, including compute, memory, storage capacity utilization, I/O activity, instance connections, and more. Never be caught off guard again by not knowing what is happening within your database stack.
Security
As a managed service, Amazon RDS provides a high level of security for your MySQL databases. These include network isolation using Amazon VPC (virtual private cloud), encryption at rest using keys that you create and control through the AWS Key Management Service (KMS). Data can also be encrypted through the wire in transit using SSL.
This is a good point to mention the Shared Responsibility Model, as there are still components you’ll need to secure during your RDS setup.

As you can see from the AWS documentation, you are still in control of your instances, and as such will need to be sure that the settings align with your desired security best practices. While a detailed dive into the Shared Responsibility Model is beyond the scope of this article, my colleague Michael Benshoof has written a detailed overview here: The Shared Responsibility Model of Security in the Cloud.
Summary
In closing, there are many benefits to leveraging the cloud for your database infrastructure, and Amazon RDS is one of the more popular options suitable for many workloads and users. While AWS RDS does remove much of the DBA overhead with traditional on-premise installations, the customer is still responsible for managing the data itself, along with the tasks that accompany that. Analyzing workloads, performance trends, traffic management, etc., is still going to be critical even when leveraging managed cloud services. Percona can assist with your RDS deployment by picking up where AWS leaves off:
• Performance Tuning
• Capacity Planning
• Disaster Recovery
• Resource Allocation
With Percona supporting your RDS installation, you can focus your efforts on your application and business, while letting Amazon and Percona support your infrastructure. If you are researching a move into the cloud, Percona can help review your options and assist in helping you choose a solution that will be best suited for your business.
For more information, download our solution brief below which outlines setting up MySQL Amazon RDS instances to meet your company’s growing needs. Amazon RDS is suitable for production workloads and also can accommodate rapid deployment and application development due to the ease of initial setup.
↧
Build Production Grade Dedezium Cluster With Confluent Kafka
We are living in the DataLake world. Now almost every oraganization wants their reporting in Near Real Time. Kafka is of the best streaming platform for realtime reporting. Based on the Kafka connector, RedHat designed the Debezium which is an OpenSource product and high recommended for real time CDC from transnational databases. I referred many blogs to setup this cluster. But I found just basic installation steps. So I setup this cluster for AWS with Production grade and publishing this blog.
A shot intro:
Debezium is a set of distributed services to capture changes in your databases so that your applications can see those changes and respond to them. Debezium records all row-level changes within each database table in a change event stream, and applications simply read these streams to see the change events in the same order in which they occurred.
Basic Tech Terms:
- Kafka Broker: Brokers are the core for the kafka streaming, they’ll keep your messages and giving it to the consumers.
- Zookeeper: It’ll maintain the cluster status and node status. It’ll help to make the Kafka’s availability.
- Producers: The component who will send the messages(data) to the Broker.
- Consumers: The component who will get the messages from the Queue for further analytics.
- Confluent: Confluent is having their own steaming platform which basically using Apache Kafka under the hood. But it has more features.
Here Debezium is our data producer and S3sink is our consumer. For this setup, Im going to stream the MySQL data changes to S3 with customized format.
AWS Architecture:
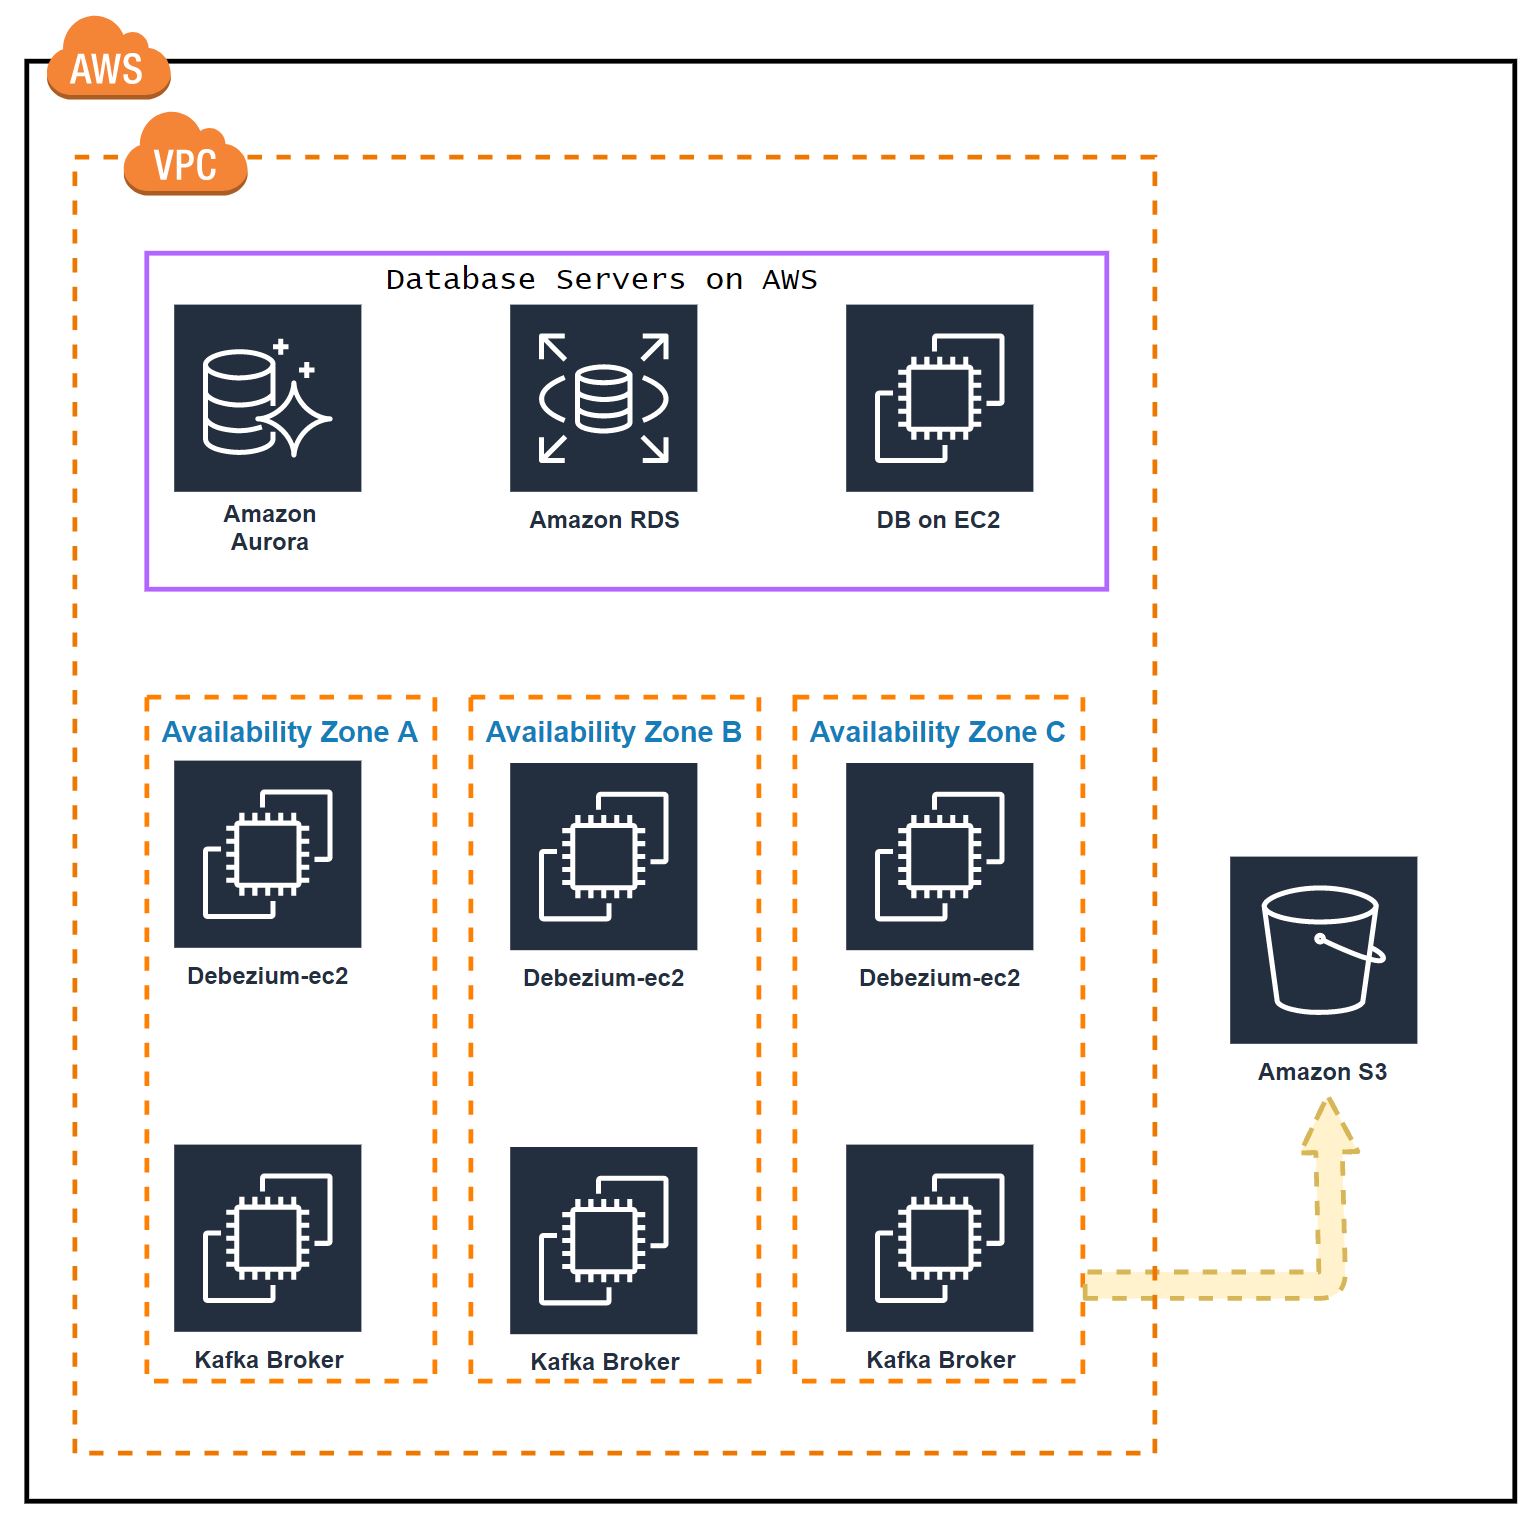
Kafka and Zookeepers are installed on the same EC2. We we’ll deploy 3 node confluent Kafka cluster. Each node will be in a different availability zone.
- 172.31.47.152 - Zone A
- 172.31.38.158 - Zone B
- 172.31.46.207 - Zone C
For Producer(debezium) and Consumer(S3sink) will be hosted on the same Ec2. We’ll 3 nodes for this.
- 172.31.47.12 - Zone A
- 172.31.38.183 - Zone B
- 172.31.46.136 - Zone C
Instance Type:
Kafka nodes are generally needs Memory and Network Optimized. You can choose either Persistent and ephemeral storage. I prefer Persistent SSD Disks for Kafka storage. So add n GB size disk to your Kafka broker nodes. For Normal work loads its better to go with R4 instance Family.
Mount the Volume in /kafkadata location.
Installation:
Install the Java and Kafka on all the Broker nodes.
 -- Install OpenJDK
 apt-get -y update
 sudo apt-get -y install default-jre

 -- Install Confluent Kafka platform
 wget -qO - https://packages.confluent.io/deb/5.3/archive.key | sudo apt-key add -
sudo add-apt-repository "deb [arch=amd64] https://packages.confluent.io/deb/5.3 stable main"
sudo apt-get update && sudo apt-get install confluent-platform-2.12
Configuration:
We need to configure Zookeeper and Kafaka properties, Edit the /etc/kafka/zookeeper.properties on all the kafka nodes
-- On Node 1
dataDir=/var/lib/zookeeper
clientPort=2181
maxClientCnxns=0
server.1=0.0.0.0:2888:3888
server.2=172.31.38.158:2888:3888
server.3=172.31.46.207:2888:3888
autopurge.snapRetainCount=3
autopurge.purgeInterval=24
initLimit=5
syncLimit=2

-- On Node 2
dataDir=/var/lib/zookeeper
clientPort=2181
maxClientCnxns=0
server.1=172.31.47.152:2888:3888
server.2=0.0.0.0:2888:3888
server.3=172.31.46.207:2888:3888
autopurge.snapRetainCount=3
autopurge.purgeInterval=24
initLimit=5
syncLimit=2

-- On Node 3
dataDir=/var/lib/zookeeper
clientPort=2181
maxClientCnxns=0
server.1=172.31.47.152:2888:3888
server.2=172.31.38.158:2888:3888
server.3=0.0.0.0:2888:3888
autopurge.snapRetainCount=3
autopurge.purgeInterval=24
initLimit=5
syncLimit=2
We need to assign a unique ID for all the Zookeeper nodes.
-- On Node 1
echo "1" > /var/lib/zookeeper/myid

--On Node 2
echo "2" > /var/lib/zookeeper/myid

--On Node 3
echo "3" > /var/lib/zookeeper/myid
Now we need to configure Kafka broker. So edit the /etc/kafka/server.properties on all the kafka nodes.
--On Node 1
broker.id.generation.enable=true
delete.topic.enable=true
listeners=PLAINTEXT://:9092
zookeeper.connect=172.31.47.152:2181,172.31.38.158:2181,172.31.46.207:2181
log.dirs=/kafkadata/kafka
log.retention.hours=168
num.partitions=1

--On Node 2
broker.id.generation.enable=true
delete.topic.enable=true
listeners=PLAINTEXT://:9092
log.dirs=/kafkadata/kafka
zookeeper.connect=172.31.47.152:2181,172.31.38.158:2181,172.31.46.207:2181
log.retention.hours=168
num.partitions=1

-- On Node 3
broker.id.generation.enable=true
delete.topic.enable=true
listeners=PLAINTEXT://:9092
log.dirs=/kafkadata/kafka
zookeeper.connect=172.31.47.152:2181,172.31.38.158:2181,172.31.46.207:2181
num.partitions=1
log.retention.hours=168
The next step is optimizing the Java JVM Heap size, In many places kafka will go down due to the less heap size. So Im allocating 50% of the Memory to Heap. But make sure more Heap size also bad. Please refer some documentation to set this value for very heavy systems.
vi /usr/bin/kafka-server-start
export KAFKA_HEAP_OPTS="-Xmx2G -Xms2G"
The another major problem in the kafka system is the open file descriptors. So we need to allow the kafka to open at least up to 100000 files.
vi /etc/pam.d/common-session
session required pam_limits.so

vi /etc/security/limits.conf

*                       soft    nofile          10000
*                       hard    nofile          100000
cp-kafka                soft    nofile          10000
cp-kafka                hard    nofile          100000
Here the cp-kafka is the default user for the kafka process.
Start the Kafka cluster:
sudo systemctl start confluent-zookeeper
sudo systemctl start confluent-kafka
sudo systemctl start confluent-schema-registry
Make sure the Kafka has to automatically starts after the Ec2 restart.
sudo systemctl enable confluent-zookeeper
sudo systemctl enable confluent-kafka
sudo systemctl enable confluent-schema-registry
Now our kafka cluster is ready. To check the list of system topics run the following command.
kafka-topics --list --zookeeper localhost:2181

__confluent.support.metrics
Setup Debezium:
Install the confluent connector and debezium MySQL connector on all the producer nodes.
 apt-get update
 sudo apt-get install default-jre

 wget -qO - https://packages.confluent.io/deb/5.3/archive.key | sudo apt-key add -
sudo add-apt-repository "deb [arch=amd64] https://packages.confluent.io/deb/5.3 stable main"
sudo apt-get update && sudo apt-get install confluent-hub-client confluent-common confluent-kafka-connect-s3 confluent-kafka-2.12
Configuration:
Edit the /etc/kafka/connect-distributed.properties on all the producer nodes to make our producer will run on a distributed manner.
-- On all the connector nodes
bootstrap.servers=172.31.47.152:9092,172.31.38.158:9092,172.31.46.207:9092
group.id=debezium-cluster
plugin.path=/usr/share/java,/usr/share/confluent-hub-components
Install Debezium MySQL Connector:
confluent-hub install debezium/debezium-connector-mysql:latest
it’ll ask for making some changes just select Y for everything.
Run the distributed connector as a service:
vi /lib/systemd/system/confluent-connect-distributed.service

[Unit]
Description=Apache Kafka - connect-distributed
Documentation=http://docs.confluent.io/
After=network.target

[Service]
Type=simple
User=cp-kafka
Group=confluent
ExecStart=/usr/bin/connect-distributed /etc/kafka/connect-distributed.properties
TimeoutStopSec=180
Restart=no

[Install]
WantedBy=multi-user.target
Start the Service:
systemctl enable confluent-connect-distributed
systemctl start confluent-connect-distributed
Configure Debezium MySQL Connector:
Create a mysql.json file which contains the MySQL information and other formatting options.
{
	"name": "mysql-connector-db01",
	"config": {
		"name": "mysql-connector-db01",
		"connector.class": "io.debezium.connector.mysql.MySqlConnector",
		"database.server.id": "1",
		"tasks.max": "3",
		"database.history.kafka.bootstrap.servers": "172.31.47.152:9092,172.31.38.158:9092,172.31.46.207:9092",
		"database.history.kafka.topic": "schema-changes.mysql",
		"database.server.name": "mysql-db01",
		"database.hostname": "172.31.84.129",
		"database.port": "3306",
		"database.user": "bhuvi",
		"database.password": "my_stong_password",
		"database.whitelist": "proddb,test",
		"internal.key.converter.schemas.enable": "false",
		"key.converter.schemas.enable": "false",
		"internal.key.converter": "org.apache.kafka.connect.json.JsonConverter",
		"internal.value.converter.schemas.enable": "false",
		"value.converter.schemas.enable": "false",
		"internal.value.converter": "org.apache.kafka.connect.json.JsonConverter",
		"value.converter": "org.apache.kafka.connect.json.JsonConverter",
		"key.converter": "org.apache.kafka.connect.json.JsonConverter",
		"transforms": "unwrap",
		"transforms.unwrap.type": "io.debezium.transforms.ExtractNewRecordState"
        "transforms.unwrap.add.source.fields": "ts_ms",
	}
}
- “database.history.kafka.bootstrap.servers” - Kafka Servers IP.
- “database.whitelist” - List of databases to get the CDC.
- key.converter and value.converter and transforms parameters - By default Debezium output will have more detailed information. But I don’t want all of those information. Im only interested in to get the new row and the timestamp when its inserted.
If you don’t want to customize anythings then just remove everything after the database.whitelist
Register the MySQL Connector:
curl -X POST -H "Accept: application/json" -H "Content-Type: application/json" http://localhost:8083/connectors -d @mysql.json
Check the status:
curl GET localhost:8083/connectors/mysql-connector-db01/status
{
  "name": "mysql-connector-db01",
  "connector": {
    "state": "RUNNING",
    "worker_id": "172.31.94.191:8083"
  },
  "tasks": [
    {
      "id": 0,
      "state": "RUNNING",
      "worker_id": "172.31.94.191:8083"
    }
  ],
  "type": "source"
}
Test the MySQL Consumer:
Now insert something into any tables in proddb or test (because we have whilelisted only these databaes to capture the CDC.
use test;
create table rohi (id int),
fn varchar(10),
ln varchar(10),
phone int );

insert into rohi values (2, 'rohit', 'ayare','87611');
We can get these values from the Kafker brokers. Open any one the kafka node and run the below command.
I prefer confluent cli for this. By default it’ll not be available, so download manually.
curl -L https://cnfl.io/cli | sh -s -- -b /usr/bin/
Listen the below topic:
mysql-db01.test.rohi
This is the combination ofservername.databasename.tablename
servername(you mentioned this in as a server name in mysql json file).
 confluent local consume mysql-db01.test.rohi

----
The local commands are intended for a single-node development environment
only, NOT for production usage. https://docs.confluent.io/current/cli/index.html
-----

{"id":1,"fn":"rohit","ln":"ayare","phone":87611,"__ts_ms":1576757407000}
Setup S3 Sink connector in All Producer Nodes:
I want to send this data to S3 bucket. So you must have an EC2 IAM role which has access to the target S3 bucket. Or install awscli and configure access and secret key(but its not recommended)
Create s3.json file.
{
	"name": "s3-sink-db01",
	"config": {
		"connector.class": "io.confluent.connect.s3.S3SinkConnector",
		"storage.class": "io.confluent.connect.s3.storage.S3Storage",
		"s3.bucket.name": "bhuvi-datalake",
		"name": "s3-sink-db01",
		"tasks.max": "3",
		"s3.region": "us-east-1",
		"s3.part.size": "5242880",
		"s3.compression.type": "gzip",
		"timezone": "UTC",
		"locale": "en",
		"flush.size": "10000",
		"rotate.interval.ms": "3600000",
		"topics.regex": "mysql-db01.(.*)",
		"internal.key.converter.schemas.enable": "false",
		"key.converter.schemas.enable": "false",
		"internal.key.converter": "org.apache.kafka.connect.json.JsonConverter",
		"format.class": "io.confluent.connect.s3.format.json.JsonFormat",
		"internal.value.converter.schemas.enable": "false",
		"value.converter.schemas.enable": "false",
		"internal.value.converter": "org.apache.kafka.connect.json.JsonConverter",
		"value.converter": "org.apache.kafka.connect.json.JsonConverter",
		"key.converter": "org.apache.kafka.connect.json.JsonConverter",
		"partitioner.class": "io.confluent.connect.storage.partitioner.HourlyPartitioner",
		"path.format": "YYYY/MM/dd/HH",
		"partition.duration.ms": "3600000",
		"rotate.schedule.interval.ms": "3600000"
	}
}
-
"topics.regex": "mysql-db01"- It’ll send the data only from the topics which hasmysql-db01as prefix. In our case all the MySQL databases related topics will start with this prefix. -
"flush.size"- The data will uploaded to S3 only after these many number of records stored. Or after"rotate.schedule.interval.ms"this duration.
Register this S3 sink connector:
curl -X POST -H "Accept: application/json" -H "Content-Type: application/json" http://localhost:8083/connectors -d @s3
Check the Status:
curl GET localhost:8083/connectors/s3-sink-db01/status
{
  "name": "s3-sink-db01",
  "connector": {
    "state": "RUNNING",
    "worker_id": "172.31.94.191:8083"
  },
  "tasks": [
    {
      "id": 0,
      "state": "RUNNING",
      "worker_id": "172.31.94.191:8083"
    },
    {
      "id": 1,
      "state": "RUNNING",
      "worker_id": "172.31.94.191:8083"
    },
    {
      "id": 2,
      "state": "RUNNING",
      "worker_id": "172.31.94.191:8083"
    }
  ],
  "type": "sink"
}
Test the S3 sync:
Insert the 10000 rows into the rohi table. Then check the S3 bucket. It’ll save the data in JSON format with GZIP compression. Also in a HOUR wise partitions.
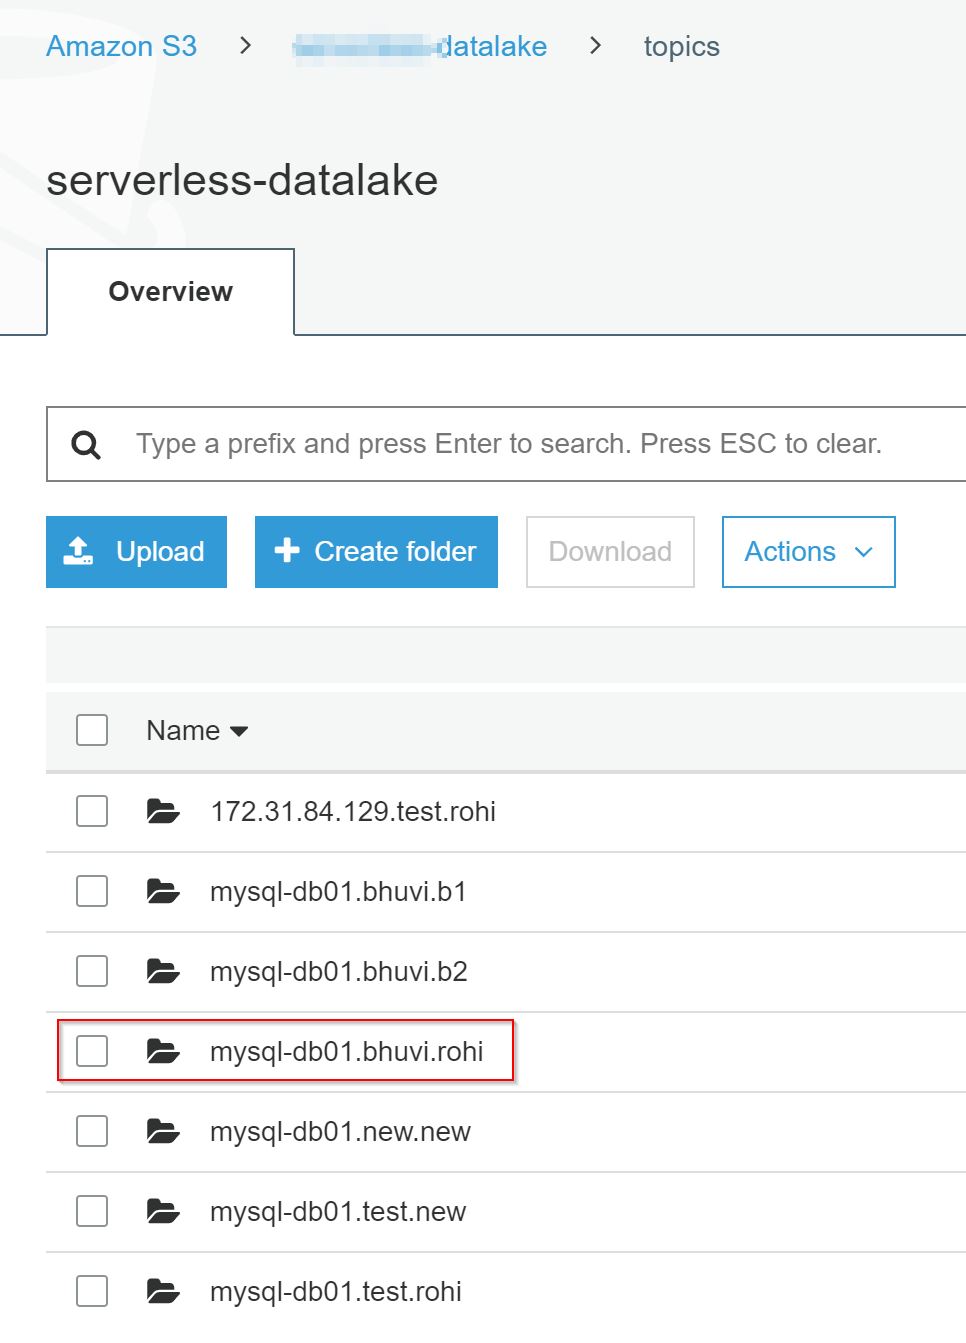
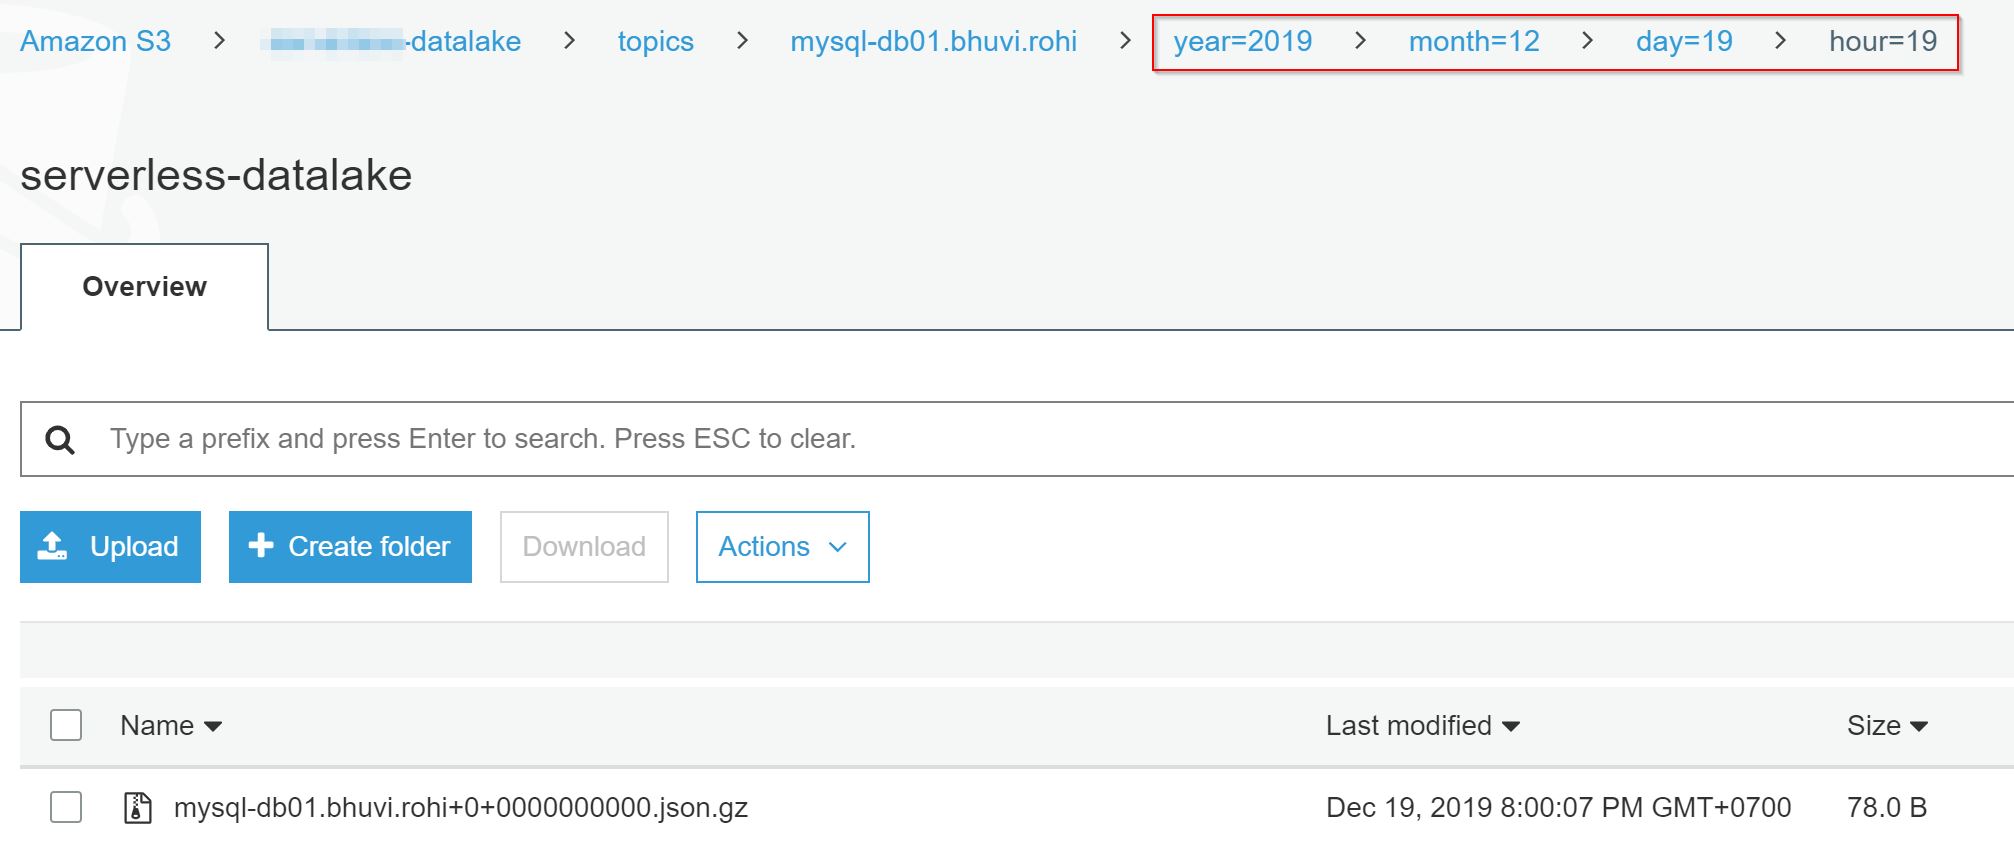
More Tuning:
- Replication Factor is the other main parameter to the data durability.
- Use internal IP addresses as much as you can.
- By default debezium uses 1 Partition per topic. You can configure this based on your work load. But more partitions more through put needed.
References:
↧
↧
Build Production Grade Debezium Cluster With Confluent Kafka
We are living in the DataLake world. Now almost every oraganization wants their reporting in Near Real Time. Kafka is of the best streaming platform for realtime reporting. Based on the Kafka connector, RedHat designed the Debezium which is an OpenSource product and high recommended for real time CDC from transnational databases. I referred many blogs to setup this cluster. But I found just basic installation steps. So I setup this cluster for AWS with Production grade and publishing this blog.
A shot intro:
Debezium is a set of distributed services to capture changes in your databases so that your applications can see those changes and respond to them. Debezium records all row-level changes within each database table in a change event stream, and applications simply read these streams to see the change events in the same order in which they occurred.
Basic Tech Terms:
- Kafka Broker: Brokers are the core for the kafka streaming, they’ll keep your messages and giving it to the consumers.
- Zookeeper: It’ll maintain the cluster status and node status. It’ll help to make the Kafka’s availability.
- Producers: The component who will send the messages(data) to the Broker.
- Consumers: The component who will get the messages from the Queue for further analytics.
- Confluent: Confluent is having their own steaming platform which basically using Apache Kafka under the hood. But it has more features.
Here Debezium is our data producer and S3sink is our consumer. For this setup, Im going to stream the MySQL data changes to S3 with customized format.
AWS Architecture:
Kafka and Zookeepers are installed on the same EC2. We we’ll deploy 3 node confluent Kafka cluster. Each node will be in a different availability zone.
- 172.31.47.152 - Zone A
- 172.31.38.158 - Zone B
- 172.31.46.207 - Zone C
For Producer(debezium) and Consumer(S3sink) will be hosted on the same Ec2. We’ll 3 nodes for this.
- 172.31.47.12 - Zone A
- 172.31.38.183 - Zone B
- 172.31.46.136 - Zone C
Instance Type:
Kafka nodes are generally needs Memory and Network Optimized. You can choose either Persistent and ephemeral storage. I prefer Persistent SSD Disks for Kafka storage. So add n GB size disk to your Kafka broker nodes. For Normal work loads its better to go with R4 instance Family.
Mount the Volume in /kafkadata location.
Installation:
Install the Java and Kafka on all the Broker nodes.
-- Install OpenJDK
apt-get -y update
sudo apt-get -y install default-jre

-- Install Confluent Kafka platform
wget -qO - https://packages.confluent.io/deb/5.3/archive.key | sudo apt-key add -
sudo add-apt-repository "deb [arch=amd64] https://packages.confluent.io/deb/5.3 stable main"
sudo apt-get update && sudo apt-get install confluent-platform-2.12
Configuration:
We need to configure Zookeeper and Kafaka properties, Edit the /etc/kafka/zookeeper.properties on all the kafka nodes
-- On Node 1
dataDir=/var/lib/zookeeper
clientPort=2181
maxClientCnxns=0
server.1=0.0.0.0:2888:3888
server.2=172.31.38.158:2888:3888
server.3=172.31.46.207:2888:3888
autopurge.snapRetainCount=3
autopurge.purgeInterval=24
initLimit=5
syncLimit=2

-- On Node 2
dataDir=/var/lib/zookeeper
clientPort=2181
maxClientCnxns=0
server.1=172.31.47.152:2888:3888
server.2=0.0.0.0:2888:3888
server.3=172.31.46.207:2888:3888
autopurge.snapRetainCount=3
autopurge.purgeInterval=24
initLimit=5
syncLimit=2

-- On Node 3
dataDir=/var/lib/zookeeper
clientPort=2181
maxClientCnxns=0
server.1=172.31.47.152:2888:3888
server.2=172.31.38.158:2888:3888
server.3=0.0.0.0:2888:3888
autopurge.snapRetainCount=3
autopurge.purgeInterval=24
initLimit=5
syncLimit=2
We need to assign a unique ID for all the Zookeeper nodes.
 -- On Node 1
 echo "1" > /var/lib/zookeeper/myid

 --On Node 2
 echo "2" > /var/lib/zookeeper/myid

 --On Node 3
 echo "3" > /var/lib/zookeeper/myid
Now we need to configure Kafka broker. So edit the /etc/kafka/server.properties on all the kafka nodes.
--On Node 1
broker.id.generation.enable=true
delete.topic.enable=true
listeners=PLAINTEXT://:9092
zookeeper.connect=172.31.47.152:2181,172.31.38.158:2181,172.31.46.207:2181
log.dirs=/kafkadata/kafka
log.retention.hours=168
num.partitions=1

--On Node 2
broker.id.generation.enable=true
delete.topic.enable=true
listeners=PLAINTEXT://:9092
log.dirs=/kafkadata/kafka
zookeeper.connect=172.31.47.152:2181,172.31.38.158:2181,172.31.46.207:2181
log.retention.hours=168
num.partitions=1

-- On Node 3
broker.id.generation.enable=true
delete.topic.enable=true
listeners=PLAINTEXT://:9092
log.dirs=/kafkadata/kafka
zookeeper.connect=172.31.47.152:2181,172.31.38.158:2181,172.31.46.207:2181
num.partitions=1
log.retention.hours=168
The next step is optimizing the Java JVM Heap size, In many places kafka will go down due to the less heap size. So Im allocating 50% of the Memory to Heap. But make sure more Heap size also bad. Please refer some documentation to set this value for very heavy systems.
vi /usr/bin/kafka-server-start
export KAFKA_HEAP_OPTS="-Xmx2G -Xms2G"
The another major problem in the kafka system is the open file descriptors. So we need to allow the kafka to open at least up to 100000 files.
vi /etc/pam.d/common-session
session required pam_limits.so

vi /etc/security/limits.conf

*                       soft    nofile          10000
*                       hard    nofile          100000
cp-kafka                soft    nofile          10000
cp-kafka                hard    nofile          100000
Here the cp-kafka is the default user for the kafka process.
Create Kafka data dir:
mkdir -p /kafkadata/kafka
chown -R cp-kafka:confluent /kafkadata/kafka
chmode 710 /kafkadata/kafka
Start the Kafka cluster:
sudo systemctl start confluent-zookeeper
sudo systemctl start confluent-kafka
sudo systemctl start confluent-schema-registry
Make sure the Kafka has to automatically starts after the Ec2 restart.
sudo systemctl enable confluent-zookeeper
sudo systemctl enable confluent-kafka
sudo systemctl enable confluent-schema-registry
Now our kafka cluster is ready. To check the list of system topics run the following command.
kafka-topics --list --zookeeper localhost:2181

__confluent.support.metrics
Setup Debezium:
Install the confluent connector and debezium MySQL connector on all the producer nodes.
apt-get update
sudo apt-get install default-jre

wget -qO - https://packages.confluent.io/deb/5.3/archive.key | sudo apt-key add -
sudo add-apt-repository "deb [arch=amd64] https://packages.confluent.io/deb/5.3 stable main"
sudo apt-get update && sudo apt-get install confluent-hub-client confluent-common confluent-kafka-connect-s3 confluent-kafka-2.12
Configuration:
Edit the /etc/kafka/connect-distributed.properties on all the producer nodes to make our producer will run on a distributed manner.
-- On all the connector nodes
bootstrap.servers=172.31.47.152:9092,172.31.38.158:9092,172.31.46.207:9092
group.id=debezium-cluster
plugin.path=/usr/share/java,/usr/share/confluent-hub-components
Install Debezium MySQL Connector:
confluent-hub install debezium/debezium-connector-mysql:latestit’ll ask for making some changes just select Y for everything.
Run the distributed connector as a service:
vi /lib/systemd/system/confluent-connect-distributed.service

[Unit]
Description=Apache Kafka - connect-distributed
Documentation=http://docs.confluent.io/
After=network.target

[Service]
Type=simple
User=cp-kafka
Group=confluent
ExecStart=/usr/bin/connect-distributed /etc/kafka/connect-distributed.properties
TimeoutStopSec=180
Restart=no

[Install]
WantedBy=multi-user.target
Start the Service:
systemctl enable confluent-connect-distributed
systemctl start confluent-connect-distributed
Configure Debezium MySQL Connector:
Create a mysql.json file which contains the MySQL information and other formatting options.
{
	"name": "mysql-connector-db01",
	"config": {
		"name": "mysql-connector-db01",
		"connector.class": "io.debezium.connector.mysql.MySqlConnector",
		"database.server.id": "1",
		"tasks.max": "3",
		"database.history.kafka.bootstrap.servers": "172.31.47.152:9092,172.31.38.158:9092,172.31.46.207:9092",
		"database.history.kafka.topic": "schema-changes.mysql",
		"database.server.name": "mysql-db01",
		"database.hostname": "172.31.84.129",
		"database.port": "3306",
		"database.user": "bhuvi",
		"database.password": "my_stong_password",
		"database.whitelist": "proddb,test",
		"internal.key.converter.schemas.enable": "false",
		"key.converter.schemas.enable": "false",
		"internal.key.converter": "org.apache.kafka.connect.json.JsonConverter",
		"internal.value.converter.schemas.enable": "false",
		"value.converter.schemas.enable": "false",
		"internal.value.converter": "org.apache.kafka.connect.json.JsonConverter",
		"value.converter": "org.apache.kafka.connect.json.JsonConverter",
		"key.converter": "org.apache.kafka.connect.json.JsonConverter",
		"transforms": "unwrap",
		"transforms.unwrap.type": "io.debezium.transforms.ExtractNewRecordState"
        "transforms.unwrap.add.source.fields": "ts_ms",
	}
}- “database.history.kafka.bootstrap.servers” - Kafka Servers IP.
- “database.whitelist” - List of databases to get the CDC.
- key.converter and value.converter and transforms parameters - By default Debezium output will have more detailed information. But I don’t want all of those information. Im only interested in to get the new row and the timestamp when its inserted.
If you don’t want to customize anythings then just remove everything after the database.whitelist
Register the MySQL Connector:
curl -X POST -H "Accept: application/json" -H "Content-Type: application/json" http://localhost:8083/connectors -d @mysql.jsonCheck the status:
curl GET localhost:8083/connectors/mysql-connector-db01/status
{
  "name": "mysql-connector-db01",
  "connector": {
    "state": "RUNNING",
    "worker_id": "172.31.94.191:8083"
  },
  "tasks": [
    {
      "id": 0,
      "state": "RUNNING",
      "worker_id": "172.31.94.191:8083"
    }
  ],
  "type": "source"
}
Test the MySQL Consumer:
Now insert something into any tables in proddb or test (because we have whilelisted only these databaes to capture the CDC.
use test;
create table rohi (id int),
fn varchar(10),
ln varchar(10),
phone int );

insert into rohi values (2, 'rohit', 'ayare','87611');
We can get these values from the Kafker brokers. Open any one the kafka node and run the below command.
I prefer confluent cli for this. By default it’ll not be available, so download manually.
curl -L https://cnfl.io/cli | sh -s -- -b /usr/bin/Listen the below topic:
mysql-db01.test.rohi
This is the combination ofservername.databasename.tablename
servername(you mentioned this in as a server name in mysql json file).
confluent local consume mysql-db01.test.rohi

----
The local commands are intended for a single-node development environment
only, NOT for production usage. https://docs.confluent.io/current/cli/index.html
-----

{"id":1,"fn":"rohit","ln":"ayare","phone":87611,"__ts_ms":1576757407000}
Setup S3 Sink connector in All Producer Nodes:
I want to send this data to S3 bucket. So you must have an EC2 IAM role which has access to the target S3 bucket. Or install awscli and configure access and secret key(but its not recommended)
Create s3.json file.
{
	"name": "s3-sink-db01",
	"config": {
		"connector.class": "io.confluent.connect.s3.S3SinkConnector",
		"storage.class": "io.confluent.connect.s3.storage.S3Storage",
		"s3.bucket.name": "bhuvi-datalake",
		"name": "s3-sink-db01",
		"tasks.max": "3",
		"s3.region": "us-east-1",
		"s3.part.size": "5242880",
		"s3.compression.type": "gzip",
		"timezone": "UTC",
		"locale": "en",
		"flush.size": "10000",
		"rotate.interval.ms": "3600000",
		"topics.regex": "mysql-db01.(.*)",
		"internal.key.converter.schemas.enable": "false",
		"key.converter.schemas.enable": "false",
		"internal.key.converter": "org.apache.kafka.connect.json.JsonConverter",
		"format.class": "io.confluent.connect.s3.format.json.JsonFormat",
		"internal.value.converter.schemas.enable": "false",
		"value.converter.schemas.enable": "false",
		"internal.value.converter": "org.apache.kafka.connect.json.JsonConverter",
		"value.converter": "org.apache.kafka.connect.json.JsonConverter",
		"key.converter": "org.apache.kafka.connect.json.JsonConverter",
		"partitioner.class": "io.confluent.connect.storage.partitioner.HourlyPartitioner",
		"path.format": "YYYY/MM/dd/HH",
		"partition.duration.ms": "3600000",
		"rotate.schedule.interval.ms": "3600000"
	}
}-
"topics.regex": "mysql-db01"- It’ll send the data only from the topics which hasmysql-db01as prefix. In our case all the MySQL databases related topics will start with this prefix. -
"flush.size"- The data will uploaded to S3 only after these many number of records stored. Or after"rotate.schedule.interval.ms"this duration.
Register this S3 sink connector:
curl -X POST -H "Accept: application/json" -H "Content-Type: application/json" http://localhost:8083/connectors -d @s3Check the Status:
curl GET localhost:8083/connectors/s3-sink-db01/status
{
  "name": "s3-sink-db01",
  "connector": {
    "state": "RUNNING",
    "worker_id": "172.31.94.191:8083"
  },
  "tasks": [
    {
      "id": 0,
      "state": "RUNNING",
      "worker_id": "172.31.94.191:8083"
    },
    {
      "id": 1,
      "state": "RUNNING",
      "worker_id": "172.31.94.191:8083"
    },
    {
      "id": 2,
      "state": "RUNNING",
      "worker_id": "172.31.94.191:8083"
    }
  ],
  "type": "sink"
}
Test the S3 sync:
Insert the 10000 rows into the rohi table. Then check the S3 bucket. It’ll save the data in JSON format with GZIP compression. Also in a HOUR wise partitions.
More Tuning:
- Replication Factor is the other main parameter to the data durability.
- Use internal IP addresses as much as you can.
- By default debezium uses 1 Partition per topic. You can configure this based on your work load. But more partitions more through put needed.
References:
↧
Grafana Plugins and Percona Monitoring and Management

Percona Monitoring and Management (PMM) is built upon the shoulder of giants like Prometheus and Grafana. And speaking of Grafana, one of the coolest features that come with it is the ability to customize the experience through 3rd party plugins.
Plugins are an easy way to enhance the ability to have specialized graphs. One case that we saw in Managed Services is the ability to have a throughput graph, that shows QPS vs Threads running. This is different in essence of the “default” graphs that show a metric against time (time being the X-axis) since what we wanted is to show queries per second not during a time (that graph already exists) but for specific values of threads.
One way to achieve that is by using a plugin called Plotly that render metrics using the plot.ly javascript framework, but specifically will let us make the graph we need. Let’s get hands-on!
Installing Grafana plugins
Performing this task is pretty straightforward thanks to the grafana-cli command, that comes available inside any PMM installation. The only thing needed is the name of the desired plugin, and knowing the command syntax which is:
grafana-cli plugins install <plugin-name>
My case is a PMM through docker, so the full command and response is as follow
[root@app ~]# docker exec -t pmm-server bash -c "/usr/bin/grafana-cli plugins install natel-plotly-panel"
installing natel-plotly-panel @ 0.0.6
from url: https://grafana.com/api/plugins/natel-plotly-panel/versions/0.0.6/download
into: /var/lib/grafana/plugins

� Installed natel-plotly-panel successfully

Restart grafana after installing plugins . <service grafana-server restart>

[root@app ~]#
All right, the final step before the plugin is fully ready to be used is to restart the “grafana-server” service. In our case, restarting the docker container will make the trick, the command is:
docker restart pmm-server
And after the container is back, the plugin is available:

Now, the next step was to actually create the graph. Like I mentioned above, the need for the plugin was to have a “live” graph of the database throughput, measured as questions per second, per each thread, just like the graphs that one can find on any benchmark article out there, where the idea is to show the units of work on different concurrency scenarios.
The metrics that we need are already being collected by PMM: mysql_global_status_threads_running (the “Threads running”) and mysql_global_stauts_questions (the “QPS”). Those are added on the regular “metrics” tab:

Then, we need the actual “Traces” for Plotly. Those are based on the metrics. We just need to assign the axis:

And then we have the desired graph. What is showing is the QPS per threads during the selected time range. That’s the reason why there are several points instead of one, like on regular benchmark graphs, because is not an accumulated value.

In this case, the graph shows that MySQL is mostly low concurrency traffic, with the majority of the threads around the value of 4, and some peaks at 6 threads, and QPS also low, having the peak at around 300 QPS.
Does it Work with PMM2?
You bet it does! Following the already described steps:
[root@app ~]# docker ps
CONTAINER ID        IMAGE                  COMMAND                CREATED             STATUS              PORTS                                      NAMES
22bb13b5d6f9        percona/pmm-server:2   "/opt/entrypoint.sh"   3 hours ago         Up About an hour    0.0.0.0:80->80/tcp, 0.0.0.0:443->443/tcp   pmm-server
[root@app ~]# docker exec -t pmm-server bash -c "/usr/bin/grafana-cli plugins install natel-plotly-panel"
installing natel-plotly-panel @ 0.0.6
from: https://grafana.com/api/plugins/natel-plotly-panel/versions/0.0.6/download
into: /var/lib/grafana/plugins

� Installed natel-plotly-panel successfully

Restart grafana after installing plugins .

[root@app ~]# docker restart pmm-server
pmm-server
The plugin is available and we can make the same graph

In Conclusion
Enhancing the PMM experience through the Grafana plugins is a relatively easy task, in operational terms.
It is worth mentioning that the plugin and the dashboard will survive in-place upgrades of PMM. In-place means using the default PMM upgrade option available in the home dashboard:

This is key: Compatibility between plugins and Grafana versions is on you, Mr. User, and you only. If the PMM team updates Grafana to an incompatible version for any plugin you are using, it is on you only.
↧
MySQL Encryption: Master Key Encryption in InnoDB

In the previous blog post of this series, MySQL Encryption: Talking About Keyrings, I described how keyrings work. In this post, I will talk about how master key encryption works and what the pros and cons are of using envelope encryption such as a master key.
The idea behind envelope encryption is that you use one key to encrypt multiple other keys. In InnoDB, this “one key” is the master encryption key and the “multiple other keys” are the tablespace keys. Those tablespace keys are the ones that are actually used to encrypt tablespaces. Graphically it can be presented like this:

The master key resides in the keyring, while encrypted tablespace keys reside in tablespace headers (written on page 0 of a tablespace). In the picture above:
Table A is encrypted with key 1. Key 1 is encrypted with the master key and stored (encrypted) in Table A’s header.
Table B is encrypted with key 2. Key 2 is encrypted with the master key and stored (encrypted) in Table B’s header.
And so on. When a server wants to decrypt Table A, it fetches the master key from the keyring, reads the encrypted key 1 from Table A’s header, and decrypts the key 1. The decrypted key 1 is cached in server memory and used to decrypt Table A.
InnoDB
In InnoDB, the actual encryption/decryption is done in the I/O layer of the server. So just before a page is flushed to disk it gets encrypted, and also, just after an encrypted page is read from a disk, it gets decrypted.
Encryption in InnoDB works only on the tablespace level. Normally when you create a standalone table you create a file-per-table tablespace (ON by default). So what you actually are creating is a tablespace that can contain only one table. You can also create a table that belongs to a general tablespace. Either way, your table always resides inside some tablespace. Since encryption works on tablespace level, a tablespace can be either fully encrypted or fully un-encrypted. So you cannot have some tables inside general tablespace encrypted, and some not.
If for some reason you have file-per-table disabled, then all the standalone tables are actually created inside system tablespace. In Percona Server for MySQL, you can encrypt system tablespace by specifying (variable innodb_sys_tablespace_encrypt) during bootstrap or using encryption threads (still an experimental feature). In MySQL, you cannot ;).
Before we go any further we need to understand how the master key ID is built. It consists of UUID, KEY_ID, and prefix INNODBKey. It looks like this: INNODBKey-UUID-KEY_ID.
UUID is the server’s uuid in which tablespace was encrypted. KEY_ID is just an ever-increasing value. When the first master key is created this KEY_ID is equal to 1. Then when you rotate the master key, a new master key is created with KEY_ID = 2 and so on. We will discuss master key rotation in-depth later in the next blog posts of this series.
Now that we know what master key ID looks like, we can have a look at an encryption header. When a tablespace is first encrypted, the encryption header is added to the tablespace header. It looks like this:

KEY ID is the KEY_ID from the master key ID that we have already discussed. UUID is the server uuid, later used in master key ID. The tablespace key consists of 256 randomly generated (by the server) bits. Tablespace IV also consists of 256 randomly generated keys (although it should be 128 bits). IV is used to initialize AES encryption and decryption (only 128 bits of those 256 bits are used). Last we have CRC32 checksum of tablespace key and IV.
All this time I was saying that we have an encrypted tablespace key in the header. I was oversimplifying this a bit. Actually, we store tablespace key and IV bundled together, and we encrypt them both using the master key. Remember, before we encrypt tablespace key and IV we first calculate CRC32 of both.
Why Do We Need CRC32?
Well, to make sure that we are using the correct master key to decrypt the tablespace key and IV. After we decrypt the tablespace key and IV, we calculate checksum and we compare it with the CRC32 stored in the header. In case they match, we know we have used the correct master key and we have a valid tablespace key and tablespace iv to decrypt the table. In case they do not match, we mark the tablespace as missing (we would not be able to decrypt it anyways).
You may ask – when do we check if we have correct master keys to decrypt all the tables? The answer is: at the server startup. At the startup, each encrypted table/tablespace server reads the UUID, KEY_ID from the header to construct the master key ID. Next, it fetches the needed master key from Keyring, decrypts tablespace key and iv, and checks the checksum. Again, if checksum matches we are all good, if not, the tablespace is marked as missing.
If you are following this encryption series of blog posts, you might remember that in MySQL Encryption: Talking About Keyrings I said that server-based keyrings only fetch a list of key ids (to be precise, key id and user id, as this pair uniquely identifies the key in the keyring) on server startup. Now I am saying that the server fetches all the keys it needs on the startup to validate that it can decrypt tablespace keys. So why does a server-based keyring fetch only key_id and user_id when initialized instead of fetching all the keys? Because not all the keys might be needed; this is mostly due to master key rotation. Master key rotation will generate a new master key in keyring but it will never delete old versions of the master key. So you might end up with many keys in Key Server (Vault server – if you are using keyring_vault) that are not needed by the server and thus not fetched on server startup.
It is time we talk a bit about the pros and cons of master key encryption. The biggest advantage is that you only need one encryption key (master key) to be stored separately from your encrypted data. This makes the server startup fast and keyring small, thus easier to manage. Also, the master key can be rotated with one command.
However, master key encryption has one big disadvantage; once a tablespace is encrypted with tablespace_key it will always stay encrypted with the same key. Master key rotation will not help here. Why is this a disadvantage? We know that MySQL has bugs that can make it suddenly crash, producing a core file. Since the core file contains a memory dump of our server, it can so happen that this core dump will contain a decrypted tablespace key. What is worse, the decrypted tablespace keys are stored in memory that can be swapped to disk. You can say that it is not a disadvantage because you need to have root access to access those core files/swap partition. This is true – but you only need root access for some time. Once someone gets access to decrypted tablespace key, s/he can keep using it to decrypt the data, even if the root access is no longer possible for that person. Also, the disk can be stolen and swap partition/core files can be read with different means, and the purpose of TDE is to make it unreadable even if the disk gets stolen. Percona Server for MySQL offers a feature that makes actual re-encryption of a tablespace – with newly generated keys – possible. This feature is called encryption threads and is still experimental at the time I am writing this blog post.
Stay tuned for more information on transparent data encryption in the next blog posts of this series.
↧