Quantcast
Channel: Planet MySQL
Viewing all 18786 articles
Browse latest View live

Q & A on Webinar “Top 3 Features of MySQL”

$
0
0

First I want to thank everyone who attended my December 19, 2019 webinar “Top 3 Features of MySQL“. Recording and slides are available on the webinar page.

Here are answers to the questions from participants which I was not able to provide during the webinar.

Q: When do undo logs and redo logs come into play? Can you please explain the background operations of these logs?

A: These two are completely different structures.

Undo Logs

Belong to a single active transaction. It contains information on how to undo the latest change to the clustered index, performed by this transaction.

Let’s demonstrate how they work with an example.

Consider this table:

mysql> create table t1(id int not null auto_increment primary key, f1 varchar(100)) engine=innodb;
Query OK, 0 rows affected (0.02 sec)

mysql> insert into t1(f1) values('foo'), ('barr'), ('baz');
Query OK, 3 rows affected (0.03 sec)
Records: 3  Duplicates: 0  Warnings: 0

Now let’s open a transaction and retrieve rows from this table:

mysql> \R tr1> 
PROMPT set to 'tr1> '
tr1> begin;
Query OK, 0 rows affected (0.00 sec)

tr1> select * from t1;
+----+------+
| id | f1   |
+----+------+
|  1 | foo  |
|  2 | barr |
|  3 | baz  |
+----+------+
3 rows in set (0.00 sec)

In another session let’s open new transaction and modify row where

f1='barr'
  to
f1='bar'
:
tr2> begin;
Query OK, 0 rows affected (0.00 sec)

tr2> update t1 set f1='bar' where f1='barr';
Query OK, 1 row affected (0.00 sec)
Rows matched: 1  Changed: 1  Warnings: 0

tr2> commit;
Query OK, 0 rows affected (0.01 sec

tr2> select * from t1;
+----+------+
| id | f1   |
+----+------+
|  1 | foo  |
|  2 | bar  |
|  3 | baz  |
+----+------+
3 rows in set (0.01 sec)

We are using default transaction isolation level

REPEATABLE-READ
. Therefore the first transaction should receive the same result as it had seen before the change and it does:
tr1> select * from t1;
+----+------+
| id | f1   |
+----+------+
|  1 | foo  |
|  2 | barr |
|  3 | baz  |
+----+------+
3 rows in set (0.00 sec)

The transaction retrieves the data from the undo logs because the table was already updated at the

COMMIT
.

Undo logs are stored by default in the shared InnoDB tablespace but could be placed into separate tablespaces for better space management. This is the recommended option.

You can find more information about undo logs in the User Reference Manual.

The Redo Log

The redo log is a disk-based data structure used during crash recovery to correct data written by incomplete transactions.

source: 15.6.5 Redo Log

During normal operations, InnoDB never reads it. Only if MySQL server was not stopped properly InnoDB uses records in the redo log to correct data.

Why is the Redo Log is Needed?

InnoDB stores data for the rows in the clustered index. The internal structure of the clustered index is B-Tree. This storage allows fast read access, but it is slow on writes because it consistently needs to re-balance the tree. Additionally, even if only non-indexed data is changed, it takes time to find the proper page on the disk where the update should have placed.

Therefore InnoDB initially stores the change in the in-memory buffer pool. This allows returning success to the application faster. Then, in the background, InnoDB flushes data from the buffer pool to the disk. Therefore at some time, newly committed data could exist only in memory. However, in case of a crash, data in the memory is gone.

Therefore, at the same time, an encoded change request is also written into the redo log. Such a write is sequential and no time needs to be spent on finding the appropriate position. Thus this operation is much faster than updating the table file. Still, it is crash-safe, because data now exists in both the memory (active data set) and on the disk (a record in the redo log).

Size of the redo log is limited by two options:

  1. innodb_log_file_size
    1. Size of the individual log file
  2. innodb_log_files_in_group
    1. Number of the log files

The total size of the redo log can be calculated by the formula:

innodb_log_file_size * innodb_log_files_in_group

What Will Happen if the Total Size of the Redo Log is Reached?

Every record in the redo log has its own number: LSN. Normally InnoDB consistently flushes changes to the table files and rewrites records those LSNs are already flushed in a circular fashion.

However, if the combined size of the redo log is too small for the number of writes which InnoDB receives in the short amount of time, it is possible that the redo log gets full before InnoDB writes the data into table files. In this case, InnoDB stops all write activity and performs so-called aggressive flushing. You can read more about flushing in the User Reference Manual.

Therefore it is essential to set the size of the redo log big enough, so InnoDB could keep up with the application writes. Check out how to calculate good InnoDB log file size.

Q: In the cases where InnoDB crashes (long semaphore wait occurs) what are the reasons for the crash?

A: InnoDB uses semaphores to protect internal structures for concurrent usage. Normally such semaphores are held only for a short period of time. Therefore if semaphore waited more than 600 seconds, InnoDB decides that something went terribly wrong and crashes the server. In this case, you need to do what the error message suggests: report a bug at https://bugs.mysql.com and/or https://jira.percona.com.

However, sometimes semaphore waits when the expectedly long operation finishes. For example,

ANALYZE TABLE
  on a very large table. In this case, the server may crash for no valid reason. We saw cases when even a diagnostic query caused such a failure. It was reported at PS-6113 and fixed in Percona Server for MySQL. Still, this limitation exists in the upstream MySQL Server as of versions 5.7.28 and 8.0.18

How to Create Your Own Repositories for Packages

$
0
0
How to Create Your Own Repositories for Packages

For Linux, the most common way to distribute software is binary packages in the rpm or deb format. Most packages are included in the official distribution repositories or 3rd party software repositories. Nevertheless, there are some cases where you need to install just a few standalone packages.   You might be able to use the local package install tools, namely dpkg or rpm, however, there are cases where packages can’t be installed due to the dependencies and you need to install all dependencies manually. It might take some time and isn’t always an easy process. But there is a solution that can help – you can create your own local repository and deploy your packages to it.

Let’s discuss how to create your local repositories to make your life easier.

RPM-Based Distributions

RPM-based operating systems work with rpm packages and the most common package manager for them is yum.   While newer RPM-based operating systems use the dnf utility,  it maintains compatibility with yum repositories so these instructions also apply for dnf.

In order to create a yum repository you need to perform the following steps:

  1. Install createrepo utility
  2. Create a repository directory
  3. Put RPM files into the repository directory
  4. Create the repository metadata
  5. Create the repository configuration file

1. Install createrepo utility

To create a yum repository we need to install additional software called “createrepo” :

sudo yum install createrepo

2. Create a repository directory

You need to create a new directory that will be the location of your yum repository and will hold the desired rpm package files.

So you should decide the location of this directory and create it

mkdir <your_directory_name>

as an example let’s use /opt/rpms

mkdir /opt/rpms

3. Put RPM files into the repository directory

You should just copy or download your RPMs into the new directory

4. Create the repository metadata

The createrepo command reads through the directory with rpm packages and creates a new directory called “repodata” in it.  This directory contains the metadata information for the repository.  Every time you add additional rpm package files to your yum repository, you need to re-create the repository metadata with the “createrepo” command.

So to create the repository you need to execute:

createrepo <path_to_your_directory_with_rpms>

example:

createrepo /opt/rpms

If you already created the repository metadata and you are just adding new packages to it you need to update the repo:

createrepo --update /opt/rpms

5. Create the repository configuration file

A yum repository has its own configuration file and there are a few rules for it:

  • It must be located in /etc/yum.repos.d/ directory
  • It must have the .repo extension, to be recognized by yum

File options are:

  • Repository ID – One word unique repository ID (example: [myrepo])
  • Name – Human-readable name of the repository (example: name=My Repository)
  • Baseurl – URL to the repodata directory. You can use file://path if repository is located locally or ftp://link, http://link, https://link if repository is located remotely – HTTP Authentication available http://user:password@www.
  • Enabled – Enable repository when performing updates and installs (example: enabled=1)
  • Gpgcheck – Enable/disable GPG signature checking (example: gpgcheck=1)
  • Gpgkey – URL to the GPG key (example: gpgkey=http://mirror.cisp.com/)
  • Exclude – List of the packages to exclude (example: exclude=httpd,mod_ssl)
  • Includepkgs – List of the packages to include (example: include=kernel)

Required yum repository configuration file options are:

  •  Repository ID
  •  Name
  •  Baseurl
  •  Enabled

For example:

[customrepo]
name=CustomRepository
baseurl=file:///opt/rpms
enabled=1
gpgcheck=0

Debian-Based Systems

A Debian repository is a set of Debian binary or source packages organized in a special directory tree with various infrastructure files.

In most cases on Debian-based systems all repositories are managed by the “apt” utilities (apt, apt-get, apt-cache, etc…)

To create an apt repository you need to perform the following steps:

  1. Install dpkg-dev utility
  2. Create a repository directory
  3. Put deb files into the repository directory
  4. Create a file that apt-get update can read
  5. Add info to your sources.list pointing at your repository

1. Install dpkg-dev utility

This package provides the development tools required to unpack, build and upload Debian source packages.

You can install it using apt-get:

sudo apt-get install dpkg-dev

2. Create a repository directory

You need to create a new directory that will be the location of your deb repository and will hold the desired deb package files.

You should decide the location of this directory and create it

mkdir <your_directory_name>

as an example let’s use /opt/debs

mkdir /opt/debs

3. Put deb files into the repository directory

You should just copy or download your rpm files into the new directory

4. Create a file that “apt-get update” can read

For this, you should run dpkg-scanpackages command.

dpkg-scanpackages  sorts through a tree of Debian binary packages and creates a Packages file, used by apt, dselect, etc, to tell the user what packages are available for installation.

cd /opt/debs
dpkg-scanpackages . /dev/null > Release

5. Add info to your sources.list pointing at your repository

You need to add a line into Sources.list in the following way:

deb file:///<path_to_your_repo_dir> ./

For example:

deb file:///opt/debs ./

If you built packages and didn’t sign them with gpg or you haven’t imported the gpg key which was used for signing packages in your repo and you trust them, you can use the following definition to skip the signing check.

[trusted=yes]

For example:

deb [trusted=yes] file:///opt/debs ./

There are various reasons for building a repository yourself.  You might just have a few packages with local modifications that you want to make available, you may want to run a local mirror with packages used by several machines to save bandwidth, or you have built packages yourself and want to test them before publication.  These steps can provide a solution for you.

Using pt-heartbeat with ProxySQL

$
0
0
Using pt-heartbeat with ProxySQL

Using pt-heartbeat with ProxySQLProxySQL and Orchestrator are usually installed to achieve high availability when using MySQL replication. On a failover (or graceful takeover) scenario, Orchestrator will promote a slave, and ProxySQL will redirect the traffic. Depending on how your environment is configured, and how long the promotion takes, you could end up in a scenario where you need manual intervention.

In this post, we are going to talk about some considerations when working with ProxySQL in combination with pt-heartbeat (part of Percona Toolkit), with the goal of making your environment more reliable.

Why Would We Want pt-heartbeat With ProxySQL?

If you have intermediate masters, the seconds_behind_master metric is not good enough. Slave servers that are attached to intermediate masters will report the seconds_behind_master relative to their own master, not the “real” top-level server receiving the writes. So it is possible ProxySQL will send traffic to 2nd level slaves that are showing no latency respective to “their” master, but still have stale data. This happens when the intermediate master is lagging behind.

Another reason is the show slave status metric resolution is 1 second. Deploying pt-heartbeat will get us the real latency value in milliseconds, across the entire topology. Unfortunately, ProxySQL rounds the value to seconds, so we cannot fully take advantage of this at the time of this writing.

How Do I Deploy pt-heartbeat for a ProxySQL Environment?

ProxySQL since version 1.4.4 has built-in support to use pt-heartbeat. We only need to specify the heartbeat table as follows:

SET mysql-monitor_replication_lag_use_percona_heartbeat = 'percona.heartbeat';
LOAD MYSQL VARIABLES TO RUNTIME;
SAVE MYSQL VARIABLES TO DISK;

Now we need to decide how to deploy pt-heartbeat to be able to update the heartbeat table on the master. The easiest solution is to install pt-heartbeat on the ProxySQL server itself. 

We need to create a file to store pt-heartbeat configuration, e.g /etc/percona-toolkit/pt-heartbeat-prod.conf:

utc
replace
daemonize
pid=/var/run/pt-heartbeat-prod.pid
database=percona
table=heartbeat
interval=0.01
port=3306
user=monitor
password=******
host=127.0.0.1

We point pt-heartbeat to go through ProxySQL and route its traffic to the writer hostgroup. In order to do this, we need a query rule:

INSERT INTO mysql_query_rules (rule_id, active, username, destination_hostgroup, apply) VALUES (1, 1, "monitor", 10, 1)
LOAD MYSQL QUERY RULES TO RUNTIME;
SAVE MYSQL QUERY RULES TO DISK;

In the example above, the writer hostgroup is 10 and the user that pt-heartbeat connects as is monitor;

Next, we need to create a systemd service that will be in charge of making sure pt-heartbeat is always running. The caveat here is that when the master is set to read-only for any reason (e.g. a master switch), pt-heartbeat will stop (by design) and return an error code !=0. So, we need to tell systemd to catch this and restart the daemon. The way to accomplish this is by using the Restart=on-failure functionality.

Here’s a sample systemd unit script:

[Unit]
Description="pt-heartbeat"
After=syslog.target mysql.service
#Requires=mysql.service

[Install]
WantedBy=multi-user.target

[Service]
Type=simple
PIDFile=/var/run/pt-heartbeat-prod.pid
ExecStart=/usr/bin/pt-heartbeat "--config=/etc/percona-toolkit/pt-heartbeat-prod.conf" "--update"
StandardOutput=syslog
StandardError=syslog
SyslogIdentifier=pt-heartbeat
Restart=on-failure
RestartSec=5s

We also specify RestartSec=5s, as the default of 100 ms sleep before restarting a service is overkill for this use case.

After changes are done, we need to daemon-reload to update SystemV:

systemctl daemon-reload

At this point we can start and stop the service using:

service pt-heartbeat start
service pt-heartbeat stop

Dealing With Master Takeover/Failover

Let’s assume slave servers are configured with max_replication_lag of 5 seconds. Usually, the failover process can take a few seconds, where pt-heartbeat might stop updating the heartbeat table. This means that the slave that is picked as the new master might report replication lag (as per pt-heartbeat), even if it was not really behind the master.

Now, we found out ProxySQL does not automatically clear the max_replication_lag setting for a server when it becomes a master. When configured to use pt-heartbeat, it will (incorrectly)  flag the new master as lagging, and shun it, causing writes to this cluster to be rejected!. This behavior happens ONLY when using pt-heartbeat. Using the show slave status method to detect latency, everything works as expected. You can check the bug report for more information.

For the time being, one way to deal with the above scenario is to write a script that monitors the mysql_servers table, and if it finds a writer node that has max_replication_lag configured, clear that value so it won’t be shunned.

Here’s some sample code:

#!/bin/bash

READER_HOSTGROUP=11
WRITER_HOSTGROUP=10
OTHER_WHERE_CLAUSE=" "
REPLICATION_LAG=5
MYSQL="mysql --socket=/tmp/proxysql_admin.sock -uadmin -p*****"
if (( $(echo "SELECT hostname FROM mysql_servers WHERE max_replication_lag !=0 AND hostgroup_id= ${WRITER_HOSTGROUP} " | $MYSQL | wc -l) > 0 ))
then
  echo "UPDATE mysql_servers SET max_replication_lag=0 WHERE hostgroup_id=${WRITER_HOSTGROUP} ;
        UPDATE mysql_servers SET max_replication_lag=${REPLICATION_LAG} WHERE hostgroup_id=${READER_HOSTGROUP} ${OTHER_WHERE_CLAUSE};
        LOAD MYSQL SERVERS TO RUNTIME; SAVE MYSQL SERVERS TO DISK;" | $MYSQL
fi

We can use ProxySQL’s scheduler to run our script every 5 seconds like this:

INSERT INTO scheduler (id, active, interval_ms, filename) VALUES (1, 1, 5000, "/usr/local/bin/fix_replication_lag.sh");

Conclusion

We have seen how pt-heartbeat is useful to monitor the real latency for an environment using ProxySQL. We also discussed how to deal with the edge case of a new master being shunned because of latency, due to how ProxySQL and pt-heartbeat work.

Django 3 Tutorial & Example: Build a CRUD REST API for A Simple CRM

$
0
0
Django 3 is released with full async support! In this tutorial series, you'll learn about Django 3 by creating a CRUD example application with database, admin access, and REST API views. We'll be using MySQL as the database system. Throughout this beginner's tutorial for Django 3, we are going to learn to build web applications with Python and Django. This tutorial assumes no prior experience with Django, so we'll be covering the basic concepts and elements of the Django framework by emphasizing essential theory with practice. Basically, we are going to learn Django fundamental concepts while building a simple CRM web application. This tutorial doesn't only cover fundamental basics of Django but also advanced concepts such as how to use and integrate Django with modern front end frameworks like Angular 2+, Vue and React. You'll learn about CRUD, database ORM, how to create API views and URLs. What's Django? Django is an open source Python based web framework for building web applications quickly. It's a pragmatic framework designed for developers working on projects with strict dead lines. It's perfect for quickly creating prototypes and then continue building them after clients approval. It follows a Model View Controller (MVC) design pattern Django uses the Python language, a general purpose, powerful and feature-rich programming language. Django 3 Features Django 3 comes with many new features such as: MariaDB support: Django now officially supports MariaDB 10.1+. You can use MariaDB via the MySQL backend, ASGI support for async programming, Django 3.0 provides support for running as an ASGI application, making Django fully async-capable Exclusion constraints on PostgreSQL: Django 3.0 adds a new ExclusionConstraint class which adds exclusion constraints on PostgreSQL, etc. What's MVC? MVC is a software architectural design pattern which encourages the separation of concerns and effective collaboration between designers and developers when working on the same project. It basically divides or separates your app into three parts: Model: responsible for data storage and management, View: responsible of representing and rendering the user interface or view, Controller: responsible for handling logic to control the user interface and work with data model. Thanks to MVC, you as a developer can work in the model and controller parts without being concerned with the user interface (left to designers) so if anything changes on the side of designers on the user interface, you can rest assured that you will not be affected. Introduction to Python Python is a general purpose programing language that's suitable for developing all kind of applications including web applications. Python is known by a clean syntax and a large standard library which contains a wide range of modules that can be used by developers to build their applications instead of reinventing the wheel. Here is a list of features and characteristics of Python: Python is an Object Oriented Language just like Java or C++. Also like Java, Python is an interpreted language that runs on top of its own virtual machine which makes it a portable language that can runs across every machine and operating system such as Linux, Windows and MAC. Python is especially popular among the scientific community where it's used for creating numeric applications. Python is also known by the great performance of its runtime environment which makes it a good alternative to PHP for developing web applications. For more information you can head to http://python.org/ where you can also download Python binaries for supported systems. For Linux and MAC, Python is included by default so you don't have to install it. For Windows just head over to the official Python website and grab your installer. Just like any normal Windows program, the installation dead process is easy and straightforward. Why Using Django? Due to its popularity and large community, Python has numerous web frameworks among them Django. So what makes Django the right choice for you or your next project? Django is a batteries-included framework Django includes a set of batteries that can be used to solve common web problems without reinventing the wheel such as: the sites framework, the auth system, forms generation, an ORM for abstracting database systems, and a very powerful templating engine, caching system, RSS generation framework etc. The Django ORM Django has a powerful ORM (Object Relational Mapper) which allows developers to use Python OOP classes and methods instead of SQL tables and queries to work with SQL based databases. Thanks to the Django ORM, developers can work with any database system such as MySQL or PostgresSQL without knowing anything about SQL. In the same time the ORM doesn't get in the way. You can write custom SQL anytime you want especially if you need to optimize the queries against your server database for increased performance. Support for Internationalization: i18n You can use Django for writing web applications for other languages than English with a lot of ease thanks to its powerful support for internationalization or you can also create multi lingual websites The Admin Interface Django is a very suitable framework for quickly building prototypes thanks to its auto-generated admin interface. You can generate a full fledged admin application that can be used to do all sorts of CRUD operations against your database models you have registered with the admin module using a few lines of code. Community and Extensive Documentation Django has a great community that has contributed all sorts of awesome things to Django from tutorials and books to reusable open source packages that extend the core framework to include solutions for even more web development problems without reinventing the wheel or wasting time implementing what other developers have already created. Django has also one of the most extensive and useful documentation on the web which can gets you up and running with Django in no time. As a conclusion, if you are looking for a web framework full of features that makes building web applications fun and easy and that has all what you can expect from a modern framework. Django is the right choice for you if you are a Python developer. Python is a portable programming language that can be used anywhere its runtime environment is installed. Django is a Python framework which can be installed on any system which supports the Python language. In this tutorial part, we are going to see how to install Python and Django on the major available operating systems i.e Windows, Linux and MAC. At this point of our Django tutorial, we have covered what is Python, MVD and Django and the features of the Django. Let's now see how to install Python and a local development environment with pip and venv. Installing Python Depending on your operating system you may or may not need to install Python. In Linux and MAC OS Python is included by default. You may only need to update it if the installed version is outdated. Installing Python On Windows Python is not installed by default on Windows, so you'll need to grab the official installer from the official Python website at http://www.python.org/download/. Next launch the installer and follow the wizard to install Python just like any other Windows program. Also make sure to add Python root folder to system path environment variable so you can execute the Python executable from any directory using the command prompt. Next open a command prompt and type python. You should be presented with a Python Interactive Shell printing the current version of Python and prompting you to enter your Python commands (Python is an interpreted language) Installing Python on Linux If you are using a Linux system, there is a great chance that you already have Python installed but you may have an old version. In this case you can very easily update it via your terminal depending on your Linux distribution. For Debian based distributions, like Ubuntu you can use the apt package manager sudo apt-get install python This will update your Python version to the latest available version. For other Linux distributions you should look for equivalent commands to install or update Python which is not a daunting task if you already use a package manager to install packages for your system then you should follow the same process to install or update Python. Installing Python on MAC OS Just like Linux, Python is included by default on MAC but in case you have an old version you should be able to update it by going to [http://www.python.org/download/mac/](http://www.python.org/download/mac/ and grab a Python installer for MAC. Now if you managed to install or update Python on your own system or in case you have verified that you already have an updated version of Python installed on your system let's continue by installing Django. Installing PIP PIP is a Python package manager which's used to install Python packages from Python Package Index which is more advanced than easy_install the default Python package manager that's installed by default when you install Python. You should use PIP instaed of easy_install whenever you can but for installing PIP itself you should use easy_install. So let's first install PIP: Open your terminal and enter: $ sudo easy_install pip You can now install Django on your system using pip $ sudo pip install django While you can do this to install Django, globally on your system, it's strongly not recommend. Instead you need to use a virtual environement to install packages. Creating a MySQL Database In this Django tutorial, we'll be using a MySQL database. In your terminal invoke the mysql client using the following command: $ mysql -u root -p Enter your MySQL password and hit Enter. Next, run the following SQL statement to create a database: mysql> create database crmdb; Django 3 Tutorial: Creating a Virtual Environment Let's start our tutorial by creating a virtual environment. Open a new terminal, navigate to a working folder and run the following command: $ cd ~/demos $ python3 -m venv .env Next, activate the virtual environment using the following command: $ source .env/bin/activate At this point of our tutorial, we've created a virtual environment for our Django project. Let's now proceed to creating our project. Django 3 Tutorial: Installing Django and Django REST Framework Now, that you have created and activated your virtual environment, you can install your Python packages using pip. In your terminal where you have activated the virtual environment, run the following commands to install the necessary packages: $ pip install django $ pip install djangorestframework You will also need to install the MySQL client for Python using pip: $ pip install mysqlclient Django 3 Tutorial: Creating a Project Now, let's proceed to creating our django project. In your terminal, run the following command: $ django-admin startproject simplecrm This command will take care of creating a bunch of necessary files for the project. Executing the tree command in the root of our created project will show us the files that were created. . ├── simplecrm │   ├── __init__.py │   ├── settings.py │   ├── urls.py │   └── wsgi.py └── manage.py __init__ is the Python way to mark the containing folder as a Python package which means a Django project is a Python package. settings.py is the project configuration file. You can use this file to specify every configuration option of your project such as the installed apps, site language and database options etc. urls.py is a special Django file which maps all your web app urls to the views. wsgi.py is necessary for starting a wsgi application server. manage.py is another Django utility to manage the project including creating database and starting the local development server. These are the basic files that you will find in every Django project. Now the next step is to set up and create the database. Next, open the settings.py file and update the database setting to point to our crmdb database: DATABASES = { 'default': { 'ENGINE': 'django.db.backends.mysql', 'NAME': 'crmdb', 'USER': 'root', 'PASSWORD': 'YOUR_DB_PASSWORD', 'HOST': 'localhost', 'PORT': '3306', } } Next, add rest_framework to the INSTALLED_APPS array: INSTALLED_APPS = [ # [...] 'rest_framework' ] Finally, migrate the database using the following commands: $ cd simplecrm $ python manage.py migrate You will be able to access your database from the 127.0.0.1:8000 address. Django 3 Tutorial: Create an Admin User Let's create an admin user using the following command: $ python manage.py createsuperuser Django 3 Tutorial: Creating an Application Next, let's create a Django application for encapsulating our core CRM functionality. In your terminal, run the following command: $ python manage.py startapp crmapp Next, you need to add it in the settings.py file: INSTALLED_APPS = [ # ... 'rest_framework', 'crmapp' ] Django 3 Tutorial: Creating the Database Models Let's now proceed to create the database models for our application. We are going to create the following models: Contact Account Activity ContactStatus ContactSource ActivityStatus We have three main models which are Contact, Account and Activity. The last three models are simply lookup tables (They can be replaced by an enum). Open the crmapp/models.py file and the following code: from django.db import models from django.contrib.auth.models import User INDCHOICES = ( ('FINANCE', 'FINANCE'), ('HEALTHCARE', 'HEALTHCARE'), ('INSURANCE', 'INSURANCE'), ('LEGAL', 'LEGAL'), ('MANUFACTURING', 'MANUFACTURING'), ('PUBLISHING', 'PUBLISHING'), ('REAL ESTATE', 'REAL ESTATE'), ('SOFTWARE', 'SOFTWARE'), ) class Account(models.Model): name = models.CharField("Name of Account", "Name", max_length=64) email = models.EmailField(blank = True, null = True) phone = models.CharField(max_length=20, blank = True, null = True) industry = models.CharField("Industry Type", max_length=255, choices=INDCHOICES, blank=True, null=True) website = models.URLField("Website", blank=True, null=True) description = models.TextField(blank=True, null=True) createdBy = models.ForeignKey(User, related_name='account_created_by', on_delete=models.CASCADE) createdAt = models.DateTimeField("Created At", auto_now_add=True) isActive = models.BooleanField(default=False) def __str__(self): return self.name class ContactSource(models.Model): status = models.CharField("Contact Source", max_length=20) def __str__(self): return self.status class ContactStatus(models.Model): status = models.CharField("Contact Status", max_length=20) def __str__(self): return self.status class Contact(models.Model): first_name = models.CharField("First name", max_length=255, blank = True, null = True) last_name = models.CharField("Last name", max_length=255, blank = True, null = True) account = models.ForeignKey(Account, related_name='lead_account_contacts', on_delete=models.CASCADE, blank=True, null=True) email = models.EmailField() phone = models.CharField(max_length=20, blank = True, null = True) address = models.TextField(blank=True, null=True) description = models.TextField(blank=True, null=True) createdBy = models.ForeignKey(User, related_name='contact_created_by', on_delete=models.CASCADE) createdAt = models.DateTimeField("Created At", auto_now_add=True) isActive = models.BooleanField(default=False) def __str__(self): return self.first_name class ActivityStatus(models.Model): status = models.CharField("Activity Status", max_length=20) def __str__(self): return self.status class Activity(models.Model): description = models.TextField(blank=True, null=True) createdAt = models.DateTimeField("Created At", auto_now_add=True) contact = models.ForeignKey(Contact, on_delete=models.CASCADE, blank=True, null=True) def __str__(self): return self.description Django 3 Tutorial: Creating Model Serializers After creating models we need to create the serializers. In the crmapp folder create a serializers.py file: $ cd crmapp $ touch serializers.py Next, open the file and add the following imports: from rest_framework import serializers from .models import Account, Activity, ActivityStatus, Contact, ContactSource, ContactStatus Next, add a serializer class for each model: class AccountSerializer(serializers.ModelSerializer): class Meta: model = Account fields = "__all__" class ActivitySerializer(serializers.ModelSerializer): class Meta: model = Activity fields = "__all__" class ActivityStatusSerializer(serializers.ModelSerializer): class Meta: model = ActivityStatus fields = "__all__" class ContactSerializer(serializers.ModelSerializer): class Meta: model = Contact fields = "__all__" class ContactSourceSerializer(serializers.ModelSerializer): class Meta: model = ContactSource fields = "__all__" class ContactStatusSerializer(serializers.ModelSerializer): class Meta: model = ContactStatus fields = "__all__" Django 3 Tutorial: Creating API Views After creating the model serializers, let's now create the API views. Open the crmapp/views.py file and add the following imports: from rest_framework import generics from .models import Account, Activity, ActivityStatus, Contact, ContactSource, ContactStatus from .serializers import AccountSerializer, ActivitySerializer, ActivityStatusSerializer, ContactSerializer, ContactSourceSerializer, ContactStatusSerializer Next, add the following views: from rest_framework import generics from .models import Account, Activity, ActivityStatus, Contact, ContactSource, ContactStatus from .serializers import AccountSerializer, ActivitySerializer, ActivityStatusSerializer, ContactSerializer, ContactSourceSerializer, ContactStatusSerializer class AccountAPIView(generics.ListCreateAPIView): queryset = Account.objects.all() serializer_class = AccountSerializer class ActivityAPIView(generics.ListCreateAPIView): queryset = Activity.objects.all() serializer_class = ActivitySerializer class ActivityStatusAPIView(generics.ListCreateAPIView): queryset = ActivityStatus.objects.all() serializer_class = ActivitySerializer class ContactAPIView(generics.ListCreateAPIView): queryset = Contact.objects.all() serializer_class = ContactSerializer class ContactStatusAPIView(generics.ListCreateAPIView): queryset = ContactStatus.objects.all() serializer_class = ContactSerializer class ContactSourceAPIView(generics.ListCreateAPIView): queryset = ContactSource.objects.all() serializer_class = ContactSourceSerializer After creating these models, you need to create migrations using the following command: $ python manage.py makemigrations Next, you need to migrate your database using the following command: $ python manage.py migrate Creating API URLs Let's now create the API URLs to access our API views. Open the urls.py file and add the following imports: from django.contrib import admin from django.urls import path from crmapp import views Next, add the following content: urlpatterns = [ path('admin/', admin.site.urls), path(r'accounts', views.AccountAPIView.as_view(), name='account-list'), path(r'contacts', views.ContactAPIView.as_view(), name='contact-list'), path(r'activities', views.ActivityAPIView.as_view(), name='activity-list'), path(r'activitystatuses', views.ActivityStatusAPIView.as_view(), name='activity-status-list'), path(r'contactsources', views.ContactSourceAPIView.as_view(), name='contact-source-list'), path(r'contactstatuses', views.ContactStatusAPIView.as_view(), name='contact-status-list') ] Django Tutorial: Enabling CORS For development purposes, we'll need to enable CORS (Cross Origin Resource Sharing) in our Django application. So start by installing django-cors-headers using pip $ pip install django-cors-headers Next, you need to add it to your project settings.py file: INSTALLED_APPS = ( ## [...] 'corsheaders' ) Next, you need to add corsheaders.middleware.CorsMiddleware middleware to the middleware classes in settings.py MIDDLEWARE = ( 'corsheaders.middleware.CorsMiddleware', # [...] ) You can then, either enable CORS for all domains by adding the following setting: CORS_ORIGIN_ALLOW_ALL = True You can find more configuration options from the docs. Starting the local development server Django has a local development server that can be used while developing your project. It's a simple and primitive server which's suitable only for development not for production. To start the local server for your project, you can simply issue the following command inside your project root directory: $ python manage.py runserver Next navigate to the http://localhost:8000/ address with a web browser. You should see a web page with a message: It worked! Conclusion To conclude this django 3 tutorial, let's summarize what we have done. We have created a new Django project, created and migrated a MySQL database, built a simple CRM REST API with Django REST framework and started a local development server.

Seriously Inconsistent Table Information in MySQL 8.0 Information_Schema

$
0
0

MySQL Information_SchemaIn MySQL 8, Information Schema was basically re-written to utilize the all-New Data Dictionary which made it faster and better in many ways. Yet it also introduces some very counterintuitive behaviors when it comes to how actual and consistent data is.

Here is a simple test.  Let’s create a table and insert a bunch of rows in it… and then check table size:

mysql> show table status \G
*************************** 1. row ***************************
           Name: t
         Engine: InnoDB
        Version: 10
     Row_format: Dynamic
           Rows: 0
 Avg_row_length: 0
    Data_length: 16384
Max_data_length: 0
   Index_length: 0
      Data_free: 0
 Auto_increment: NULL
    Create_time: 2019-12-27 01:04:37
    Update_time: NULL
     Check_time: NULL
      Collation: utf8mb4_0900_ai_ci
       Checksum: NULL
 Create_options:
        Comment:
1 row in set (0.02 sec)

mysql> select count(*) from t;
+----------+
| count(*) |
+----------+
|   524288 |
+----------+
1 row in set (0.21 sec)

So we have a bunch of rows in the table but the information schema (queried for simplicity with SHOW TABLE STATUS command)  tells us the table is empty!

Any reasonable person would go ahead and file a bug at this point, but if you instead decide to spend some time googling you will find it is intended behavior.  There is information_schema_stats_expiry variable that controls caching for these statistics, which defaults to 86400 seconds – or one whole day!

If caching is indeed in order, would not be something like 5 minutes be a much more reasonable value, showing the “big picture”  correctly while also helping to improve performance? Such an approach would avoid having TB-sized tables on disk which report they have zero size, at least not for long.

In general, this looks like a classic case of premature optimization to me – with a moderate number of tables most users will have queries run pretty fast without caching (setting information_schema_stats_expiry to 0), and in my not-very-scientific-tests, I do not think I saw a performance difference more than 2x with and without caching. So why report confusing cached data when you can get the actual data fast enough? I do not know and a MySQL Engineering blog post on this topic (MySQL 8.0: Improvements to Information_schema) does not explain the reasoning of caching by default or the choice of such high expiration time.

If you read the MySQL manual you may also be under the impression you can just access mysql.index_stats and mysql.table_stats tables if you want the actual data from its source. But unfortunately, access to those tables is not available even to the  MySQL “root” user.

mysql> select * from mysql.index_stats limit 5;
ERROR 3554 (HY000): Access to data dictionary table 'mysql.index_stats' is rejected.

The good news, though, is that information_schema_stats_expiry is session-variable so you can easily set it to zero for the applications which need up to date table information!

How to Monitor MySQL Deployments with Prometheus & Grafana at ScaleGrid

$
0
0

Monitoring your MySQL database performance in real-time helps you immediately identify problems and other factors that could be causing issues now or in the future. It’s also a good way to determine which components of the database can be enhanced or optimized to increase your efficiency and performance. This is usually done through monitoring software and tools either built-in to the database management software or installed from third-party providers.

Prometheus is an open-source software application used for event monitoring and alerting. It can be used along with a visualization tool like Grafana to easily create and edit dashboards, query, visualize, alert on, and understand your metrics. ScaleGrid provides full admin access to your MySQL deployments – this makes it easier to integrate the existing MySQL ecosystem of tools with your ScaleGrid MySQL deployments on AWS or Azure. Prometheus works well for recording any purely numeric time series, and also offers support for multi-dimensional data collection and querying. Grafana can be used with it to build dashboards that help visualize this data in a way that is easy to interpret and utilize. These tools will provide additional insight to your metrics, usage patterns, and datasets along with your ScaleGrid MySQL monitoring, query analysis, and alerts. In this blog post, we discuss how you can set up and use Prometheus and Grafana with your ScaleGrid MySQL deployments for advanced database monitoring and alerting.

How to Set Up Your MySQL Monitoring

Let’s walk through the steps involved in installing and configuring the Prometheus server to store and display the metrics, an exporter (MySQL Exporter in this case) to collect the metrics and relay them to the Prometheus server, and Grafana to create dashboards. The MySQL Exporter tool can be installed locally on a MySQL server or centrally on the Prometheus server. In the use case below, we will explain how to set up and start using Prometheus, MySQL Exporter, and Grafana from a central host running on Ubuntu to monitor multiple MySQL servers. You can also review step-by-step instructions in our Prometheus and Grafana for MySQL help doc.

The block diagram below shows the setup of a master-slave-quorum MySQL deployment that includes two data-bearing nodes (master and slave) and one voting member (quorum) using the MySQL Exporter, Prometheus host, and Grafana:

Prometheus block diagram - host for MySQL master slave quorum deployment with Grafana

Installing & Configuring the Prometheus Server

Prometheus is the tool we will be using to centralize and store your MySQL metrics. It scrapes the metrics from one or several exporters at regular intervals and displays it on its UI. Below are the steps to install and configure Prometheus on a central Ubuntu host. For more details, you can refer this article.

1. Create a Prometheus System Group & User

$sudo groupadd --system prometheus
$sudo useradd -s /sbin/nologin --system -g prometheus prometheus

2. Create a Data Directory for Prometheus

$sudo mkdir /var/lib/prometheus

3. Create Configuration Directories for Prometheus

$for i in rules rules.d files_sd; do sudo mkdir -p /etc/prometheus/${i}; done

4. Download the Prometheus Archive & Extract the File

To download the latest binary archive for Prometheus:

$mkdir -p /tmp/prometheus && cd /tmp/Prometheus
$curl -s https://api.github.com/repos/prometheus/prometheus/releases/latest \
| grep browser_download_url \
| grep linux-amd64 \
| cut -d '"' -f 4 \
| wget -qi -

To extract the file:

$tar xvf prometheus*.tar.gz
$cd prometheus*/

5. Move the Prometheus Files to Standard Locations

Move Prometheus binary files to /usr/local/bin:

$sudo mv prometheus promtool /usr/local/bin/

Move Prometheus configuration template to /etc directory:

$sudo mv prometheus.yml  /etc/prometheus/prometheus.yml

Also move consoles and console_libraries to /etc/prometheus directory:

$sudo mv consoles/ console_libraries/ /etc/prometheus/

6. Create/Edit a Prometheus Configuration File

$sudo vim /etc/prometheus/prometheus.yml

The template configurations should look similar to below:

 #my global config
 global:
 scrape_interval: 15s # Set the scrape interval to every 15 seconds. Default is every 1 minute.
 evaluation_interval: 15s # Evaluate rules every 15 seconds. The default is every 1 minute.
 #scrape_timeout is set to the global default (10s).

 #Alertmanager configuration
 alerting:
 alertmanagers:
 - static_configs:
 - targets:
 #- alertmanager:9093

 #Load rules once and periodically evaluate them according to the global 'evaluation_interval'.
 rule_files:
 #- "first_rules.yml"
 #- "second_rules.yml"

 #A scrape configuration containing exactly one endpoint to scrape:
 #Here it's Prometheus itself.
 scrape_configs:
 #The job name is added as a label `job=<job_name>` to any timeseries scraped from this config.
 - job_name: 'prometheus'

 #metrics_path defaults to '/metrics'
 #scheme defaults to 'http'.

 static_configs:
 - targets: ['localhost:9090']

7. Create a Prometheus systemd Service Unit File

$cat /etc/systemd/system/prometheus.service 

 [Unit]
 Description=Prometheus
 Documentation=https://prometheus.io/docs/introduction/overview/
 Wants=network-online.target
 After=network-online.target

 [Service]
 Type=simple
 Environment="GOMAXPROCS=1"
 User=prometheus
 Group=prometheus
 ExecReload=/bin/kill -HUP $MAINPID
 ExecStart=/usr/local/bin/prometheus \
 --config.file=/etc/prometheus/prometheus.yml \
 --storage.tsdb.path=/var/lib/prometheus \
 --web.console.templates=/etc/prometheus/consoles \
 --web.console.libraries=/etc/prometheus/console_libraries \
 --web.listen-address=0.0.0.0:9090 \
 --web.external-url=

 SyslogIdentifier=prometheus
 Restart=always

 [Install]
 WantedBy=multi-user.target

Remember to edit the line: Environment=”GOMAXPROCS=1 by replacing 1 with the number of  **vcpus** on your server.

8. Change Directory Permissions

Change the ownership of these directories to Prometheus user and group:

$for i in rules rules.d files_sd; do sudo chown -R prometheus:prometheus /etc/prometheus/${i}; done
$for i in rules rules.d files_sd; do sudo chmod -R 775 /etc/prometheus/${i}; done
$sudo chown -R prometheus:prometheus /var/lib/prometheus/

9. Reload systemd Daemon & Start the Service

$sudo systemctl daemon-reload
$sudo systemctl start prometheus
$sudo systemctl enable prometheus

Check status using systemctl status prometheus command:

Installing & Configuring the Prometheus Server for MySQL - Reload systemd Daemon & Start the Service

10.  Configure a Firewall to Open Port 9090

$sudo firewall-cmd --add-port=9090/tcp --permanent
$sudo firewall-cmd --reload

Once the setup is complete, you can access the Prometheus UI by logging in to http://<PrometheusHostIP>:9090

Installing & Configuring the Prometheus Server for MySQL - Access Prometheus UI

How to Monitor #MySQL Deployments with Prometheus & Grafana at ScaleGridClick To Tweet

Installing & Configuring MySQL Prometheus Exporter

Prometheus requires an exporter for collecting MySQL server metrics. This exporter can be run centrally on the Prometheus server, or on the database server. For further reading, refer to the Prometheus documentation.

Follow the below steps to install and set up MySQL Prometheus Exporter on the central Prometheus host. For more details, refer to this article.

1. Download & Install Prometheus MySQL Exporter

$curl -s https://api.github.com/repos/prometheus/mysqld_exporter/releases/latest   | grep browser_download_url   | grep linux-amd64 | cut -d '"' -f 4   | wget -qi -
$tar xvf mysqld_exporter*.tar.gz
$sudo mv  mysqld_exporter-*.linux-amd64/mysqld_exporter /usr/local/bin/
$sudo chmod +x /usr/local/bin/mysqld_exporter

2. Create Prometheus Exporter Database User to Access the Database, Scrape Metrics & Provide Grants

CREATE USER 'mysqld_exporter'@'<PrometheusHostIP>' IDENTIFIED BY 'StrongPassword' WITH MAX_USER_CONNECTIONS 2;
GRANT PROCESS, REPLICATION CLIENT, SELECT ON *.* TO 'mysqld_exporter'@'<PrometheusHostIP>';
FLUSH PRIVILEGES;
EXIT

WITH MAX_USER_CONNECTIONS 2 is used to set a max connection limit for the user to avoid overloading the server with monitoring scrapes under heavy load.

3. Configure the Database Credentials

Edit the config file of the exporter:

$sudo vim /etc/.mysqld_exporter.cnf

Add the username and password of the user created and the ScaleGrid MySQL server you want to monitor:

$sudo vim /etc/.mysqld_exporter.cnf

[client]
user=mysqld_exporter
password=StrongPassword
host=SG-mysqltestcluster-123456.servers.mongodirector.com

Set ownership permissions:

$sudo chown root:prometheus /etc/.mysqld_exporter.cnf

4. Create systemd Unit File

Create a new service file:

$sudo vim /etc/systemd/system/mysql_exporter.service

Add the following content:

 [Unit]
 Description=Prometheus MySQL Exporter
 After=network.target
 User=prometheus
 Group=prometheus

 [Service]
 Type=simple
 Restart=always
 ExecStart=/usr/local/bin/mysqld_exporter \
 --config.my-cnf /etc/.mysqld_exporter.cnf \
 --collect.global_status \
 --collect.info_schema.innodb_metrics \
 --collect.auto_increment.columns \
 --collect.info_schema.processlist \
 --collect.binlog_size \
 --collect.info_schema.tablestats \
 --collect.global_variables \
 --collect.info_schema.query_response_time \
 --collect.info_schema.userstats \
 --collect.info_schema.tables \
 --collect.perf_schema.tablelocks \
 --collect.perf_schema.file_events \
 --collect.perf_schema.eventswaits \
 --collect.perf_schema.indexiowaits \
 --collect.perf_schema.tableiowaits \
 --collect.slave_status \
 --web.listen-address=0.0.0.0:9104
 
 [Install]
 WantedBy=multi-user.target

web.listen-address=0.0.0.0:9104 specifies that the server is listening on port 9104. If your server has a public and private network, you may need to replace 0.0.0.0:9104 with private IP, for example – 192.168.4.5:9104.

When done, reload systemd and start mysql_exporter service:

$sudo systemctl daemon-reload
$sudo systemctl enable mysql_exporter
$sudo systemctl start mysql_exporter

5. Configure MySQL Endpoint to be Scraped by Prometheus

Make changes like below to the prometheus.yml file:

scrape_configs:
- job_name: mysql_server1
static_configs:
- targets: ['localhost:9104']
labels:
alias: db1

Note: If the exporter is not running on the same host as Prometheus, provide the IP address of the server instead of localhost. 9104 refers to the port Prometheus listens to, as specified in the previous step.

Monitoring Multiple MySQL Hosts From a Central Prometheus Host

Multiple MySQL servers can be monitored from a central server. This can be achieved by having a separate exporter service for each server. Make sure to create .mysqld_exporter.cnf and mysql_exporter.service (with unique port numbers assigned to the –web.listen-address flag) files for each service as mentioned in steps 3 and 4 above. Add targets to the prometheus.yml file as mentioned in step 5 above. Job names should be unique for each target. For example:

scrape_configs:
- job_name: mysql_server1
static_configs:
- targets: ['localhost:9104']
labels:
alias: db1
- job_name: mysql_server2
static_configs:
- targets: ['localhost:9105']
labels:
alias: db2
- job_name: mysql_server3
static_configs:
- targets: ['localhost:9106']
labels:
alias: db3

Note: Prometheus Server should be able to reach the targets over the network. Ensure that your network/firewall configurations have been modified accordingly.

Installing Grafana & Creating Dashboards

Grafana uses Prometheus as a data source, allowing you to create dashboards to better visualize and understand your metrics. It provides a great way to gain insight into your time series data.

Follow the below steps to install Grafana on your central Prometheus host.

1. Download the Latest Grafana Version

Go the the Download Grafana page to download the latest version.

$wget <debian package url>
$sudo apt-get install -y adduser libfontconfig1
$sudo dpkg -i grafana_<version>_amd64.deb

2. Download APT Repository & Install Grafana

The command add-apt-repository isn’t a default app on Debian 9 and requires:

$apt-get install -y software-properties-common

Install the repository for stable releases:

$sudo add-apt-repository "deb https://packages.grafana.com/oss/deb stable main"

There is a separate repository if you want beta releases:

$sudo add-apt-repository "deb https://packages.grafana.com/oss/deb beta main"

Use the above line even if you are on Ubuntu or another Debian version. Then add our gpg key. This allows you to install signed packages:

$wget -q -O - https://packages.grafana.com/gpg.key | sudo apt-key add -

Update your Apt repositories and install Grafana:

$sudo apt-get update
$sudo apt-get install grafana

3. Start the Service

$systemctl daemon-reload
$systemctl start grafana-server
$systemctl status grafana-server

Enable the systemd service so that Grafana starts at boot:

$sudo systemctl enable grafana-server.service

To run Grafana, open your browser and go to *http://<PrometheusHostIP>:3000/*. 3000 is the http port that Grafana listens to, by default.

4. Adding a Data Source

When installed, login to admin dashboard and add a data source by navigating to Configuration > Data Sources.

Name: Prometheus
Type: Prometheus
URL: http://localhost:9090

Note: If Prometheus server is not running on the same host as Grafana, provide the IP address of the server instead of localhost.

Installing Grafana & Creating Dashboards for MySQL - Add a Data Source

You are now all set to create and customize dashboards for your MySQL monitoring. You can create a new dashboard by clicking on the link on the right side of the dashboard picker. Once the dashboard is created, you can add panels choosing the metrics to be displayed, star the dashboard, save and share it. For detailed instructions, you can refer to Grafana’s Getting Started documentation.

Here’s an example of a Grafana dashboard created for a MySQL deployment at ScaleGrid:

Grafana MySQL Dashboard - MySQL Table Locks, Temporary Objects, Sorts and Select Types

The above Grafana dashboard displays MySQL Table Locks, MySQL Temporary Objects, MySQL Sorts, and MySQL Select Types metrics visualized in the charts, and the below Grafana dashboard displays MySQL Basic Command Counters and MySQL Top Command Counters Hourly.

Grafana MySQL Dashboard - MySQL Basic Command Counters and Top Command Counters Hourly

We are always looking to make our users lives easier, so let us know of any other tools you’d like to connect to your ScaleGrid deployments through our comments or via Twitter at @scalegridio.

Learn More About MySQL Hosting

Comment on Add,Edit and Delete Record using Bootgrid , PHP and MySQL by Alex kab

$
0
0

Hello, i’m one of your followers. Thank you for your tutorials.
I’m trying to build a table with bootgrid based on your example ”simple bootsgrid, add, edit”, i would resize columns at my own width but it’s don’t work. Please can you help me? How can i do it?

Comment on Exporting Data to Excel with PHP and MySQL by mamta

$
0
0

can we add particular columns and rows value in excel file using php


Comment on Exporting Data to Excel with PHP and MySQL by Parvez

Comment on Add,Edit and Delete Record using Bootgrid , PHP and MySQL by Parvez

PMM 2.2 Released with Full Support for Amazon RDS and Aurora

$
0
0
Percona Monitoring and Management 2.2 Amazon RDS and Aurora

Percona Monitoring and Management 2.2 (PMM) was released on December 24th with new features and updates designed to help you more easily manage and monitor your open source databases across your multi-cloud and hybrid-cloud environments. Let’s take a look at a few of the most interesting ones.   

Full Support for AWS RDS for MySQL/MariaDB and AWS Aurora MySQL-Based Instances

We have added full support for AWS RDS for MySQL, AWS RDS for MariaDB, and AWS Aurora MySQL instances so that you no longer have to add them as remote instances (although you still have this option). To do this, you can run discovery on your AWS account and see the list of supported RDS instances to be added for monitoring.

AWS RDS for MySQL/MariaDB

AWS Aurora MySQL

Additionally, you can use alternative partitions for discovery like Gov or China partitions. You can read more on how to do this in the Percona Monitoring and Management FAQ.  

After discovery, you use the same familiar UI to add RDS instances to be monitored. 

Once you’ve added your instances you’ll get them monitored for MySQL and RDS metrics sourced from the AWS CloudWatch service API. For more, read how to properly set the parameters on the AWS side

Once this has all been done, you’ll see a lot more detailed information about your RDS instances in the PMM dashboards.

 MySQL Amazon Aurora

PMM Node Summary

New Settings Page

PMM Settings

We have also added the capability to configure your PMM server parameters via the UI (not just via API).  The new PMM Settings UI provides you with the ability to change the following:

PMM Settings UI

  • Metrics Resolution from Low to High. This will adjust how often data will be collected from your services.   
  • Data Retention is defining the time period of how long data will be kept in PMM and when it will be deleted. It’s 30 days by default.  
  • You can turn ON/OFF the Call Home and Updates. These options allow you to get information from Percona about a new version of PMM and be able to update your server from the Home dashboard Update widget.  
  • You can now upload your own SSH key enabling you to log in to virtual appliances externally. (primarily for use with our OVF distribution, while also useful for AWS Marketplace deployments) For more details, please visit PMM Server as a Virtual Appliance.
      

There is also a section where you can download diagnostics data to simplify troubleshooting PMM issues. By pressing the button you’ll get an archive with logs and config files from your PMM Server. Make sure you add this archive when you report PMM bugs in Jira for Percona. 

User Interface Improvements

We have improved the Query Analytics page enabling you to be able to see all of the labels in your system and have provided the capability to select multiple items for filtering. 

PMM improved the Query Analytics

  • We upgraded to Granafa v6.5.1 so you can leverage the latest available features. 
  • On some dashboards, like MySQL Services Overview, we added drill-down lists to let you click on some values on the Graph and easily transition to the related dashboard. For example about Mysql Service or Node Summary:  

MySQL Sorts

Finally, we turned on an additional data collection point that will be available once you update your pmm2-client package:

  • Activated ‘hwmon‘ metrics to expose hardware monitoring and sensor data from /sys/class/hwmon/. While these are not presented by default in any dashboards, they are available for you to use in your own dashboards.

PMM 2.2 Can Now be Deployed on VMWare, VirtualBox, and Will be Available Soon on the AWS Marketplace  

Customers can now deploy PMM 2.2 on the latest versions of VMWare (vSphere and ESXi) and Virtual box using our OVF images which are available at our PMM Download page.  Just select  “Software” = “Virtual Appliance OVF”  and you’ll get the link for the OVA file. 

download percona monitoring and management

PMM 2.2 is now available on Amazon AWS Marketplace.  More details to help you get started will be coming soon.

For a full list of new features and bug fixes included in PMM 2.2, see our release notes and for more information on Percona Monitoring and Management, visit our PMM webpage.

Tips for Delivering MySQL Database Performance - Part One

$
0
0

The database backend affects the application, which can then impact organizational performance. When this happens, those in charge tend to want a quick fix. There are many different roads to improve performance in MySQL. As a very popular choice for many organizations, it's pretty common to find a MySQL installation with the default configuration. This might not, however, be appropriate for your workload and setup needs.

In this blog, we will help you to better understand your database workload and the things that may cause harm to it. Knowledge of how to use limited resources is essential for anyone managing the database, especially if you run your production system on MySQL DB.

To ensure that the database performs as expected, we will start with the free MySQL monitoring tools. We will then look at the related MySQL parameters you can tweak to improve the database instance. We will also take a look at indexing as a factor in database performance management. 

To be able to achieve optimal usage of hardware resources, we’ll take a look into kernel optimization and other crucial OS settings. Finally, we will look into trendy setups based on MySQL Replication and how it can be examined in terms of performance lag. 

Identifying MySQL Performance Issues

This analysis helps you to understand the health and performance of your database better. The tools listed below can help to capture and understand every transaction, letting you stay on top of its performance and resource consumption.

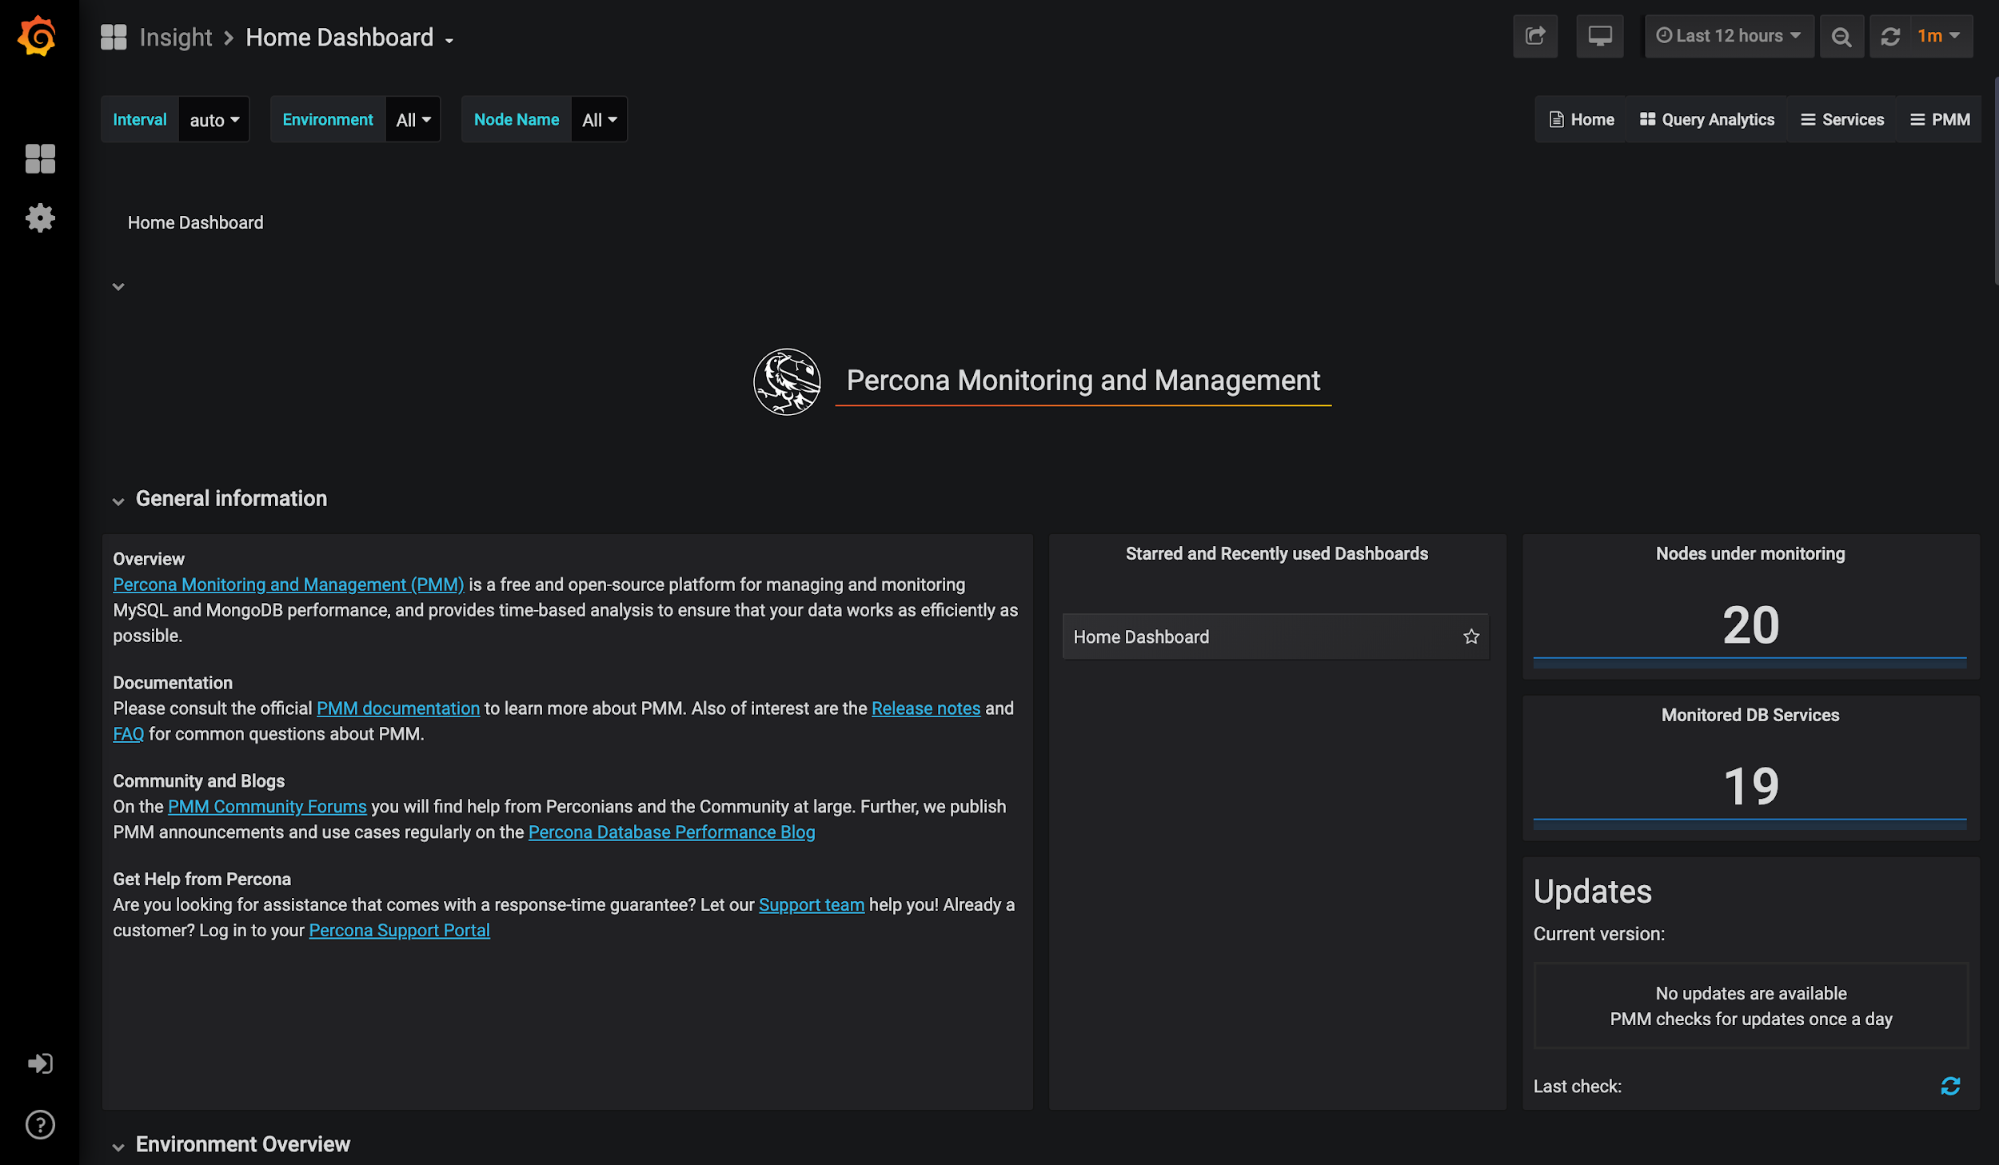
PMM (Percona Monitoring and Management)

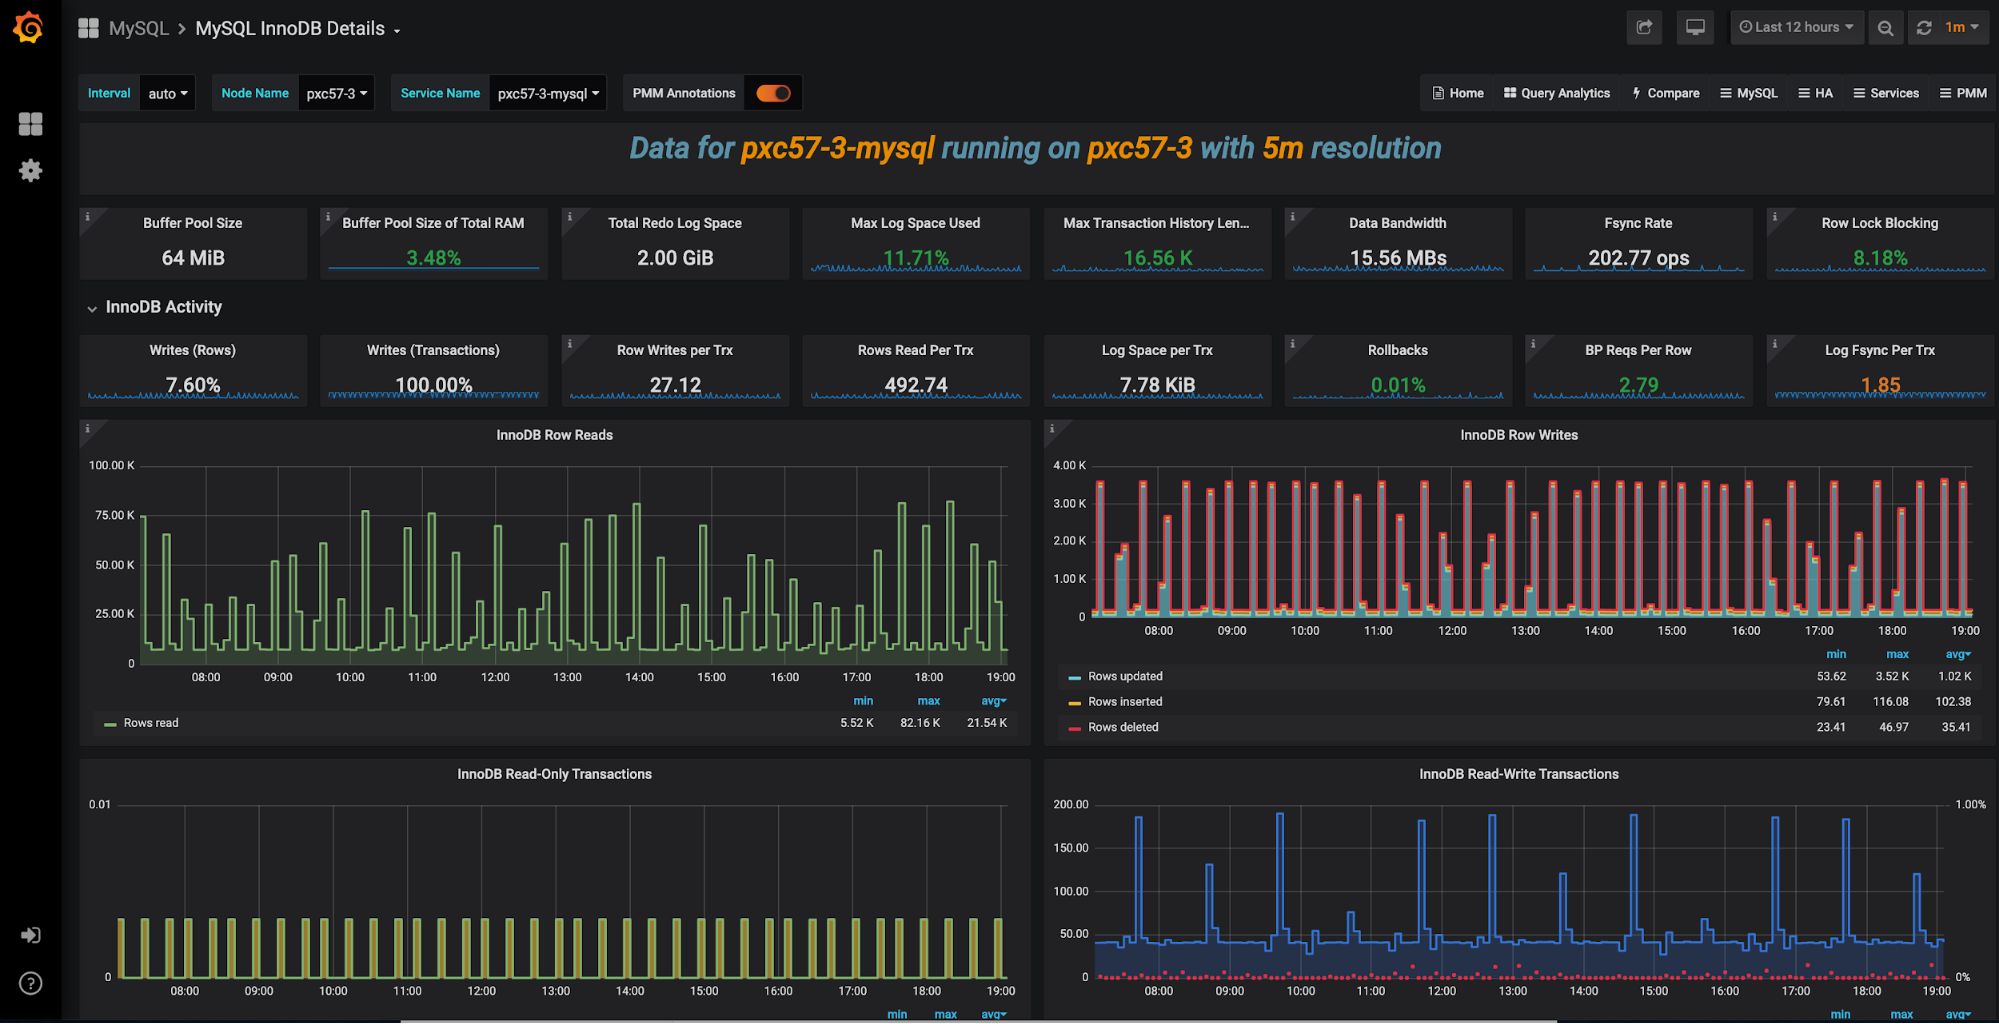
Percona Monitoring and Management tool is an open-source collection of tools dedicated to MySQL, MongoDB, and MariaDB databases (on-premise or in the cloud). PPM is free to use, and it's based on the well known Grafana and Prometheus time series DB. It Provides a thorough time-based analysis for MySQL.  It offers preconfigured dashboards that help to understand your database workload.

PMM uses a client/server model. You'll have to download and install both the client and the server. For the server, you can use Docker Container. It's as easy as pulling the PMM server docker image, creating a container, and launching PMM.

Pull PMM Server Image

docker pull percona/pmm-server:2

2: Pulling from percona/pmm-server

ab5ef0e58194: Downloading  2.141MB/75.78MB

cbbdeab9a179: Downloading  2.668MB/400.5MB

Create PMM Container

docker create \

   -v /srv \

   --name pmm-data \

   percona/pmm-server:2 /bin/true

Run Container

docker run -d \

   -p 80:80 \

   -p 443:443 \

   --volumes-from pmm-data \

   --name pmm-server \

   --restart always \

   percona/pmm-server:2

You can also check how it looks without an installation. A demo of PMM is available here.

Another tool that is part of PMM tools set is Query Analytics (QAN). QAN tool stays on top of the execution time of queries. You can even get details of SQL queries. It also gives a historical view of the different parameters that are critical for the optimal performance of a MySQL Database Server. This often helps to understand if any changes in the code could harm your performance. For example, a new code was introduced without your knowledge.  A simple use would be to display current SQL queries and highlight issues to help you improve the performance of your database.

PMM offers point-in-time and historical visibility of MySQL database performance. Dashboards can be customized to meet your specific requirements. You can even expand a particular panel to find the information you want about a past event.

Free Database Monitoring with ClusterControl

ClusterControl provides real-time monitoring of the entire database infrastructure. It supports various database systems starting with MySQL, MariaDB, PerconaDB, MySQL NDB Cluster, Galera Cluster (both Percona and MariaDB), MongoDB, PostgreSQL and TimescaleDB. The monitoring and deployment modules are free to use.

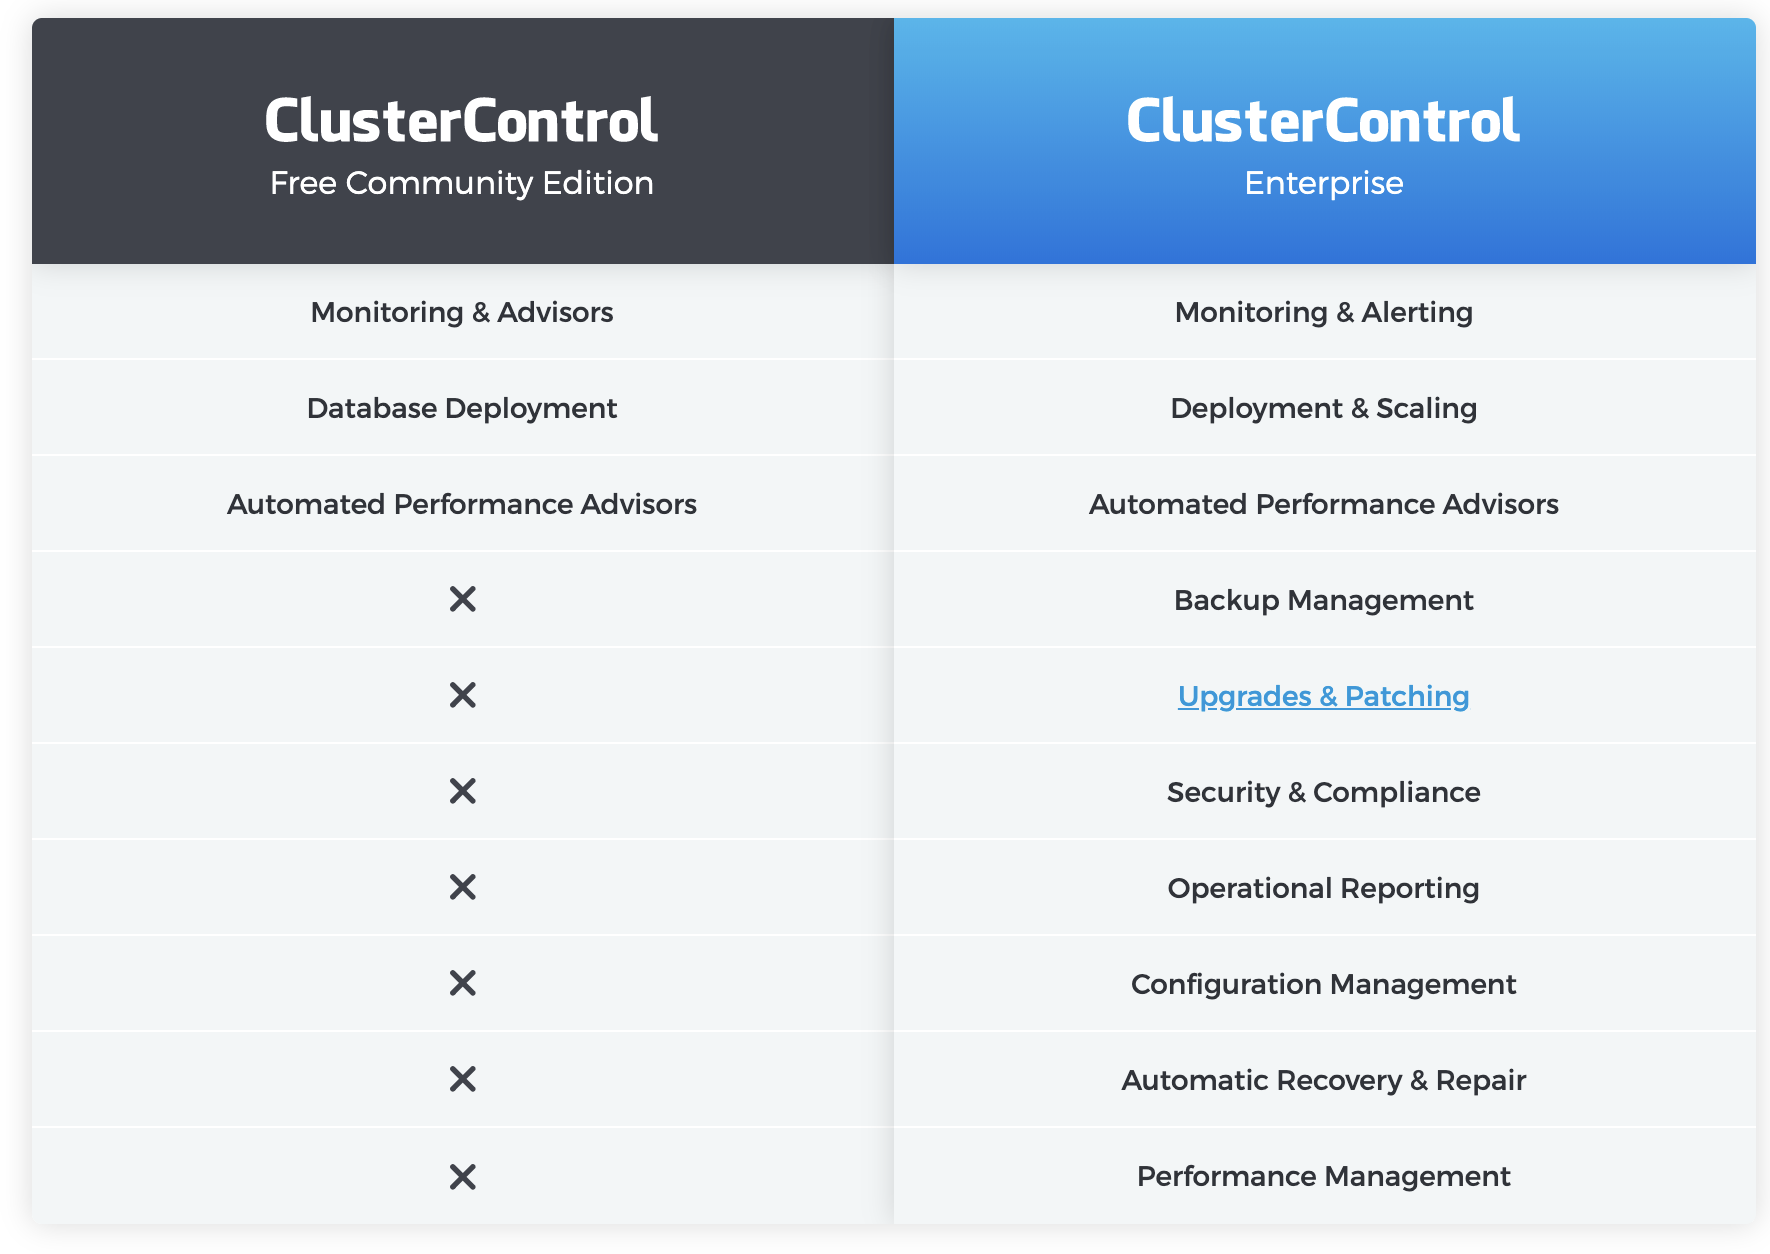
ClusterControl consists of several modules. In the free ClusterControl Community Edition we can use:

Performance advisors offer specific advice on how to address database and server issues, such as performance, security, log management, configuration, and capacity planning. Operational reports can be used to ensure compliance across hundreds of instances. However, monitoring is not management. ClusterControl has features like backup management, automated recovery/failover, deployment/scaling, rolling upgrades, security/encryption, load balancer management, and so on.

Monitoring & Advisors

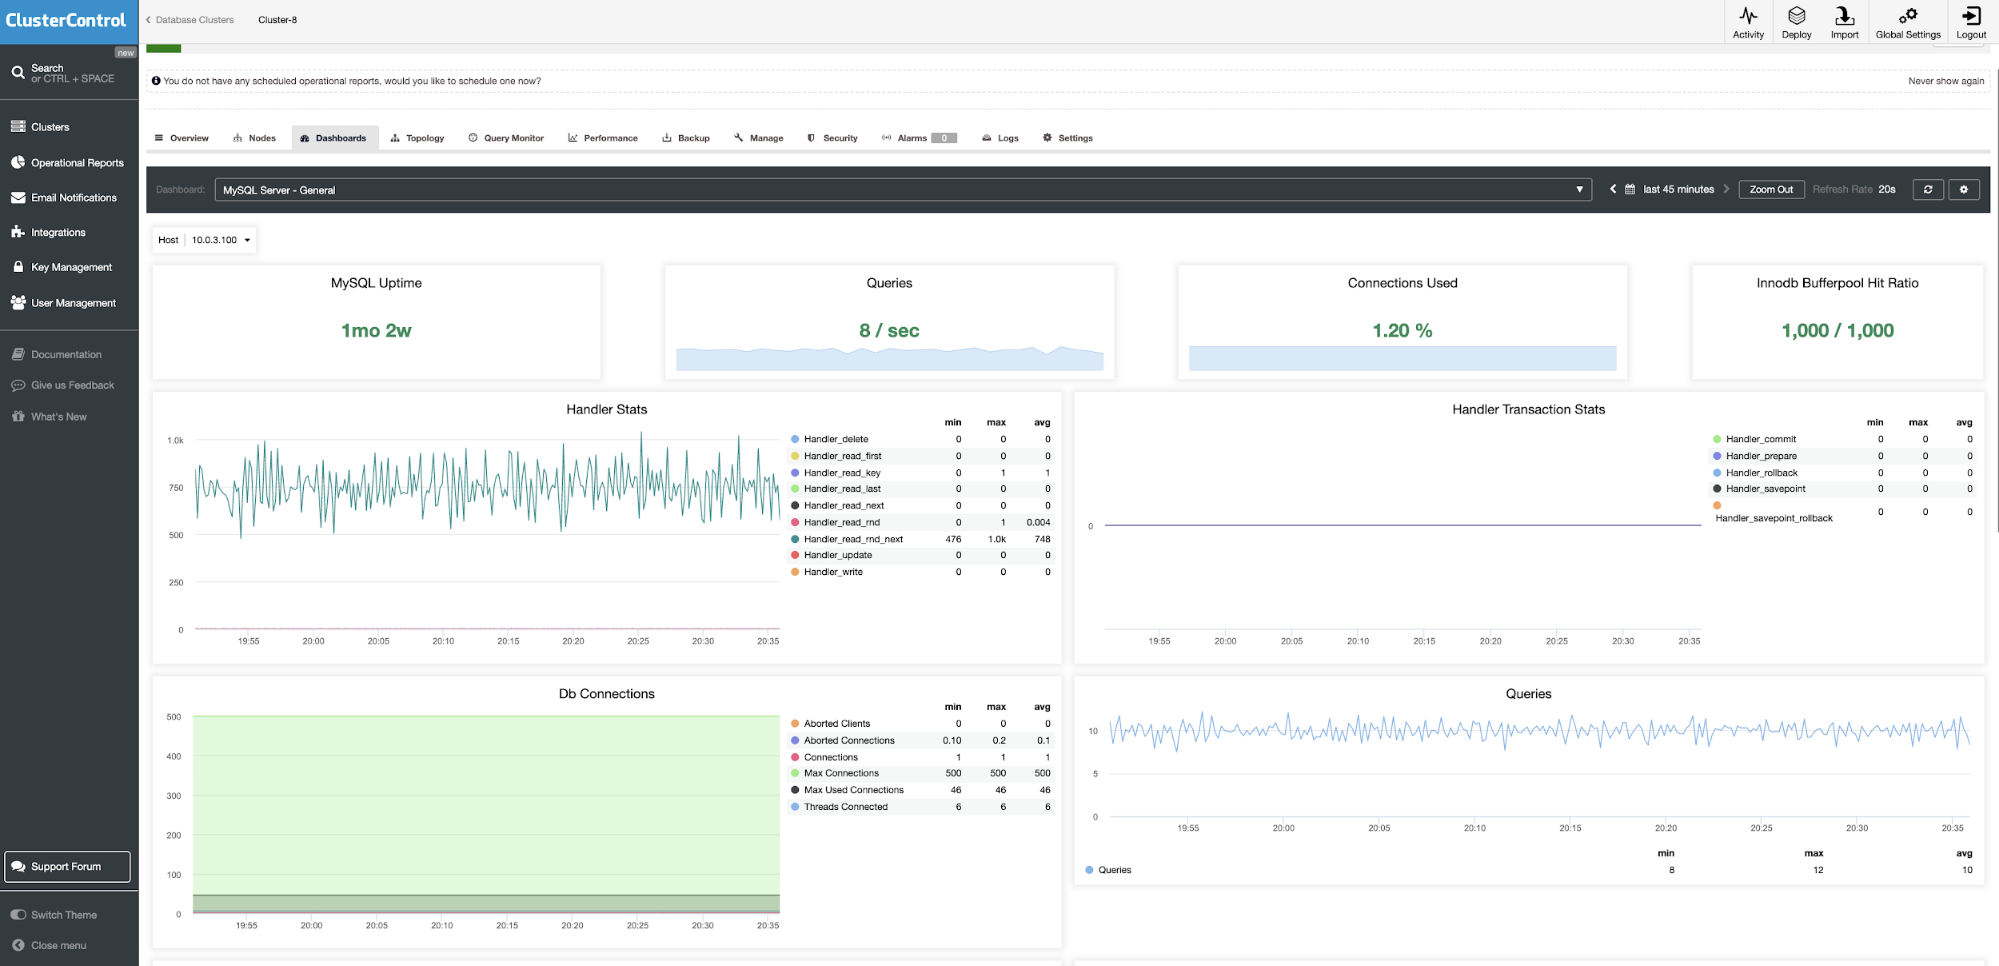
The ClusterControl Community Edition offers free database monitoring which provides a unified view of all of your deployments across data centers and lets you drill down into individual nodes. Similar to PMM we can find dashboards based on real-time data. It’s to know what is happening now, with high-resolution metrics for better accuracy, pre-configured dashboards, and a wide range of third-party notification services for alerting.

On-premises and cloud systems can be monitored and managed from one single point. Intelligent health-checks are implemented for distributed topologies, for instance, detection of network partitioning by leveraging the load balancer’s view of the database nodes.

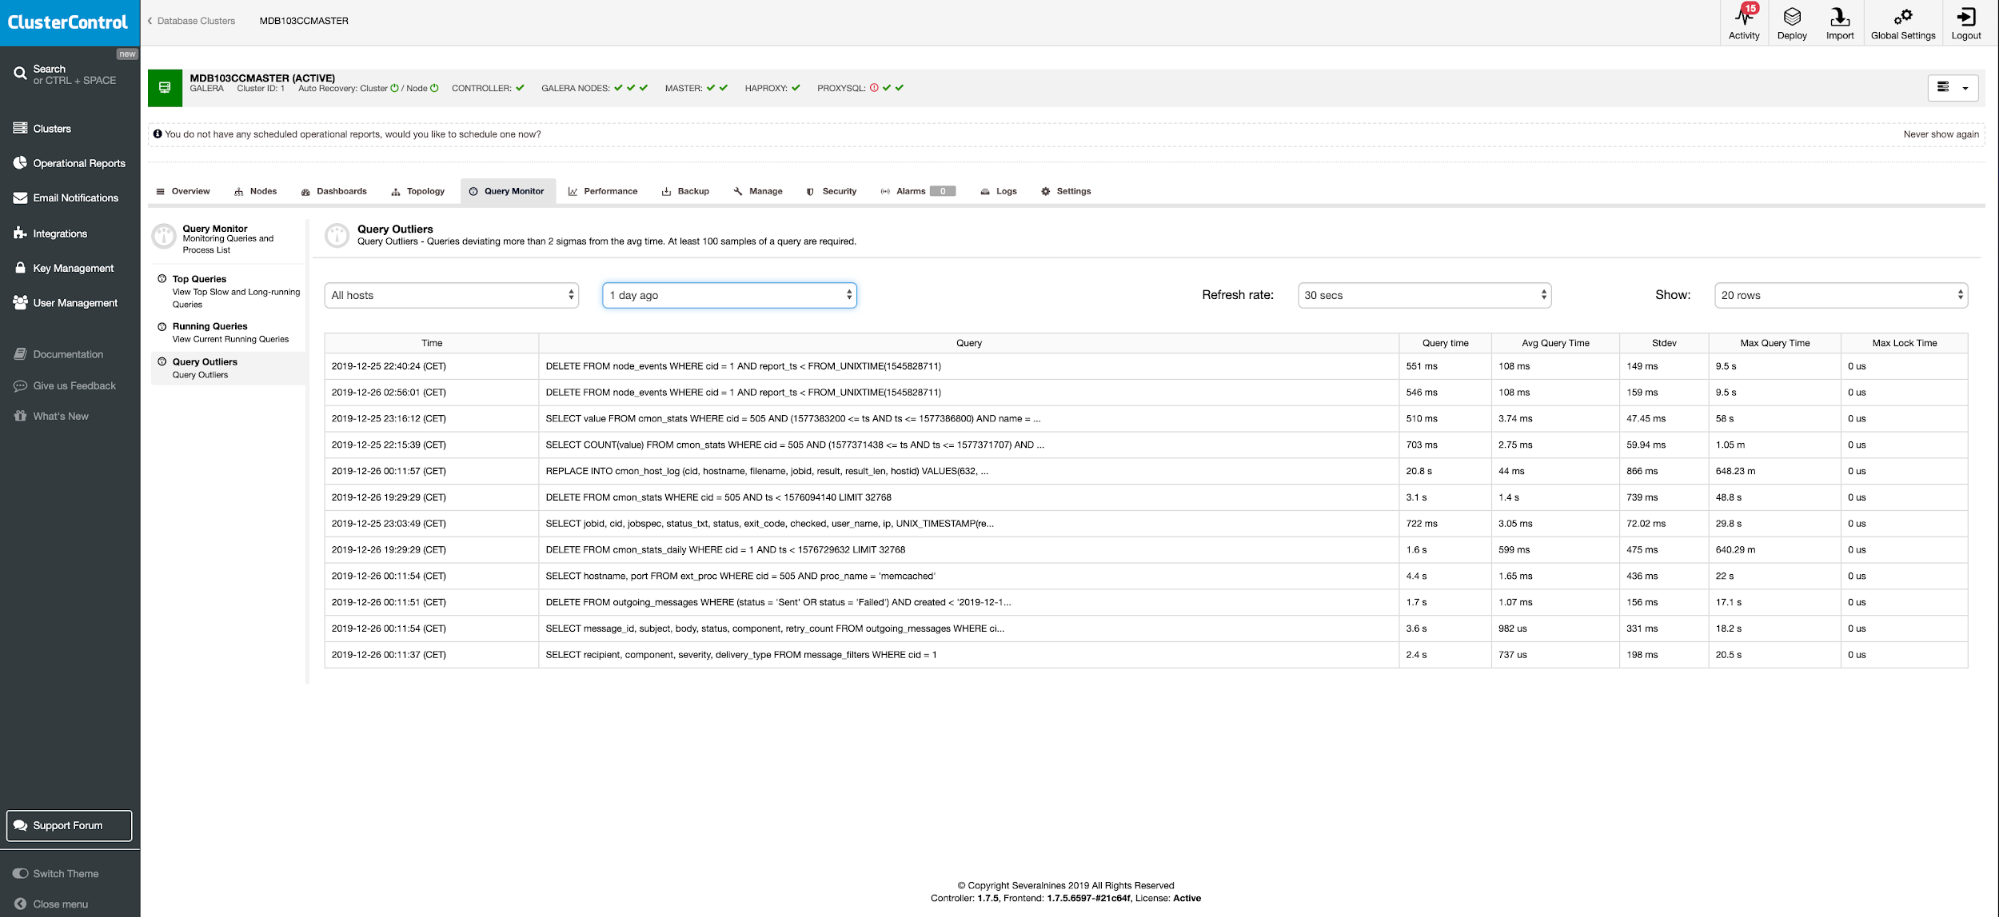
ClusterControl Workload Analytics in one of the monitoring components which can easily help you to track your database activities. It provides clarity into transactions/queries from applications. Performance exceptions are never expected, but they do occur and are easy to miss in a sea of data. Outlier discovery will get any queries that suddenly start to execute much slower than usual. It tracks the moving average and standard deviation for query execution times and detects/alerts when the difference between the value exceeds the mean by two standard deviations. 

As we can see from the below picture, we were able to catch some queries that in between one day tend to change execution time on a specific time. 

To install ClusterControl click here and download the installation script. The install script will take care of the necessary installation steps. 

You should also check out the ClusterControl Demo to see it in action.

You can also get a docker image with ClusterControl.

$ docker pull severalnines/clustercontrol

For more information on this, follow this article.

MySQL Database Indexing

Without an index, running that same query results in a scan of every row for the needed data. Creating an index on a field in a table creates extra data structure, which is the field value, and a pointer to the record it relates to. In other words, indexing produces a shortcut, with much faster query times on expansive tables. Without an index, MySQL must begin with the first row and then read through the entire table to find the relevant rows. 

Generally speaking, indexing works best on those columns that are the subject of the WHERE clauses in your commonly executed queries.

Tables can have multiple indexes. Managing indexes will inevitably require being able to list the existing indexes on a table. The syntax for viewing an index is below.

To check indexes on MySQL table run:

SHOW INDEX FROM table_name;

Since indices are only used to speed up the searching for a matching field within the records, it stands to reason that indexing fields used only for output would be simply a waste of disk space. Another side effect is that indexes may extend insert or delete operations, and thus when not needed, should be avoided.

MySQL Database Swappiness

On servers where MySQL is the only service running, it’s a good practice to set vm.swapiness = 1. The default setting is set to 60 which is not appropriate for a database system.

vi /etc/sysctl.conf
vm.swappiness = 1

Transparent Huge Pages

If you are running your MySQL on RedHat, make sure that Transparent Huge Pages is disabled.

This can be checked by command:

cat /proc/sys/vm/nr_hugepages
0

(0 means that transparent huge pages are disabled.)

MySQL I/O Scheduler 

In most distributions noop or deadline I/O schedulers should be enabled by default. To check it run

cat /sys/block/sdb/queue/scheduler 

MySQL Filesystem Options

It’s recommended to use journaled file systems like xfs, ext4 or btrfs. MySQL works fine with all that of them and the differences more likely will come with supported maximum file size.

  • XFS (maximum filesystem size 8EB, maximum file size 8EB)
  • XT4 (maximum filesystem size 8EB, maximum file size 16TB)
  • BTRFS (maximum filesystem size 16EB, maximum file size 16EB)

The default file system settings should apply fine.

NTP Deamon

It’s a good best practice to install NTP time server demon on database servers. Use one of the following system commands.

#Red Hat
yum install ntp
#Debian
sudo apt-get install ntp

Conclusion

This is all for part one. In the next article, we will continue with MySQL variables operating systems settings and useful queries to gather database performance status. 

MySQL 8 Group Replication Limitations

$
0
0

Understanding MySQL 8.0 Group Replication Limitations to build an highly reliable MySQL Infrastructure Operations 


Introduction – Redundant and fault-tolerant database systems

Most of our customers. are 24*7 internet properties and their applications ( i.e. entire business operations) rely heavily on availability of respective database systems nodes, These systems going unavailable cause serious impact on reputation, customer experience and revenue. To ensure business continuity under foreseeable and unforeseeable man-made or natural disasters, the database system has to be designed and built with fault tolerance and disaster recovery capabilities, in other words the component can be removed and the system should continue to operate as expected. High availability refers to the characteristics of a system that allow the system to sustain continuous operation in the event of hardware and software failures due to natural or man made causes (Webb, 2008).

The availability of system is normally defined as (Marcus, 2003): –  A= MTBF / MTBF + MTTR

Where A is system availability, MTBF is the mean time between failures, and MTTR is the mean time to recover the system. From the formula for system availability, it can be derived that when MTTR approaches zero (i.e., system down time is substantially short), availability (A) increases toward 100 percent. On the other hand, when MTBF gets larger (i.e., system down time occurs very rarely), MTTR has less impact on A. Therefore, the goal of system high availability is to make MTTR as small as possible and MTBF as large as possible.

How MySQL 8.0 Group Replication works ?

  • MySQL Group Replication is a plugin (first released with MySQL 5.7 Server) which can provide virtually synchronous replication, with built-in conflict detection / handling and consistency guarantee, So the individual machines and/or MySQL instances can fail or be taken offline for maintenance while the distributed MySQL service continues to operate and handle application traffic.
  • MySQL Group Replication is based on a Paxos implementation, which ensures that all servers receive the same set of data in the same order. There is a built-in group membership service that keeps the view of the group consistent and available for all servers at any given point in time. Servers can leave and join the group and the view is updated accordingly. Sometimes servers can leave the group unexpectedly, in which case the failure detection mechanism detects this and notifies the group that the view has changed. This is all automatic.
  • In MySQL Group Replication, For a transaction to commit, the majority of the group have to agree on the order of a given transaction in the global sequence of transactions. Deciding to commit or abort a transaction is done by each server individually, but all servers make the same decision. If there is a network partition, resulting in a split where members are unable to reach agreement, then the system does not progress until this issue is resolved. Hence there is also a built-in, automatic, split-brain protection mechanism.

MySQL 8.0 Group Replication Limitations

  • Maximum number of MySQL servers that can be the members of a single replication group is 9, Any further attempt made by adding more members will be refused. Functionally this appears very rational to us, Why add several MySQL instances to make the Group Replication infrastructure operationally complex ?
  • If you are operating Group Replication in multi-primary mode, The SELECT … FOR UPDATE statements can cause a deadlock, This is because the lock is not shared across the members of the group, therefore the expectation for such a statement might not be reached.
  • We cannot use  replication filters on Group Replication. Because, Filtering the transactions  on selected servers would make the group enabled  to reach agreement on consistent state. But, You can implement  replication filters on the replication channels that are not directly involved with  Group Replication

Handling Transaction Limit in MySQL Group Replication

  • Configure group_replication_transaction_size_limit system variable to control maximum transaction size the group will tolerate, The default value is approximately 143 MB (150000000 bytes). The time taken to process a transaction is proportional to its size.
  • Group Replication use compression algorithm LZ4 and it is enabled by default with threshold of 1000000 bytes (1 MB), You can tune this value by configuring the system variable group_replication_compression_threshold . We have copied below the steps to set a compression threshold:

STOP GROUP_REPLICATION;
SET GLOBAL group_replication_compression_threshold= 5242880;
START GROUP_REPLICATION; 

In the above script, We have set the compression threshold to 5MB. Now if a transaction generates a replication  message  more  than  5MB, i.e., the binary log  transaction entry is larger than 5MB, then it is compressed.

Note: You can disable the compression by setting threshold to “0

  • In Group Replication large messages are automatically fragmented. Because, When an abnormally large message is sent between Group Replication group members, it can result in some group members being reported as failed and expelled from the group. So large messages are automatically split into fragments that are sent separately and reassembled by the recipients. You can configure system variable  group_replication_communication_max_message_size ( default value is 10485760 bytes / 10 MiB ) to specify a message size above which messages are fragmented. This value cannot be larger than the system variable slave_max_allowed_packet , which is 1073741824 bytes (1 GB). You can switch off fragmentation by setting value “0” for group_replication_communication_max_message_size .

Note: In order for a replication group to use fragmentation, all group members must be at MySQL 8.0.16 or above

Conclusion

Group Replication definitely  is an off-the-shelf solution for building highly available, fault tolerant  and self-healing MySQL infrastructure operations. Even if some of the servers subsequently fail, as long it is not all or a majority, the system is still available. Depending on the number of servers which fail the group might have degraded performance or scalability, but it is still available. To conclude, MySQL Group Replication guarantees that the database service is continuously available.  But, When you are using such compelling solution for MySQL Reliability, It’s alway better to also discount limitations and tunable parameter for better performance. Thanks  for taking  time in reading this  blog and we welcome your comments.

References 

https://www.percona.com/blog/2017/08/01/group-replication-sweet-sour/ 

https://mysqlhighavailability.com/mysql-group-replication-a-quick-start-guide/ 

https://dev.mysql.com/doc/refman/8.0/en/group-replication-limitations.html

The post MySQL 8 Group Replication Limitations appeared first on The WebScale Database Infrastructure Operations Experts.

MyCLI: A MySQL CLI Based on Python with Auto-completion and Syntax Highlighting

$
0
0
If you prefer to work with MySQL via its command-line interface, you'll like mycli which is a CLI tool with auto-completion and syntax highlighting built on top of Python and prompt_toolkit for building interactive command line applications with Python. It is cross-platform and it is tested on Linux, MacOS and Windows. According to the official website: mycli is a command line interface for MySQL, MariaDB, and Percona with auto-completion and syntax highlighting. Prerequisites Python 2.7 or Python 3.4+. How to Install MyCLI? Supposed you have Python and pip installed, open a new terminal and run the following command: $ pip install mycli Check out the official website for instructions on how to install MyCLI on the other platforms. You can check the source code of this tool on GitHub.

Data Masking in Percona Server for MySQL to Protect Sensitive Data

$
0
0
Data Masking in Percona Server for MySQL

Data Masking in Percona Server for MySQLStarting with Percona Server for MySQL 8.0.17, Percona Server ships with a data masking plugin, using the same API as the MySQL Enterprise Masking and De-identification feature. This plugin was developed by Francisco Miguel Biete and was submitted to Percona Server as a community contribution. He also wrote an excellent post describing his contribution for Percona’s Community Blog titled Percona Server for MySQL 8.0 – New Data Masking Feature and the full list of functions can be found in the documentation of the MySQL Enterprise plugin.

What is Data Masking?

The data masking plugin mentioned above provides easy-to-use methods to hide sensitive data, such as social security numbers:

mysql> SELECT ssn, mask_ssn(ssn) FROM employees WHERE id = 1337;
+-------------+---------------+
| ssn         | mask_ssn(ssn) |
+-------------+---------------+
| 935-20-5725 | XXX-XX-5725   |
+-------------+---------------+
1 row in set (0.00 sec)

Or even to blacklist words contained in a dictionary, replacing them with randomly chosen replacements:

mysql> SELECT city, gen_blacklist(city, 'US_Cities', 'DE_Cities') FROM employees WHERE id = 1337;
+----------+-----------------------------------------------+
| city     | gen_blacklist(city, 'US_Cities', 'DE_Cities') |
+----------+-----------------------------------------------+
| Houston  | Berlin                                        |
+----------+-----------------------------------------------+
1 row in set (0.00 sec)

mysql> SELECT city, gen_blacklist(city, 'US_Cities', 'DE_Cities') FROM employees WHERE id = 1337;
+----------+-----------------------------------------------+
| city     | gen_blacklist(city, 'US_Cities', 'DE_Cities') |
+----------+-----------------------------------------------+
| Houston  | Essen                                         |
+----------+-----------------------------------------------+
1 row in set (0.00 sec)

Performance

An important question before using a plugin like this is its cost: How does it compare with a different approach? As the goal is hiding some data from the user, this approach could be:

  1. Not masking at the SQL-side at all, and implementing it completely in the program that uses the database
  2. Using existing functions and user functions in views/queries directly to achieve a similar result
  3. Adding masked columns, or masked tables, to the database

The runtime performance of selects in 1 and 3 are roughly the same: for 1, the masking performance is moved to the client program, not the SQL server. For 3, it happens during inserts. Both also have additional costs, as (1) requires changes in (all) client programs, and (3) increases the space requirements significantly.

The second option is only realistic for some of the features: for example, the SSN masking above could be implemented with the right substring and concatenation.

Masking Functions

Most functions provided by the plugin perform simple string replacement, such as the function that masks an SSN, credit card number, or simply a substring at the given positions. These have the same performance characteristic, for example, we can see the following numbers running sysbench tests using different SSN masking scenarios:

Implementation Queries per second
SELECT ssn (unmasked) 2503
SELECT mask_ssn(ssn) 2287
SELECT CONCAT(“XXX-XX-“, RIGHT(ssn, 4)) 2303

As this table shows, mask_ssn and manual string manipulation have similar performance, while if the plugin is loaded, the masking function is easier to use and maintain.

Replacement Functions

Some functions, however, operate on a list of strings, such as the already mentioned gen_blacklist. These lists use linear complexity algorithms in 8.0.17 and 8.0.18, and such are best suited for small dictionaries. Starting with 8.0.19, the algorithm is changed to a logarithmic complexity search, at the cost of increased dictionary loading cost. Since dictionaries are typically loaded once during the servers run but used many times, this reduces execution times with larger dictionaries.

With logarithmic search times, the performance of some dictionary sizes are shown in the table below:

Dictionary size Queries per second
0 (no blacklisting) 2506
10 2063
100 1885
200 1863
500 1731
1000 1558
1000 (100 matching) 1875

Note that while the search itself is logarithmic in complexity, the queries were all run on the same dataset: one million records, each randomly chosen from a dictionary of 5000 entries. In most rows in the table, not only the dictionary size is larger, but the blacklist function also finds more matches, resulting in more and more string replacement. As all items in the dictionary are from the dictionary used to generate the column, the smallest, 10 item dictionary only replaced 0.2% of the results, while with a size of 1000, it reached 20%. The test was kept this way as this is realistic – a larger dictionary usually results in more matches.

Also, the last entry showcases a dictionary where only 10% of the records are present in the actual table, showing the search performance against the other 1000 entry table.

Contributions

Percona Server welcomes contributions, both new features such as this plugin or bug fixes correcting existing issues. Patches should be submitted via a github pull request to the percona-server repository. Before submitting something, make sure to:

  1. Base the change on the branch of the lowest version that makes sense (5.6, 5.7, 8.0). For bug fixes, this generally means the earliest version where the issue can be found. For new features or improvements, it can be a higher version.
  2. Follow the coding style and conventions of the base version. For 8.0, the source code has a clang-format configuration file, and new changes should be formatted with clang-format-8. For 5.6 and 5.7, the code should be manually formatted similarly to the existing code; keep in mind that InnoDB and the rest of the server uses a different style!
  3. Only submit original work, or if the diff includes third party code (libraries, samples, etc.), make sure to keep the original copyright, and that the license is compatible with GPL.

After receiving the submission, a Percona Server developer will review it. This may take time, depending on the size of the patch. The reviewer is able to request changes before the pull request is merged or may change the code directly before merging.


MySQL Wins “DBMS of the Year” Award from DB-Engine

$
0
0

What a great way to start the New Year!  I woke up this morning to find in the news that MySQL won the DBMS of the year award for 2019.

MySQL is the database management system that gained more popularity in our DB-Engines Ranking within the last year than any of the other 350 monitored systems.
We thus declare 
MySQL as the DBMS of the Year 2019”, says DB-Engine.

Getting the highest popularity gain among over 350 monitored systems is really impressive but this could only happen because of you, the users of MySQL.  Thank you all for your ongoing support and your feedback to help us continue to make MySQL always better.

As for the method used for determining the winner every year, DB-Engine explained it this way “For determining the DBMS of the year, we subtracted the popularity scores of January 2019 from the latest scores of January 2020. We use the difference of these numbers, rather than a percentage, because that would favor systems with a tiny popularity at the beginning of the year. The result is a list of DBMSs sorted by how much they managed to increase their popularity in 2019, or in other words, how many additional people started to communicate about it in one of the ways we measure in our methodology, for example job offers, professional profile entries and citations on the web.”

For more information about DB-Engine’s DBMS of the year award, you can check their post at: https://db-engines.com/en/blog_post/83


Again, a BIG thank you to you all from the entire MySQL team!


And now is a good time to check out why #MySQL8isGreat!

Here are the MySQL 8.0 Top 10 Features:

1.  Hash Joins

2.  EXPLAIN Analyze

3.  Window Functions

4.  CTEs

5.  InnoDB Cluster

6.  InnoDB Clone

7.  Shell

8.  Roles

9. Data Dictionary

10. Document Store


Learn More about MySQL 8.0 at: https://www.slideshare.net/lefred.descamps/benefits-to-upgrade-to-mysql-80


MySQL Commercial Yum Repo Extended

$
0
0
Many things in the MySQL 8.0 Series has evolved. I’ve discussed many of those things in prior blogs such as items like the MySQL-Router w/InnoDB Cluster, plus a Series on Enterprise Backup with InnoDB Cluster Backup & Restore Use Cases. But now its time to update everyone on the evolution of the Yum Repo packaging… Read More »

Database Proxy for MySQL — Any New Kid on the Block?

$
0
0

A database proxy is a wonderful tool that is able to provide significant functionality across various use cases. For example, a seamless master role switch to another node for maintenance; transparency with read and write connections; or providing automatic, intelligent database load balancing.

In the MySQL world, these proxies provide a single entry point into MySQL databases for the calling client applications. Or put differently, the proxy is a middle layer sitting between a MySQL database and an application. The application connects to a proxy, which then forwards connections into the database.

Good proxies make MySQL database clusters appear like single databases by hiding the “behind-the-scenes-plumbing” from the application. One example of this allows a master failover to occur which “hides” the promotion of the new master from the client. These types of proxies can make a MySQL cluster appear as a simple MySQL database to applications even in complex topologies and can also provide read scaling optimizations at the same time.

This is of particular importance nowadays where high availability is a must and data is distributed across multiple instances, or remotely across multiple datacenters.

There are a number of MySQL database proxy alternatives available for users to evaluate and choose from including:

  • HAProxy: this is probably the best known database proxy for MySQL and has been popular with users for many years. “HAProxy is a free, very fast and reliable solution offering high availability, load balancing, and proxying for TCP and HTTP-based applications. It is particularly suited for very high traffic web sites and powers quite a number of the world’s most visited ones.” You can read more here: http://www.haproxy.org/#desc
  • ProxySQL: this is still a relatively new player in the MySQL proxy field, but has made great strides over the past few years, thanks to René Cannaò’s (its creator) efforts. It’s been quickly adopted within the MySQL community. ProxySQL is a high performance database proxy for MySQL with a GPL licence. You can read more here: https://www.proxysql.com
  • And there are more of course, such as MaxScale, NGINX and MySQL Router

ProxySQL has published a handy comparison of various proxies on their website that users can check out.

What most people don’t know or realise (including myself until I joined Continuent) is that there is another MySQL proxy in town … namely, Tungsten Proxy, known by Continuent customers as Tungsten Connector. It is in fact a MySQL proxy; and at Continuent, we like to refer to it as an ‘Intelligent Proxy for MySQL’.

While the Tungsten Connector proxy may be news to you, it really is not a new kid on the block. It has been an important part of the Continuent Tungsten Clustering solution since 2006 … But more on that in upcoming blogs!

Tungsten Proxy – The Intelligent MySQL Proxy – in a nutshell

  • Provides intelligent traffic routing to valid MySQL master(s), locally and globally
  • Scales read queries via query inspection and other methods
  • Application and active users do not disconnect during MySQL master failover events
  • Combined with another intelligent layer of Tungsten Clustering called Tungsten Manager, it provides automatic, rapid master failover for MySQL High Availability and automated cross-site level failover for Disaster Recovery

We’ll be talking about database proxies for MySQL more regularly in 2020, starting with a new introductory webinar on the topic. This will include some initial insights into Tungsten Proxy in addition to a step-by-step introduction to what database proxies (for MySQL) are and do.

Stay tuned – we look forward to more MySQL proxy discussions during 2020!

A First Look at Amazon RDS Proxy

$
0
0

At re:Invent in Las Vegas in December 2019, AWS announced the public preview of RDS Proxy, a fully managed database proxy that sits between your application and RDS. The new service offers to “share established database connections, improving database efficiency and application scalability”.

But one of the benefits that caught my eye is the ability to reduce the downtime in case of an instance failure and a failover. As for the announcement:Photo by Allie Smith on Unsplash

In case of a failure, RDS Proxy automatically connects to a standby database instance while preserving connections from your application and reduces failover times for RDS and Aurora multi-AZ databases by up to 66%”

You can read more about the announcement and the new service on the AWS blog but as the service is already available in public preview, it is time to give it a try.

What does “reduces failover times by 66%” mean and how can we test it?

According to the documentation:

“Failovers, as defined by the interval between the detection of the failure on the primary and the resumption of transactions on the standby, typically complete within one to two minutes. Failover time can also be affected by whether large uncommitted transactions must be recovered; the use of adequately large instance types is recommended with Multi-AZ for best results. “

So I decided to perform a simple test, using only two terminals, a MySQL client and a while loop in Bash: I wanted to check what happens when I trigger a forced failover (reboot with failover) on a Multi AZ RDS instance running MySQL 5.7.26 behind a RDS Proxy.

The simplest test

I created a new proxy “test-proxy” that pointed to a m5.large Multi AZ “test-rds” instance. And I set the idle client connection timeout to 3 minutes, a value that should allow us to avoid dropping connections given the expected failover time on the RDS instance.

Creating RDS Proxy

And after a few minutes I was ready to go. I started two while loops against the proxy and against the instance, each retrieving current time from MySQL:

$ while true; do mysql -s -N -h test-proxy.proxy-cqz****wmlnh.us-east-1.rds.amazonaws.com -u testuser -e "select now()"; sleep 2; done

$ while true; do mysql -s -N -h test-rds.cqz****wmlnh.us-east-1.rds.amazonaws.com -u testuser -e "select now()"; sleep 2; done

Acknowledged, this is a pretty basic and limited approach, but one that can quickly provide a feeling of how the RDS proxy performs during a forced failover.

test-rds instance

2019-12-16 18:45:48
2019-12-16 18:45:50
2019-12-16 18:45:52
2019-12-16 18:45:54
(...)

test-proxy proxy

2019-12-16 18:45:48
2019-12-16 18:45:50
2019-12-16 18:45:52
2019-12-16 18:45:54
(...)

Which terminal was going to be the winner and have the smallest gap in the time once I triggered the reboot with failover?

aws rds reboot-db-instance --db-instance-identifier test-rds --force-failover

Let’s see the results.

test-rds instance

(...)
2019-12-16 18:47:31
2019-12-16 18:47:33 
2019-12-16 18:49:44
2019-12-16 18:49:46
(...)

test-proxy proxy

(...)
2019-12-16 18:47:31
2019-12-16 18:47:33
2019-12-16 18:47:56
2019-12-16 18:47:58
(...)

From a delay of 129 seconds for the “test-rds” instance to 21 seconds for the proxy, it is quite a significant difference. Even better than the advertised 66%. I performed the test a couple of more times to make sure the result was not a one off, but the numbers are pretty consistent and the gap was always significant.

Main limitations and caveats

As of today, RDS Proxy is in public preview and available for RDS MySQL (MySQL 5.6 and MySQL 5.7) and Aurora MySQL . There is currently no support for RDS PostgreSQL or Aurora PostgreSQL. And it’s important to note: there is as yet no opportunity to change the instance size or class once the proxy has been created. That means it cannot be used to reduce downtime during a vertical scaling of the instance, which would be one of the main scenarios for the product.

You can still trigger a modifying instance on the Multi AZ RDS but the proxy will then not be able to recover after a scaling operation. It will still be there but will only provide a “MySQL server has gone away” message.

ERROR 2006 (HY000) at line 1: MySQL server has gone away
ERROR 1105 (HY000) at line 1: Unknown error
ERROR 2006 (HY000) at line 1: MySQL server has gone away

That is actually expected. As per the documentation:

“Currently, proxies don’t track any changes to the set of DB instances within an Aurora DB cluster. Those changes include operations such as host replacements, instance renames, port changes, scaling instances up or down, or adding or removing DB instances.”

You can find all the current limitations here.

What about costs?

Compared to other more convoluted AWS models, the pricing structure of RDS Proxy is actually simple: you pay a fixed hourly amount ($0.015 in us-east-1) per vCPU of the underlying database instance, regardless of instance class or other configurations. The larger the instance running behind the Proxy, the higher the price.

How is that going to affect your overall RDS costs?

Let’s take two popular instances t3.small (1vCPU) and m5.large (2 vCPU): the cost of the Proxy is about 12 USD and 24 USD per month. That is about 8% on top of cost of the Multi AZ instance for the m5.large, and over 20% for the t3.small.

Of course, as you are likely preserving connections, you might be able to absorb the cost of the proxy itself by running a smaller instance, but that might not be always the case.

Note that as per the current documentation, the Amazon RDS Proxy preview was free until the end of 2019 only.

To recap, RDS Proxy is a new service by Amazon and still in preview but the results in term of reduced failover times are really promising. On top of providing a simpler layer to handle database connections for serverless architectures.

The content in this blog is provided in good faith by members of the open source community. Percona has not edited or tested the technical content. Views expressed are the authors’ own. When using the advice from this or any other online resource test ideas before applying them to your production systems, and always secure a working back up.


Photo Allie Smith on Unsplash

The post A First Look at Amazon RDS Proxy appeared first on Percona Community Blog.

It is all about the constant factors

$
0
0
Assuming I put performance bugs I worked on into one of three buckets -- too much big-O, too much constant factor and other -- then too much big-O would have the fewest entries. Maybe we worry too much about big-O and not enough about everything else? This post is inspired by a post and tweet by Dan Luu.

By too much big-O I mean using an algorithm with more computational complexity when one with less is available and the difference causes problems in production. A common problem is using an O(n^2) algorithm when O(nlgn) or O(n) are possible. By too much constant factor I mean an inefficient implementation. Everything else goes into the other bucket.

It is all about the constant factors was a reply to someone who dismissed performance concerns with it is just a constant factor. That still amuses me. I assume that too much big-O is the least likely cause of performance problems given my classification scheme. This is not a rigorous study but I wasn't able to find many too much big-O bugs from my bug history. The search is complicated because it isn't easy to search for O(n*n). What search terms do you use -- O(n*n), O(n^2), squared?
  1. Pagination is O(n*n) - this happened several times in production, so it counts as many bugs. Be careful with pagination queries.
  2. O(n*n) parsing in MySQL client - this was MySQL bug 34578
  3. O(n*n) allocation on array resize - Dan Luu explained an example of this. I have also encountered this but my memory is vague.
  4. O(n*n) common subexpression elimination - while working on a closed-source DBMS I fixed code that did CSE using an O(n*n) algorithm. It fell over on machine generated SQL that had thousands of terms in the WHERE clause.
  5. The InnoDB rw-lock and mutex so many years ago had O(n*n) overhead for n threads trying to get through them (lock/unlock) because of the way that wake-all on unlock was implemented. See MySQL bug 52806.
Perhaps shared_ptr deserves its own bucket. I wrote about finding shared_ptr perf bugs in MyRocks and MongoDB. I found at least one more in MyRocks, someone else reported one for RocksDB and I have seen a few more problems from this in production.
Viewing all 18786 articles
Browse latest View live


<script src="https://jsc.adskeeper.com/r/s/rssing.com.1596347.js" async> </script>