Quantcast
Channel: Planet MySQL
Viewing all 18800 articles
Browse latest View live

How to reset your `root` password on your MySQL server

$
0
0

You don’t need this tutorial if you have access to the root user or another one with SUPER and GRANT privileges.

The following instructions works for MySQL 5.7. You will need to stop the MySQL server and start it with mysqld_safe with the option skip-grant-tables:

sudo service mysql stop
sudo mysqld_safe --skip-grant-tables &
mysql -u root mysql

If you get an error on start, chances are there is no folder created for the mysqld_safe executable to run, on my tests I was able to solve by doing:

sudo mkdir /var/run/mysqld
sudo chown -R mysql:mysql /var/run/mysqld

And then trying to start the mysqld_safe process again.

After this, the MySQL console will pop up, and you need to set up a new password for root. The second line is necessary due to a MySQL bug #79027:

UPDATE mysql.user SET authentication_string=PASSWORD('mypassword') WHERE User='root';
UPDATE mysql.user SET plugin="mysql_native_password" WHERE User='root';
FLUSH PRIVILEGES;

Once finished, kill all MySQL processes and start the service again:

ps aux | grep mysql
sudo kill -9 [pid]
sudo service mysql start

Done, you have reset the root password! Make sure to keep it safe this time around!

See something wrong in this tutorial? Please don’t hesitate to message me through the comments or the contact page.


Hibernate database catalog multitenancy

MySQL Shell: Using External Python Modules

$
0
0

MySQL Shell is a great tool for working with MySQL. One of the features that make it stand out compared to the traditional mysql command-line client is the support for JavaScript and Python in addition to SQL statements. This allows you to write code you otherwise would have had to write outside the client. I showed a simple example of this in my post about the instant ALTER TABLE feature in MySQL 8.0.12 where a Python loop was used to populate a table with 1 million rows This blog will look further into the use of Python and more specifically external modules.

Using a customer table_tools module in MySQL Shell.

Using Standard Modules

Aforementioned loop that was used to populate a test table also showed another feature of MySQL Shell: You can use the standard Python modules just as you would do in any other Python script. For example, if you need to create UUIDs you can use the uuid module:

mysql-py> import uuid
mysql-py> print(uuid.uuid1().hex)
9e8ef45ea12911e8a8a6b0359feab2bb

This on its own is great, but what about your own modules? Sure, that is supported as well. Before showing how you can access your own modules, let’s create a simple module to use as an example.

Example Module

For the purpose of this blog, the following code should be saved in the file table_tools.py. You can save it in whatever directory you keep your Python libraries. The code is:

def describe(table):
    fmt = "{0:<11}   {1:<8}    {2:<4}   {3:<3}    {4:<9}    {5:<14}"

    # Create query against information_schema.COLUMNS
    session = table.get_session()
    i_s = session.get_schema("information_schema")
    i_s_columns = i_s.get_table("COLUMNS")

    query = i_s_columns.select(
        "COLUMN_NAME AS Field",
        "COLUMN_TYPE AS Type",
        "IS_NULLABLE AS `Null`",
        "COLUMN_KEY AS Key",
        "COLUMN_DEFAULT AS Default",
        "EXTRA AS Extra"
    )
    query = query.where("TABLE_SCHEMA = :schema AND TABLE_NAME = :table")
    query = query.order_by("ORDINAL_POSITION")

    query = query.bind("schema", table.schema.name)
    query = query.bind("table", table.name)

    result = query.execute()

    # Print the column names
    column_names = [column.column_name for column in result.get_columns()]
    print(fmt.format(*column_names))
    print("-"*67)

    for row in result.fetch_all():
        print(fmt.format(*row))

The describe function takes a Table object from which it works backwards to get the session object. It then queries the information_schema.COLUMNS view to get the same information about the table as the DESC SQL command. Both the table and schema name can be found through the table object. Finally, the information is printed.

The example is overly simplified for general usage as it does not change the width of the output based on the length of the data, and there is no error handling whatsoever. However, this is on purpose to focus on the usage of the code from within MySQL Shell rather than on the code.

Note: The same code works in a MySQL Connector/Python script except that the rows are returned as mysqlx.result.Row objects. So, the loop printing the rows look a little different:
for row in result.fetch_all():
        values = [row[name] or "" for name in column_names]
        print(fmt.format(*values))

With the function ready, it is time to look at how you can import it into MySQL Shell.

Importing Modules Into MySQL Shell

In order to be able to import a module into MySQL Shell, it must be in the path searched by Python. If you have saved table_tools.py into a location already searched, then that is it. However, a likely more common scenario is that you have saved the file in a custom location. In that case, you need to tell Python where to look for the files.

You modify the search path in MySQL Shell just as you would in a regular Python program. If you for example have saved the file to D:\MySQL\Shell\Python, then you can add that to the path using the following code:

import sys
sys.path.append("D:\MySQL\Shell\Python")

If this is something you need as a one off, then it is fine just to modify the path directly in MySQL Shell. However, if you are working on some utilities that you want to reuse, it becomes tedious. MySQL Shell has support for configuration files where commands can be executed. The one for Python is named mysqlshrc.py (and mysqlshrc.js for JavaScript).

MySQL Shell searches for the mysqlshrc.py file in four locations including global locations as well as user specific locations. You can see the full list and the search order in the MySQL Shell User Guide. The user specific file is %APPDATA%\MySQL\mysqlsh\mysqlshrc.py on Microsoft Windows and $HOME/.mysqlsh/mysqlshrc.py on Linux and macOS.

You can do more than just changing the search path in the mysqlshrc.py file. However, for this example nothing else is needed.

Using the Module

Now that MySQL Shell has been set up to search in the path where your module is saved, you can use it in MySQL Shell. For example to get the description of the world.city table, you can use the following commands:

mysql-py> import table_tools
mysql-py> \use world
Default schema `world` accessible through db.

mysql-py> table_tools.describe(db.city)
Field         Type        Null   Key    Default      Extra
-------------------------------------------------------------------
ID            int(11)     NO     PRI    None         auto_increment
Name          char(35)    NO
CountryCode   char(3)     NO     MUL
District      char(20)    NO
Population    int(11)     NO            0

The \use world command sets the default schema to the world database. As a side effect, it also makes the tables in the world database available as properties of the db object. So, it possible to pass an object for the world.city table as db.city to table_tools.describe() function.

That is it. Now it is your turn to explore the possibilities that have been opened with MySQL Shell.

MySQL on Docker: How to Monitor MySQL Containers with Prometheus - Part 1 - Deployment on Standalone and Swarm

$
0
0

Monitoring is a concern for containers, as the infrastructure is dynamic. Containers can be routinely created and destroyed, and are ephemeral. So how do you keep track of your MySQL instances running on Docker?

As with any software component, there are many options out there that can be used. We’ll look at Prometheus as a solution built for distributed infrastructure, and works very well with Docker.

This is a two-part blog. In this part 1 blog, we are going to cover the deployment aspect of our MySQL containers with Prometheus and its components, running as standalone Docker containers and Docker Swarm services. In part 2, we will look at the important metrics to monitor from our MySQL containers, as well as integration with the paging and notification systems.

Introduction to Prometheus

Prometheus is a full monitoring and trending system that includes built-in and active scraping, storing, querying, graphing, and alerting based on time series data. Prometheus collects metrics through pull mechanism from configured targets at given intervals, evaluates rule expressions, displays the results, and can trigger alerts if some condition is observed to be true. It supports all the target metrics that we want to measure if one would like to run MySQL as Docker containers. Those metrics include physical hosts metrics, Docker container metrics and MySQL server metrics.

Take a look at the following diagram which illustrates Prometheus architecture (taken from Prometheus official documentation):

We are going to deploy some MySQL containers (standalone and Docker Swarm) complete with a Prometheus server, MySQL exporter (i.e., a Prometheus agent to expose MySQL metrics, that can then be scraped by the Prometheus server) and also Alertmanager to handle alerts based on the collected metrics.

For more details check out the Prometheus documentation. In this example, we are going to use the official Docker images provided by the Prometheus team.

Standalone Docker

Deploying MySQL Containers

Let's run two standalone MySQL servers on Docker to simplify our deployment walkthrough. One container will be using the latest MySQL 8.0 and the other one is MySQL 5.7. Both containers are in the same Docker network called "db_network":

$ docker network create db_network
$ docker run -d \
--name mysql80 \
--publish 3306 \
--network db_network \
--restart unless-stopped \
--env MYSQL_ROOT_PASSWORD=mypassword \
--volume mysql80-datadir:/var/lib/mysql \
mysql:8 \
--default-authentication-plugin=mysql_native_password

MySQL 8 defaults to a new authentication plugin called caching_sha2_password. For compatibility with Prometheus MySQL exporter container, let's use the widely-used mysql_native_password plugin whenever we create a new MySQL user on this server.

For the second MySQL container running 5.7, we execute the following:

$ docker run -d \
--name mysql57 \
--publish 3306 \
--network db_network \
--restart unless-stopped \
--env MYSQL_ROOT_PASSWORD=mypassword \
--volume mysql57-datadir:/var/lib/mysql \
mysql:5.7

Verify if our MySQL servers are running OK:

[root@docker1 mysql]# docker ps | grep mysql
cc3cd3c4022a        mysql:5.7           "docker-entrypoint.s…"   12 minutes ago      Up 12 minutes       0.0.0.0:32770->3306/tcp   mysql57
9b7857c5b6a1        mysql:8             "docker-entrypoint.s…"   14 minutes ago      Up 14 minutes       0.0.0.0:32769->3306/tcp   mysql80

At this point, our architecture is looking something like this:

Let's get started to monitor them.

Exposing Docker Metrics to Prometheus

Docker has built-in support as Prometheus target, where we can use to monitor the Docker engine statistics. We can simply enable it by creating a text file called "daemon.json" inside the Docker host:

$ vim /etc/docker/daemon.json

And add the following lines:

{
  "metrics-addr" : "12.168.55.161:9323",
  "experimental" : true
}

Where 192.168.55.161 is the Docker host primary IP address. Then, restart Docker daemon to load the change:

$ systemctl restart docker

Since we have defined --restart=unless-stopped in our MySQL containers' run command, the containers will be automatically started after Docker is running.

Deploying MySQL Exporter

Before we move further, the mysqld exporter requires a MySQL user to be used for monitoring purposes. On our MySQL containers, create the monitoring user:

$ docker exec -it mysql80 mysql -uroot -p
Enter password:
mysql> CREATE USER 'exporter'@'%' IDENTIFIED BY 'exporterpassword' WITH MAX_USER_CONNECTIONS 3;
mysql> GRANT PROCESS, REPLICATION CLIENT, SELECT ON *.* TO 'exporter'@'%';

Take note that it is recommended to set a max connection limit for the user to avoid overloading the server with monitoring scrapes under heavy load. Repeat the above statements onto the second container, mysql57:

$ docker exec -it mysql57 mysql -uroot -p
Enter password:
mysql> CREATE USER 'exporter'@'%' IDENTIFIED BY 'exporterpassword' WITH MAX_USER_CONNECTIONS 3;
mysql> GRANT PROCESS, REPLICATION CLIENT, SELECT ON *.* TO 'exporter'@'%';

Let's run the mysqld exporter container called "mysql8-exporter" to expose the metrics for our MySQL 8.0 instance as below:

$ docker run -d \
--name mysql80-exporter \
--publish 9104 \
--network db_network \
--restart always \
--env DATA_SOURCE_NAME="exporter:exporterpassword@(mysql80:3306)/" \
prom/mysqld-exporter:latest \
--collect.info_schema.processlist \
--collect.info_schema.innodb_metrics \
--collect.info_schema.tablestats \
--collect.info_schema.tables \
--collect.info_schema.userstats \
--collect.engine_innodb_status

And also another exporter container for our MySQL 5.7 instance:

$ docker run -d \
--name mysql57-exporter \
--publish 9104 \
--network db_network \
--restart always \
-e DATA_SOURCE_NAME="exporter:exporterpassword@(mysql57:3306)/" \
prom/mysqld-exporter:latest \
--collect.info_schema.processlist \
--collect.info_schema.innodb_metrics \
--collect.info_schema.tablestats \
--collect.info_schema.tables \
--collect.info_schema.userstats \
--collect.engine_innodb_status

We enabled a bunch of collector flags for the container to expose the MySQL metrics. You can also enable --collect.slave_status, --collect.slave_hosts if you have a MySQL replication running on containers.

We should be able to retrieve the MySQL metrics via curl from the Docker host directly (port 32771 is the published port assigned automatically by Docker for container mysql80-exporter):

$ curl 127.0.0.1:32771/metrics
...
mysql_info_schema_threads_seconds{state="waiting for lock"} 0
mysql_info_schema_threads_seconds{state="waiting for table flush"} 0
mysql_info_schema_threads_seconds{state="waiting for tables"} 0
mysql_info_schema_threads_seconds{state="waiting on cond"} 0
mysql_info_schema_threads_seconds{state="writing to net"} 0
...
process_virtual_memory_bytes 1.9390464e+07

At this point, our architecture is looking something like this:

We are now good to setup the Prometheus server.

Deploying Prometheus Server

Firstly, create Prometheus configuration file at ~/prometheus.yml and add the following lines:

$ vim ~/prometheus.yml
global:
  scrape_interval:     5s
  scrape_timeout:      3s
  evaluation_interval: 5s

# Our alerting rule files
rule_files:
  - "alert.rules"

# Scrape endpoints
scrape_configs:
  - job_name: 'prometheus'
    static_configs:
      - targets: ['localhost:9090']

  - job_name: 'mysql'
    static_configs:
      - targets: ['mysql57-exporter:9104','mysql80-exporter:9104']

  - job_name: 'docker'
    static_configs:
      - targets: ['192.168.55.161:9323']

From the Prometheus configuration file, we have defined three jobs - "prometheus", "mysql" and "docker". The first one is the job to monitor the Prometheus server itself. The next one is the job to monitor our MySQL containers named "mysql". We define the endpoints on our MySQL exporters on port 9104, which exposed the Prometheus-compatible metrics from the MySQL 8.0 and 5.7 instances respectively. The "alert.rules" is the rule file that we will include later in the next blog post for alerting purposes.

We can then map the configuration with the Prometheus container. We also need to create a Docker volume for Prometheus data for persistency and also expose port 9090 publicly:

$ docker run -d \
--name prometheus-server \
--publish 9090:9090 \
--network db_network \
--restart unless-stopped \
--mount type=volume,src=prometheus-data,target=/prometheus \
--mount type=bind,src="$(pwd)"/prometheus.yml,target=/etc/prometheus/prometheus.yml \
--mount type=bind,src="$(pwd)
prom/prometheus

Now our Prometheus server is already running and can be accessed directly on port 9090 of the Docker host. Open a web browser and go to http://192.168.55.161:9090/ to access the Prometheus web UI. Verify the target status under Status -> Targets and make sure they are all green:

At this point, our container architecture is looking something like this:

Our Prometheus monitoring system for our standalone MySQL containers are now deployed.

Docker Swarm

Deploying a 3-node Galera Cluster

Supposed we want to deploy a three-node Galera Cluster in Docker Swarm, we would have to create 3 different services, each service representing one Galera node. Using this approach, we can keep a static resolvable hostname for our Galera container, together with MySQL exporter containers that will accompany each of them. We will be using MariaDB 10.2 image maintained by the Docker team to run our Galera cluster.

Firstly, create a MySQL configuration file to be used by our Swarm service:

$ vim ~/my.cnf
[mysqld]

default_storage_engine          = InnoDB
binlog_format                   = ROW

innodb_flush_log_at_trx_commit  = 0
innodb_flush_method             = O_DIRECT
innodb_file_per_table           = 1
innodb_autoinc_lock_mode        = 2
innodb_lock_schedule_algorithm  = FCFS # MariaDB >10.1.19 and >10.2.3 only

wsrep_on                        = ON
wsrep_provider                  = /usr/lib/galera/libgalera_smm.so
wsrep_sst_method                = mariabackup

Create a dedicated database network in our Swarm called "db_swarm":

$ docker network create --driver overlay db_swarm

Import our MySQL configuration file into Docker config so we can load it into our Swarm service when we create it later:

$ cat ~/my.cnf | docker config create my-cnf -

Create the first Galera bootstrap service, with "gcomm://" as the cluster address called "galera0". This is a transient service for bootstrapping process only. We will delete this service once we have gotten 3 other Galera services running:

$ docker service create \
--name galera0 \
--replicas 1 \
--hostname galera0 \
--network db_swarm \
--publish 3306 \
--publish 4444 \
--publish 4567 \
--publish 4568 \
--config src=my-cnf,target=/etc/mysql/mariadb.conf.d/my.cnf \
--env MYSQL_ROOT_PASSWORD=mypassword \
--mount type=volume,src=galera0-datadir,dst=/var/lib/mysql \
mariadb:10.2 \
--wsrep_cluster_address=gcomm:// \
--wsrep_sst_auth="root:mypassword" \
--wsrep_node_address=galera0

At this point, our database architecture can be illustrated as below:

Then, repeat the following command for 3 times to create 3 different Galera services. Replace {name} with galera1, galera2 and galera3 respectively:

$ docker service create \
--name {name} \
--replicas 1 \
--hostname {name} \
--network db_swarm \
--publish 3306 \
--publish 4444 \
--publish 4567 \
--publish 4568 \
--config src=my-cnf,target=/etc/mysql/mariadb.conf.d/my.cnf \
--env MYSQL_ROOT_PASSWORD=mypassword \
--mount type=volume,src={name}-datadir,dst=/var/lib/mysql \
mariadb:10.2 \
--wsrep_cluster_address=gcomm://galera0,galera1,galera2,galera3 \
--wsrep_sst_auth="root:mypassword" \
--wsrep_node_address={name}

Verify our current Docker services:

$ docker service ls 
ID                  NAME                MODE                REPLICAS            IMAGE               PORTS
wpcxye3c4e9d        galera0             replicated          1/1                 mariadb:10.2        *:30022->3306/tcp, *:30023->4444/tcp, *:30024-30025->4567-4568/tcp
jsamvxw9tqpw        galera1             replicated          1/1                 mariadb:10.2        *:30026->3306/tcp, *:30027->4444/tcp, *:30028-30029->4567-4568/tcp
otbwnb3ridg0        galera2             replicated          1/1                 mariadb:10.2        *:30030->3306/tcp, *:30031->4444/tcp, *:30032-30033->4567-4568/tcp
5jp9dpv5twy3        galera3             replicated          1/1                 mariadb:10.2        *:30034->3306/tcp, *:30035->4444/tcp, *:30036-30037->4567-4568/tcp

Our architecture is now looking something like this:

We need to remove the Galera bootstrap Swarm service, galera0, to stop it from running because if the container is being rescheduled by Docker Swarm, a new replica will be started with a fresh new volume. We run the risk of data loss because the --wsrep_cluster_address contains "galera0" in the other Galera nodes (or Swarm services). So, let's remove it:

$ docker service rm galera0

At this point, we have our three-node Galera Cluster:

We are now ready to deploy our MySQL exporter and Prometheus Server.

MySQL Exporter Swarm Service

Login to one of the Galera nodes and create the exporter user with proper privileges:

$ docker exec -it {galera1} mysql -uroot -p
Enter password:
mysql> CREATE USER 'exporter'@'%' IDENTIFIED BY 'exporterpassword' WITH MAX_USER_CONNECTIONS 3;
mysql> GRANT PROCESS, REPLICATION CLIENT, SELECT ON *.* TO 'exporter'@'%';

Then, create the exporter service for each of the Galera services (replace {name} with galera1, galera2 and galera3 respectively):

$ docker service create \
--name {name}-exporter \
--network db_swarm \
--replicas 1 \
-p 9104 \
-e DATA_SOURCE_NAME="exporter:exporterpassword@({name}:3306)/" \
prom/mysqld-exporter:latest \
--collect.info_schema.processlist \
--collect.info_schema.innodb_metrics \
--collect.info_schema.tablestats \
--collect.info_schema.tables \
--collect.info_schema.userstats \
--collect.engine_innodb_status

At this point, our architecture is looking something like this with exporter services in the picture:

Prometheus Server Swarm Service

Finally, let's deploy our Prometheus server. Similar to the Galera deployment, we have to prepare the Prometheus configuration file first before importing it into Swarm using Docker config command:

$ vim ~/prometheus.yml
global:
  scrape_interval:     5s
  scrape_timeout:      3s
  evaluation_interval: 5s

# Our alerting rule files
rule_files:
  - "alert.rules"

# Scrape endpoints
scrape_configs:
  - job_name: 'prometheus'
    static_configs:
      - targets: ['localhost:9090']

  - job_name: 'galera'
    static_configs:
      - targets: ['galera1-exporter:9104','galera2-exporter:9104', 'galera3-exporter:9104']

From the Prometheus configuration file, we have defined three jobs - "prometheus" and "galera". The first one is the job to monitor the Prometheus server itself. The next one is the job to monitor our MySQL containers named "galera". We define the endpoints on our MySQL exporters on port 9104, which expose the Prometheus-compatible metrics from the three Galera nodes respectively. The "alert.rules" is the rule file that we will include later in the next blog post for alerting purposes.

Import the configuration file into Docker config to be used with Prometheus container later:

$ cat ~/prometheus.yml | docker config create prometheus-yml -

Let's run the Prometheus server container, and publish port 9090 of all Docker hosts for the Prometheus web UI service:

$ docker service create \
--name prometheus-server \
--publish 9090:9090 \
--network db_swarm \
--replicas 1 \    
--config src=prometheus-yml,target=/etc/prometheus/prometheus.yml \
--mount type=volume,src=prometheus-data,dst=/prometheus \
prom/prometheus

Verify with the Docker service command that we have 3 Galera services, 3 exporter services and 1 Prometheus service:

$ docker service ls
ID                  NAME                MODE                REPLICAS            IMAGE                         PORTS
jsamvxw9tqpw        galera1             replicated          1/1                 mariadb:10.2                  *:30026->3306/tcp, *:30027->4444/tcp, *:30028-30029->4567-4568/tcp
hbh1dtljn535        galera1-exporter    replicated          1/1                 prom/mysqld-exporter:latest   *:30038->9104/tcp
otbwnb3ridg0        galera2             replicated          1/1                 mariadb:10.2                  *:30030->3306/tcp, *:30031->4444/tcp, *:30032-30033->4567-4568/tcp
jq8i77ch5oi3        galera2-exporter    replicated          1/1                 prom/mysqld-exporter:latest   *:30039->9104/tcp
5jp9dpv5twy3        galera3             replicated          1/1                 mariadb:10.2                  *:30034->3306/tcp, *:30035->4444/tcp, *:30036-30037->4567-4568/tcp
10gdkm1ypkav        galera3-exporter    replicated          1/1                 prom/mysqld-exporter:latest   *:30040->9104/tcp
gv9llxrig30e        prometheus-server   replicated          1/1                 prom/prometheus:latest        *:9090->9090/tcp

Now our Prometheus server is already running and can be accessed directly on port 9090 from any Docker node. Open a web browser and go to http://192.168.55.161:9090/ to access the Prometheus web UI. Verify the target status under Status -> Targets and make sure they are all green:

At this point, our Swarm architecture is looking something like this:

To be continued..

We now have our database and monitoring stack deployed on Docker. In part 2 of the blog, we will look into the different MySQL metrics to keep an eye on. We’ll also see how to configure alerting with Prometheus.

What is special with MySQL Cluster

$
0
0
The first chapter from the book "MySQL Cluster 7.5 inside and out".
This chapter presents a number of key features that makes NDB
unique.

Rationale for MySQL Cluster

$
0
0
Second chapter of "MySQL Cluster 7.5 inside and out".

When I started developing the ideas for NDB Cluster in my Ph.D studies
about 25 years ago, the first thing I did was to perform a very thorough
study of the requirements.

At that time I participated in a European Research for UMTS. UMTS was
later marketed as 3G. My part of this big study group of more than 100
researchers was to simulate the network behaviour. We used the
protocols developed by other groups to see what the load would be on
the various nodes in the telecom network.

I was mostly interested in the load it contributed to the network databases.
Through these studies and also by studying the AXE system developed
in Ericsson I got a very good picture of the requirements on a DBMS
to be used for future telecom services.

In parallel with this I also studied a number of other areas such as
multimedia email servers, news-on-demand servers, genealogy
servers that would be other popular services in the telecom network.

In the above chapter I go through how those requirements was turned
into requirements on predictable response times, availability requirements,
throughput requirements and so forth.

In particular how the requirement led to a model that divided the Data
Server functionality (NDB data nodes) and the Query Server
functionality (MySQL Server nodes).

Also how predictable response times are achieved by building on ideas
from the AXE architecture developed in Ericsson.

MySQL Connector/J 5.1.47 GA has been released

$
0
0

Dear MySQL Users,

MySQL Connector/J 5.1.47, a maintenance release of the production 5.1
branch has been released. Connector/J is the Type-IV pure-Java JDBC
driver for MySQL.

MySQL Connector/J is available in source and binary form from the
Connector/J download pages at
http://dev.mysql.com/downloads/connector/j/5.1.html
and mirror sites as well as Maven-2 repositories.

MySQL Connector/J (Commercial) is already available for download on
the My Oracle Support (MOS) website. This release will shortly be
available on eDelivery (OSDC).

As always, we recommend that you check the “CHANGES” file in the
download archive to be aware of changes in behavior that might affect
your application.

MySQL Connector/J 5.1.47 includes the following general bug fixes and
improvements, also available in more detail on
https://dev.mysql.com/doc/relnotes/connector-/5.1/en/news-5-1-47.html

Changes in MySQL Connector/J 5.1.47 (2018-08-17, General Availability)

Version 5.1.47 is a maintenance release of the production 5.1 branch.
It is suitable for use with MySQL Server versions 5.5, 5.6, 5.7, and
8.0. It supports the Java Database Connectivity (JDBC) 4.2 API.

     * Functionality Added or Changed

     * Bugs Fixed

Functionality Added or Changed


     * The value UTF-8 for the connection property
       characterEncoding now maps to the utf8mb4 character set
       on the server and, for MySQL Server 5.5.2 and later,
       characterEncoding=UTF-8 can now be used to set the
       connection character set to utf8mb4 even if
       character_set_server has been set to something else on
       the server. (Before this change, the server must have
       character_set_server=utf8mb4 for Connector/J to use that
       character set.)
       Also, if the connection property connectionCollation is
       also set and is incompatible with the value of
       characterEncoding, characterEncoding will be overridden
       with the encoding corresponding to connectionCollation.
       See Using Character Sets and Unicode
       (http://dev.mysql.com/doc/connector- j/5.1/en/connector-j-reference-charsets.html )
       for details, including how to use the utf8mb3 character
       set now for connection. (Bug#23227334, Bug #81196)

Bugs Fixed


     * Setting rewriteBatchedStatements=true and
       useLocalTransactionState=true caused transactions to be
       uncommitted for batched UPDATE and DELETE statements. It
       was due to the intermediate queries for enabling
       multiquery support on the server resetting the local
       transaction state as a side effect. With this fix, the
       local transaction state is preserved when the
       intermediate queries are executed. (Bug #27658489, Bug
       #89948)

     * Rewriting prepared INSERT statements in a multiquery
       batch failed with a BatchUpdateException when the
       statements did not contain place holders. This was due a
       faulty mechanism for query rewriting, which has been
       corrected by this fix. (Bug #25501750, Bug #84813)

     * When using batched prepared statements with multiple
       queries per statement, queries rewriting was incorrect,
       resulting in the wrong queries being sent to the server.
       (Bug #23098159, Bug #81063)

     * ResultSet.updateRow() failed when the character set used
       by a column in the ResultSet did not match that of the
       connection's encoding. With this fix, values for the
       affected columns are first converted to String before the
       update, so that the character set difference is properly
       handled. (Bug #22847443, Bug #80532)

     * Record updates failed for a scrollable and updatable
       PreparedStatement when the WHERE clause for the updater
       or refresher contained fractional timestamp values and
       the connection property sendFractionalSeconds was set to
       false. It was because in the situation, Connector/J did
       not perform the proper adjustments of the fractional
       parts in the WHERE clause values according to the length
       of the field's fractional part as defined in the
       database. This fix makes Connector/J perform the proper
       adjustment to the fractional part, so that the WHERE
       clause value can be properly compared to the value
       fetched from the database.
       Moreover, useJDBCCompliantTimezoneShift(),
       useGmtMillisForDatetimes(), and
       useSSPSCompatibleTimezoneShift() were applied to the
       WHERE clause values while they should not be, and this
       fix removes their applications. (Bug #22305979)

     * When a Java Date value was bound to a PreparedStatement
       parameter, attempts to format the value by a proleptic
       GregorianCalendar failed to make the dates proleptic, so
       that dates before the Julian-Gregorian cutover (October
       15, 1582) were stored wrongly. With this fix, a proleptic
       calendar is properly used if supplied to the setDate()
       method.
       Note that when trying to set or retrieve dates before the
       Julian-Gregorian cutover with PreparedSatement methods, a
       proleptic GregorianCalendar should always be explicitly
       supplied to the setDate() and getDate() method.For
       details, see Known Issues and Limitations
       ( http://dev.mysql.com/doc/connector-j/5.1/en/connector-j-usagenotes-known-issues-limitations.html ).
       (Bug#18749544, Bug #72609)          


On Behalf of MySQL Release Engineering Team,
Surabhi Bhat

Percona Server for MySQL 5.5.61-38.13 Is Now Available

$
0
0
Percona Server for MySQL 5.6

Percona Server for MySQL 5.6Percona announces the release of Percona Server for MySQL 5.5.61-38.13 on August 17, 2018 (downloads are available here and from the Percona Software Repositories). This release merges changes of MySQL 5.5.61, including all the bug fixes in it. Percona Server for MySQL 5.5.61-38.13 is now the current GA release in the 5.5 series. All of Percona’s software is open-source and free.

Bugs Fixed
  • The --innodb-optimize-keys option of the mysqldump utility fails when a column name is used as a prefix of a column which has the AUTO_INCREMENT attribute. Bug fixed #4524.
Other Bugs Fixed
  • #4566 “stack-use-after-scope in reinit_io_cache()” (upstream 91603)
  • #4581 “stack-use-after-scope in _db_enter_() / mysql_select_db()” (upstream 91604)
  • #4600 “stack-use-after-scope in _db_enter_() / get_upgrade_info_file_name()” (upstream 91617)
  • #3976 “Errors in MTR tests main.variables-big, main.information_schema-big, innodb.innodb_bug14676111”

Find the release notes for Percona Server for MySQL 5.5.61-38.13 in our online documentation. Report bugs in the Jira bug tracker.

The post Percona Server for MySQL 5.5.61-38.13 Is Now Available appeared first on Percona Database Performance Blog.


Percona Server for MySQL 5.6.41-84.1 Is Now Available

$
0
0
Percona Server for MySQL 5.6

Percona Server for MySQL 5.6Percona announces the release of Percona Server for MySQL 5.6.41-84.1 on August 17, 2018 (downloads are available here and from the Percona Software Repositories). This release merges changes of MySQL 5.6.41, including all the bug fixes in it. Percona Server for MySQL 5.6.41-84.1 is now the current GA release in the 5.6 series. All of Percona’s software is open-source and free.

Bugs Fixed
  • A simple SELECT query on a table with CHARSET=euckr COLLATE=euckr_bin could return different results each time it was executed. Bug fixed #4513 (upstream 91091).
  • Percona Server 5.6.39-83.1 could crash when altering an InnoDB table that has a full-text search index defined. Bug fixed #3851 (upstream 68987).
Other Bugs Fixed
  • #3325 “online upgrade GTID cause binlog damage in high write QPS situation”
  • #3976 “Errors in MTR tests main.variables-big, main.information_schema-big, innodb.innodb_bug14676111”
  • #4506 “Backport fixes from 8.0 for InnoDB memcached Plugin”

Find the release notes for Percona Server for MySQL 5.6.41-84.1 in our online documentation. Report bugs in the Jira bug tracker.

The post Percona Server for MySQL 5.6.41-84.1 Is Now Available appeared first on Percona Database Performance Blog.

On Fine MySQL Manual

$
0
0
Today I am going to provide some details on the last item in my list of problems with Oracle's way of MySQL server development, maintenance of MySQL Manual. I stated that:
"MySQL Manual still have many details missing and is not fixed fast enough.
Moreover, it is not open source...
"
Let me explain the above:
  1. MySQL Reference Manual is not open source. It used to be built from DocBook XML sources. Probably that's still the case. But you can not find the source code in open repositories (please, correct me if I am wrong, I tried to search...) That's because it is NOT open source. It says this clearly in Preface:
    "This documentation is NOT distributed under a GPL license. Use of this documentation is subject to the following terms:
    ...
    Any other use, such as any dissemination of printed copies or use of this documentation, in whole or in part, in another publication, requires the prior written consent from an authorized representative of Oracle. Oracle and/or its affiliates reserve any and all rights to this documentation not expressly granted above.
    "
    It was NOT Oracle who closed the source (as far as I remember, the manual was not GPL even in 2004, when I started to care about MySQL in general). But Oracle had a chance to change the license and set up some better contribution process for MySQL Community users, with many good writers among them. They decided not do this, so creators of forks and derived software have to duplicate efforts and rewrite everything themselves, and the only real way to help make the manual better is to report bugs.
  2. Quality of new documentation is not improved much. We, MySQL Community users, have to report bugs in the manual, as it still has some details missing or documented wrongly. Let me illustrate this with recent 10 or so documentation requests users made (I skipped reports for features I do not care about for now, like group replication):
    • Bug #91955 - "8.0 broke plugin API for C". According to the comment from Oracle developer in this bug reported by Laurynas Biveinis, writing plugins in C is not supported any more... But this change is NOT properly documented.
    • Bug #91781 - "Add version matrix in "Chapter 2 Keywords and Reserved Words". Good idea in the manual is not consistently implemented.
    • Bug #91743 - "performance_schema.data_locks not working correctly". Nice feature was added to Performance Schema (now we can check and study InnoDB locks with SQL!), but it is still not completely and properly documented.
    • Bug #91654 - "Handling an Unexpected Halt of a Replication Slave" Documentation is uncertain". This is also an example of improper bug handling - when I worked in Oracle newer bugs were usually declared duplicates of older ones. Here the opposite decision was made, even though both reports were from the same user, Uday Varagani, who explicitly asked to change the decision. Obviously, documentation requests do not get any extra care comparing to other kinds of bugs, quite to the contrary...
    • Bug #91648 - "Numeric literals must be a number between 0 and 9999". Surely ports with numbers larger than 9999 can be used.
    • Bug #91642 - "Document how protocol version 4.0 and 4.1 differ on how strings are terminated". As noted by Rene' Cannao', comments in the code are still sometimes more useful than documentation.
    • Bug #91549 - "MDL lock queue order seems to depend on table names". Make sure to read last comment in this nice request by Shane Bester. Dmitry Lenev provides some details on priorities of MDL locks in it. There are still cases when bugs and documentation requests document some details better than fine MySQL Manual!
    • Bug #90997 - "Handling an Unexpected Halt of a Replication Slave" manual page is wrong". Sveta Smirnova highlighted a totally misleading statement in the manual.
    • Bug #90935 - "Modify relay_log_recovery Documentation". Simple documentation request stays "Open" for 3 months. Definitely processing documentation requests is not a highest priority for Oracle engineers.
    • Bug #90680 - "dragnet logging: document how to use / find error_symbol codes". Even if request comes from a customer or otherwise well known bug reporter, like Simon Mudd, and it's related to some totally new cool feature of MySQL 8, it can wait for the fix for months...
    You can make your own conclusions from the above. But I do not see any good trends in the way new documentation is created or documentation requests are processed recently. Same problems as 4 years ago (see more on that in a side note below).
  3. Older documentation requests get even less attention than recent ones sometimes, even though they may highlight problems with software itself, not the MySQL Manual. Let me illustrate this with a few bugs I reported:
    • Bug #83640 - "Locks set by DELETE statement on already deleted record". I explicitly asked to
      "...document in the manual what locks this kind of DELETE sets when it encountered a record already marked as deleted, and why"
      This still had NOT happened. Moreover, eventually both MySQL and MariaDB engineers decided that current implementation of locking for this case is wrong and can be improved, so this report ended up as InnoDB bug. Check related  MDEV-11215 for more details.
    • Bug #73413 - "Manual does not explain MTS implementation in details". This is one of my favorite documentation requests. I've got a suggestion to explain what I want to see documented, in details. I tried my best, but if you want to get more details, read this blog.
    • Bug #72368 - "Empty/zero statistics for imported tablespace until explicit ANALYZE TABLE". This is a bug in the way persistent statistics (the feature I truly hate) in InnoDB is re-estimated "automatically". But until the bug is fixed, I asked to document current implementation (and problems with it). So, where current implementation is properly documented? If only in the bug reports...
    • Bug #71294 - "Manual page for P_S.FILE_INSTANCES table does not explain '~' in FILE_NAME".  They pretend they do not get the point:
      "Per Marc Alff, the Performance Schema is simply reporting what it gets from runtime. If runtime is reporting nonexistent filenames, that's a server issue.

      Recategorizing this as a server bug.
      "
    • Bug #71293 - "Manual page for P_S.FILE_INSTANCES table does not explain EVENT_NAME values". Now they are waiting for the new DOCUMENTATION column in the setup_instruments table to be filled in with something by server developers... The code is the documentation? OK, bus as we know from the experience (see slides 44-46 here) chances to get a bug in Performance Schema fixed fast are even less than to see it properly and completely documented...
There are more problems with MySQL documentation (not only reference manual), but at the moment I consider 3 highlighted and illustrated above the most serious.

Regent's Canal is nice. If I only knew how to operate the locks there... MySQL Manual also misses some information about locks.
As a side note, it's not the first time I write about MySQL Manual. You can find some useful details in the following posts:
  • "What's wrong with MySQL Manual". In 2014, after spending few weeks reporting up to 5 documentation bugs per day, I thought that, essentially, there is nothing much wrong with it - it's fine, well indexed by Google and has meaningful human-readable URLs. Few problems listed were lack of careful readers (I tried my best to fix that), limited attention to old documentation requests, some pages with not so much useful content and lack of "How to" documents. The later I also tried to fix to some small extent in this blog, see howto tagged posts. The real fix came mostly from Percona's blog, though.
  • I have a special "missing manual" tag for blog posts that mention at least one bug in the manual.
  • I tried to use "missing_manual" tag consistently for my own documentation requests. Last year I shared a detailed enough review of the bugs with that tag that were still active.
As a yet another side note, I tried once to create a kind of community driven "missing manual" project, but failed. Writing manual from scratch is a (hard) full time job, while my full time job is providing support to users of MySQL, MariaDB and Percona software...

That said, I also wanted to join MySQL's documentation team in the past, but this was not possible at least because I am not a native speaker. If anything changed in this regard, I am still open to a job offer of this kind. My conditions for an acceptable offer from Oracle are known to all interested parties and they include (but are not limited to) at least 4 times the salary I had before I quit (it was almost 6 years ago) and working for Oracle's office in Paris (because in Oracle office you ere employed by formally matters a lot for your happiness and success as employee).

In case of no offer in upcoming week, I'll just continue to write my annoying but hopefully somewhat useful blog posts (until MySQL Reference Manual becomes true open source project ;)

Webinar Tues 8/21: MariaDB 10.3 vs. MySQL 8.0

$
0
0
MariaDB 10.3 vs MySQL 8.0

MariaDB 10.3 vs MySQL 8.0Please join Percona’s Chief Evangelist, Colin Charles on Tuesday, August 21st, 2018, as he presents MariaDB 10.3 vs. MySQL 8.0 at 7:00 AM PDT (UTC-7) / 10:00 PM EDT (UTC-4).

Are they syntactically similar? Where do these two languages differ? Why would I use one over the other?

MariaDB 10.3 is on the path of gradually diverging from MySQL 8.0. One obvious example is the internal data dictionary currently under development for MySQL 8.0. This is a major change to the way metadata is stored and used within the server: MariaDB doesn’t have an equivalent feature. Implementing this feature could mark the end of datafile-level compatibility between MySQL and MariaDB.

There are also non-technical differences between MySQL 8.0 and MariaDB 10.4, including:

  • Licensing: MySQL offers their code as open-source under the GPL, and provides the option of non-GPL commercial distribution in the form of MySQL Enterprise. MariaDB can only use the GPL because their work is derived from the MySQL source code under the terms of that license.
  • Support services: Oracle provides technical support, training, certification and consulting for MySQL, while MariaDB has their own support services. Some people prefer working with smaller companies, as traditionally it affords them more leverage as a customer.
  • Community contributions: MariaDB touts the fact that they accept more community contributions than Oracle. Part of the reason for this disparity is that developers like to contribute features, bug fixes and other code without a lot of paperwork overhead (and they complain about the Oracle Contributor Agreement). However, MariaDB has its own MariaDB Contributor Agreement — which more or less serves the same purpose.

Colin will take a look at some of the differences between MariaDB 10.3 and MySQL 8.0 and help answer some of the common questions our Database Performance Experts get about the two databases.

Register Now

The post Webinar Tues 8/21: MariaDB 10.3 vs. MySQL 8.0 appeared first on Percona Database Performance Blog.

Use cases for MySQL Cluster

$
0
0
Third chapter of "MySQL Cluster 7.5 inside and out".

NDB was designed for a number of networking applications. In particular the original
design focused a lot on telecom applications. The telecom applications have extreme
requirements on availability, many networking applications as well.

This chapter goes through a number of application types where NDB have been used
and also uses a number of public examples of use cases.

These application types include DNS servers, DHCP servers, Intelligent Network (IN)
applications, 3G/4G/5G applications, RADIUS servers, number portability, DIAMETER
server, Video-on-demand applications, Payment Gateways, Software Defined
Networking (SDN), Network Function Virtualization (NFV), Voice over IP.

In addition also many internet applications such as Gaming servers, financial
applications such as stock quote servers, whitelist/blacklist handling. eCommerce
applications, payment services, web applications, fraud detection, online banking,
session database.

In addition a number of frameworks have used NDB and presented it publically such
as a GE presentation, HopsFS (Hadoop distribution), HopsYARN, Oracle OpenStack
and OpenLDAP.

With the possibility to handle more data in MySQL Cluster 7.6 it is likely that this
list of application types will grow even more.

Using AWS EC2 instance store vs EBS for MySQL: how to increase performance and decrease cost

$
0
0
AWS EC2 MySQL cost savings

AWS EC2 MySQL cost savingsIf you are using large EBS GP2 volumes for MySQL (i.e. 10TB+) on AWS EC2, you can increase performance and save a significant amount of money by moving to local SSD (NVMe) instance storage. Interested? Then read on for a more detailed examination of how to achieve cost-benefits and increase performance from this implementation.

EBS vs Local instance store

We have heard from customers that large EBS GP2 volumes can be affected by short term outages—IO “stalls” where no IO is going in or out for a couple of minutes. This can happen, especially, in the largest AWS region us-east-1. Statistically, with so many disks in disk arrays (which back EBS volumes) we can expect frequent disk failures. If we allocate a very large EBS GP2 volume, i.e. 10Tb+, hitting such failure events can be common.

In the case of MySQL/InnoDB, such an IO “stall” will be obvious, particularly with the highly loaded system where MySQL needs to do physical IO. During the stall, you will see all write queries are waiting, or “hang”.  Some of the writes may error out with “Error 1030” (MySQL error code 1030 (ER_GET_ERRNO): Got error %d from storage engine). There is nothing MySQL can do here – if the IO subsystem is not available, it will need to wait for it.

The good news is: many of the newer EC2 instances (i.e. i3, m5d, etc) have local SSD disks attached (NVMe). Those disks are local to the physical server and should not suffer from the EBS issues described above. Using local disks can be a very good solution:

  1. They are faster, as they are local to the server, and do not suffer from the EBS issues
  2. They are much cheaper compared to large EBS volumes.

Please note, however, that local storage does not guarantee persistence. More about this below.

Another potential option will be to use IO1 volumes with provisional IOPS. However, it will be significantly more expensive for the large volumes and high traffic.

A look at costs

To estimate the costs, I’ve used the AWS simple monthly calculator. Estimated costs are based on 1 year reserved instances. Let’s imagine we will need to use 14TB volume (to store ~10Tb of MySQL data including binary logs). The pricing estimates will look like this:

r4.4xlarge, 122GB RAM, 16 vCPUs + EBS, 14TB volume (this is what we are presumably using now)

Amazon EC2 Service (US East (N. Virginia)) $ 1890.56 / month
Compute: $ 490.56
EBS Volumes: $1400.00

Local storage price estimate:
i3.4xlarge, 122GB RAM, 16 vCPUs, 3800 GiB disk (2 x 1900 NVMe SSD)

Amazon EC2 Service (US East (N. Virginia)) $ 627.21 / month
Compute: $ 625.61

i3.8xlarge, 244GB RAM, 32 vCPUs, 7600 GiB disk (4 x 1900 NVMe SSD)

Amazon EC2 Service (US East (N. Virginia)) $1252.82 / month
Compute: $ 1251.22

As we can see, even if we switch to i3.8xlarge and get 2x more RAM and 2x more virtual CPUs, faster storage, 10 gigabit network we can still pay 1.5x less per box what we are presumably paying now. Include replication, then that’s paying 1.5x less per each of the replication servers.

But wait … there is a catch.

How to migrate to local storage from EBS

Well, we have some challenges here to migrate from EBS to local instance NVMe storage.

  1. Wait, we are storing ~10Tb and i3.8xlarge have 7600 GiB disk. The answer is simple: compression (see below)
  2. Wait, but the local storage is ephemeral, if we loose the box we will loose our data – that is unacceptable.  The answer is also simple: replication (see below)
  3. Wait, but we use EBS snapshots for backups. That answer is simple too: we can still use EBS (and use snapshots) on 1 of the replication slave (see below)

Compression

To fit i3.8xlarge we only need 2x compression. This can be done with InnoDB row compression (row_format=compressed) or InnoDB page compression, which requires sparse file and hole punching support. However, InnoDB compression may be slower and will only compress ibd files—it does not compress binary logs, frm files, etc.

ZFS

Another option: use the ZFS filesystem. ZFS will compress all files, including binary logs and frm. That can be very helpful if we use a “schema per customer” or “table per customer” approach and need to store 100K – 200K tables in a single MySQL instance. If the data is compressible, or new tables were provisioned without much data in those, ZFS can give a significant disk savings.

I’ve used ZFS (followed Yves blog post, Hands-On Look at ZFS with MySQL). Here are the results of data compression with ZFS (this is real data, not a generated data):

# du -sh --apparent-size /mysqldata/mysql/data
8.6T	/mysqldata/mysql/data
# du -sh /mysqldata/mysql/data
3.2T	/mysqldata/mysql/data

Compression ratio:

# zfs get all | grep -i compress
...
mysqldata/mysql/data  compressratio         2.42x                  -
mysqldata/mysql/data  compression           gzip                   inherited from mysqldata/mysql
mysqldata/mysql/data  refcompressratio      2.42x                  -
mysqldata/mysql/log   compressratio         3.75x                  -
mysqldata/mysql/log   compression           gzip                   inherited from mysqldata/mysql
mysqldata/mysql/log   refcompressratio      3.75x                  -

As we can see, the original 8.6Tb of data was compressed to 3.2Tb, the compression ratio for MySQL tables is 2.42x, for binary logs 3.75x. That will definitely fit i3.8xlarge.

(For another test, I’ve generated 40 million tables spread across multiple schemas (databases). I’ve added some data only to one schema, leaving others blank. For that test I achieved ~10x compression ratio.)

Conclusion: ZFS can provide you with very good compression ratio, will allow you to use different EC2 instances on AWS, and save you a substantial amount of money. Although compression is not free performance-wise, and ZFS can be slower for some workloads, using local NVMe storage can compensate.

You can find some performance testing for ZFS on linux in this blog post: About ZFS Performance. Some benchmarks comparing EBS and local NVMe SSD storage (i3 instances) can be found in this blog post: Percona XtraDB Cluster on Amazon GP2 Volumes

MyRocks

Another option for compression would be using the MyRocks storage engine in Percona Server for MySQL, which provides compression.

Replication and using local volumes

As the local instance storage is ephemeral we need redundancy: we can use MySQL replication or Percona XtraDB cluster (PXC). In addition, we can use one replication slave—or we can attach a replication slave to PXC—and have it use EBS storage.

Local storage is not durable. If you stop the instance and then start it again, the local storage will probably disappear. (Though reboot is an exception, you can reboot the instance and the local storage will be fine.) In addition if the local storage disappears we will have to recreate MySQL local storage partition (for ZFS, i.e. zpool create or for EXT4/XFS, i.e. mkfs)

For example, using MySQL replication:

master - local storage (AZ 1, i.e. 1a)
-> slave1 - local storage (AZ 2, i.e. 1b)
-> slave2 - ebs storage (AZ 3, i.e. 1c)
   (other replication slaves if needed with local storage - optional)

MySQL Master AZ 1a, Local storage

Then we can use slave2 for ebs snapshots (if needed). This slave will be more expensive (as it is using EBS) but it can also be used to either serve production traffic (i.e. we can place smaller amount of traffic) or for other purposes (for example analytical queries, etc).

For Percona XtraDB cluster (PXC) we can just use 3 nodes, 1 in each AZ. PXC uses auto-provisioning with SST if the new node comes back blank. For MySQL replication we need some additional things:

  1. Failover from master to a slave if the master will go down. This can be done with MHA or Orchestrator
  2. Ability to clone slave. This can be done with Xtrabackup or ZFS snapshots (if using ZFS)
  3. Ability to setup a new MySQL local storage partition (for ZFS, i.e. zpool create or for EXT4/XFS, i.e. mkfs)

Other options

Here are some totally different options we could consider:

  1. Use IO1 volumes (as discussed). That can be way more expensive.
  2. Use local storage and MyRocks storage engine. However, switching to another storage engine is another bigger project and requires lots of testing
  3. Switch to AWS Aurora. That can be even more expensive for this particular case; and switching to aurora can be another big project by itself.

Conclusions

  1. Using EC2 i3 instances with local NVMe storage can increase performance and save money. There are some limitations: local storage is ephemeral and will disappear if the node has stopped. Reboot is fine.
  2. ZFS filesystem with compression enabled can decrease the storage requirements so that a MySQL instance will fit into local storage. Another option for compression could be to use InnoDB compression (row_format=compressed).

That may not work for everyone as it requires additional changes to the existing server provisioning: failover from master to a slave, ability to clone replication slaves (or use PXC), ability to setup a new MySQL local storage partition, using compression.

The post Using AWS EC2 instance store vs EBS for MySQL: how to increase performance and decrease cost appeared first on Percona Database Performance Blog.

How to set up a Replication User

$
0
0


A replication user is necessary to set up the relationship Primary/Replica. This is a short step but it needs a bit more of attention.

From the MySQL 5.7 documentation (highlights are my own):

Although you do not have to create an account specifically for replication, you should be aware that the replication user name and password are stored in plain text in the master info repository file or table (see Section 16.2.4.2, “Slave Status Logs”). Therefore, you may want to create a separate account that has privileges only for the replication process, to minimize the possibility of compromise to other accounts.

The following command specifically will allow replication from all databases and tables connecting from all hosts. For security reasons you may want to limit access to replication only to the IP address of the server doing the replication.

Log into the MySQL console using a user with GRANT privileges in the primary server and execute the following:

CREATE USER 'replication'@'%' IDENTIFIED BY 'mysupersecretpassword'
GRANT REPLICATION SLAVE ON *.* TO 'replication'@'%';

My advice is instead of using the % wildcard, set up the IP address of your primary.

This user will be added to the primary ’s MASTER_USER option, and in theory could be any user as long it also has REPLICATION SLAVE privileges. After that, the replica will connect to the primary and perform some kind of handshake with those credentials and if they match, theprimary will allow replication to occur.

See something wrong in this tutorial? Please don’t hesitate to message me through the comments or the contact page.

Database Security Monitoring for MySQL and MariaDB

$
0
0

Data protection is one of the most significant aspects of administering a database. Depending on the organizational structure, whether you are a developer, sysadmin or DBA, if you are managing the production database, you must monitor data for unauthorized access and usage. The purpose of security monitoring is twofold. One, to identify unauthorised activity on the database. And two, to check if databases ´and their configurations on a company-wide basis are compliant with security policies and standards.

In this article, we will divide monitoring for security in two categories. One will be related to auditing of MySQL and MariaDB databases activities. The second category will be about monitoring your instances for potential security gaps.

Query and connection policy-based monitoring

Continuous auditing is an imperative task for monitoring your database environment. By auditing your database, you can achieve accountability for actions taken or content accessed. Moreover, the audit may include some critical system components, such as the ones associated with financial data to support a precise set of regulations like SOX, or the EU GDPR regulation. Usually, it is achieved by logging information about DB operations on the database to an external log file.

By default, auditing in MySQL or MariaDB is disabled. You and achieve it by installing additional plugins or by capturing all queries with the query_log parameter. The general query log file is a general record of what MySQL is performing. The server records some information to this log when clients connect or disconnect, and it logs each SQL statement received from clients. Due to performance issues and lack of configuration options, the general_log is not a good solution for security audit purposes.

If you use MySQL Enterprise, you can use the MySQL Enterprise Audit plugin which is an extension to the proprietary MySQL version. MySQL Enterprise Audit Plugin plugin is only available with MySQL Enterprise, which is a commercial offering from Oracle. Percona and MariaDB have created their own open source versions of the audit plugin. Lastly, McAfee plugin for MySQL can also be used with various versions of MySQL. In this article, we will focus on the open source plugins, although the Enterprise version from Oracle seems to be the most robust and stable.

Characteristics of MySQL open source audit plugins

While the open source audit plugins do the same job as the Enterprise plugin from Oracle - they produce output with database query and connections - there are some major architectural differences.

MariaDB Audit Plugin – The MariaDB Audit Plugin works with MariaDB, MySQL (as of version 5.5.34 and 10.0.7) and Percona Server. MariaDB started including the Audit Plugin by default from versions 10.0.10 and 5.5.37, and it can be installed in any version from MariaDB 5.5.20. It is the only plugin that supports Oracle MySQL, Percona Server, and MariaDB. It is available on Windows and Linux platform. Versions starting from 1.2 are most stable, and it may be risky to use versions below that in your production environment.

McAfee MySQL Audit Plugin – This plugin does not use MySQL audit API. It was recently updated to support MySQL 5.7. Some tests show that API based plugins may provide better performance but you need to check it with your environment.

Percona Audit Log Plugin – Percona provides an open source auditing solution that installs with Percona Server 5.5.37+ and 5.6.17+ as part of the installation process. Comparing to other open source plugins, this plugin has more reach output features as it outputs XML, JSON and to syslog.

As it has some internal hooks to the server to be feature-compatible with Oracle’s plugin, it is not available as a standalone plugin for other versions of MySQL.

Plugin installation based on MariaDB audit extension

The installation of open source MySQL plugins is quite similar for MariaDB, Percona, and McAfee versions.
Percona and MariaDB add their plugins as part of the default server binaries, so there is no need to download plugins separately. The Percona version only officially supports it’s own fork of MySQL so there is no direct download from the vendor's website ( if you want to use this plugin with MySQL, you will have to obtain the plugin from a Percona server package). If you would like to use the MariaDB plugin with other forks of MySQL, then you can find it from https://downloads.mariadb.com/Audit-Plugin/MariaDB-Audit-Plugin/. The McAfee plugin is available at https://github.com/mcafee/mysql-audit/wiki/Installation.

Before you start the plugin installation, you can check if the plugin is present in the system. The dynamic plugin (doesn’t require instance restart) location can be checked with:

SHOW GLOBAL VARIABLES LIKE 'plugin_dir';

+---------------+--------------------------+
| Variable_name | Value                    |
+---------------+--------------------------+
| plugin_dir    | /usr/lib64/mysql/plugin/ |
+---------------+--------------------------+

Check the directory returned at the filesystem level to make sure you have a copy of the plugin library. If you do not have server_audit.so or server_audit.dll inside of /usr/lib64/mysql/plugin/, then more likely your MariaDB version is not supported and should upgrade it to latest version..

The syntax to install the MariaDB plugin is:

INSTALL SONAME 'server_audit';

To check installed plugins you need to run:

SHOW PLUGINS;
MariaDB [(none)]> show plugins;
+-------------------------------+----------+--------------------+--------------------+---------+
| Name                          | Status   | Type               | Library            | License |
+-------------------------------+----------+--------------------+--------------------+---------+
| binlog                        | ACTIVE   | STORAGE ENGINE     | NULL               | GPL     |
| mysql_native_password         | ACTIVE   | AUTHENTICATION     | NULL               | GPL     |
| mysql_old_password            | ACTIVE   | AUTHENTICATION     | NULL               | GPL     |
| wsrep                         | ACTIVE   | STORAGE ENGINE     | NULL               | GPL     |
| MRG_MyISAM                    | ACTIVE   | STORAGE ENGINE     | NULL               | GPL     |
| MEMORY                        | ACTIVE   | STORAGE ENGINE     | NULL               | GPL     |
| CSV                           | ACTIVE   | STORAGE ENGINE     | NULL               | GPL     |
| MyISAM                        | ACTIVE   | STORAGE ENGINE     | NULL               | GPL     |
| CLIENT_STATISTICS             | ACTIVE   | INFORMATION SCHEMA | NULL               | GPL     |
| INDEX_STATISTICS              | ACTIVE   | INFORMATION SCHEMA | NULL               | GPL     |
| TABLE_STATISTICS              | ACTIVE   | INFORMATION SCHEMA | NULL               | GPL     |
| USER_STATISTICS               | ACTIVE   | INFORMATION SCHEMA | NULL               | GPL     |
| PERFORMANCE_SCHEMA            | ACTIVE   | STORAGE ENGINE     | NULL               | GPL     |
| InnoDB                        | ACTIVE   | STORAGE ENGINE     | NULL               | GPL     |
| INNODB_TRX                    | ACTIVE   | INFORMATION SCHEMA | NULL               | GPL     |
| INNODB_LOCKS                  | ACTIVE   | INFORMATION SCHEMA | NULL               | GPL     |
| INNODB_LOCK_WAITS             | ACTIVE   | INFORMATION SCHEMA | NULL               | GPL     |
| INNODB_CMP                    | ACTIVE   | INFORMATION SCHEMA | NULL               | GPL     |
...
| INNODB_MUTEXES                | ACTIVE   | INFORMATION SCHEMA | NULL               | GPL     |
| INNODB_SYS_SEMAPHORE_WAITS    | ACTIVE   | INFORMATION SCHEMA | NULL               | GPL     |
| INNODB_TABLESPACES_ENCRYPTION | ACTIVE   | INFORMATION SCHEMA | NULL               | BSD     |
| INNODB_TABLESPACES_SCRUBBING  | ACTIVE   | INFORMATION SCHEMA | NULL               | BSD     |
| Aria                          | ACTIVE   | STORAGE ENGINE     | NULL               | GPL     |
| SEQUENCE                      | ACTIVE   | STORAGE ENGINE     | NULL               | GPL     |
| user_variables                | ACTIVE   | INFORMATION SCHEMA | NULL               | GPL     |
| FEEDBACK                      | DISABLED | INFORMATION SCHEMA | NULL               | GPL     |
| partition                     | ACTIVE   | STORAGE ENGINE     | NULL               | GPL     |
| rpl_semi_sync_master          | ACTIVE   | REPLICATION        | semisync_master.so | GPL     |
| rpl_semi_sync_slave           | ACTIVE   | REPLICATION        | semisync_slave.so  | GPL     |
| SERVER_AUDIT                  | ACTIVE   | AUDIT              | server_audit.so    | GPL     |
+-------------------------------+----------+--------------------+--------------------+---------+

If you need additional information, check the PLUGINS table in the information_schema database which contains more detailed information.

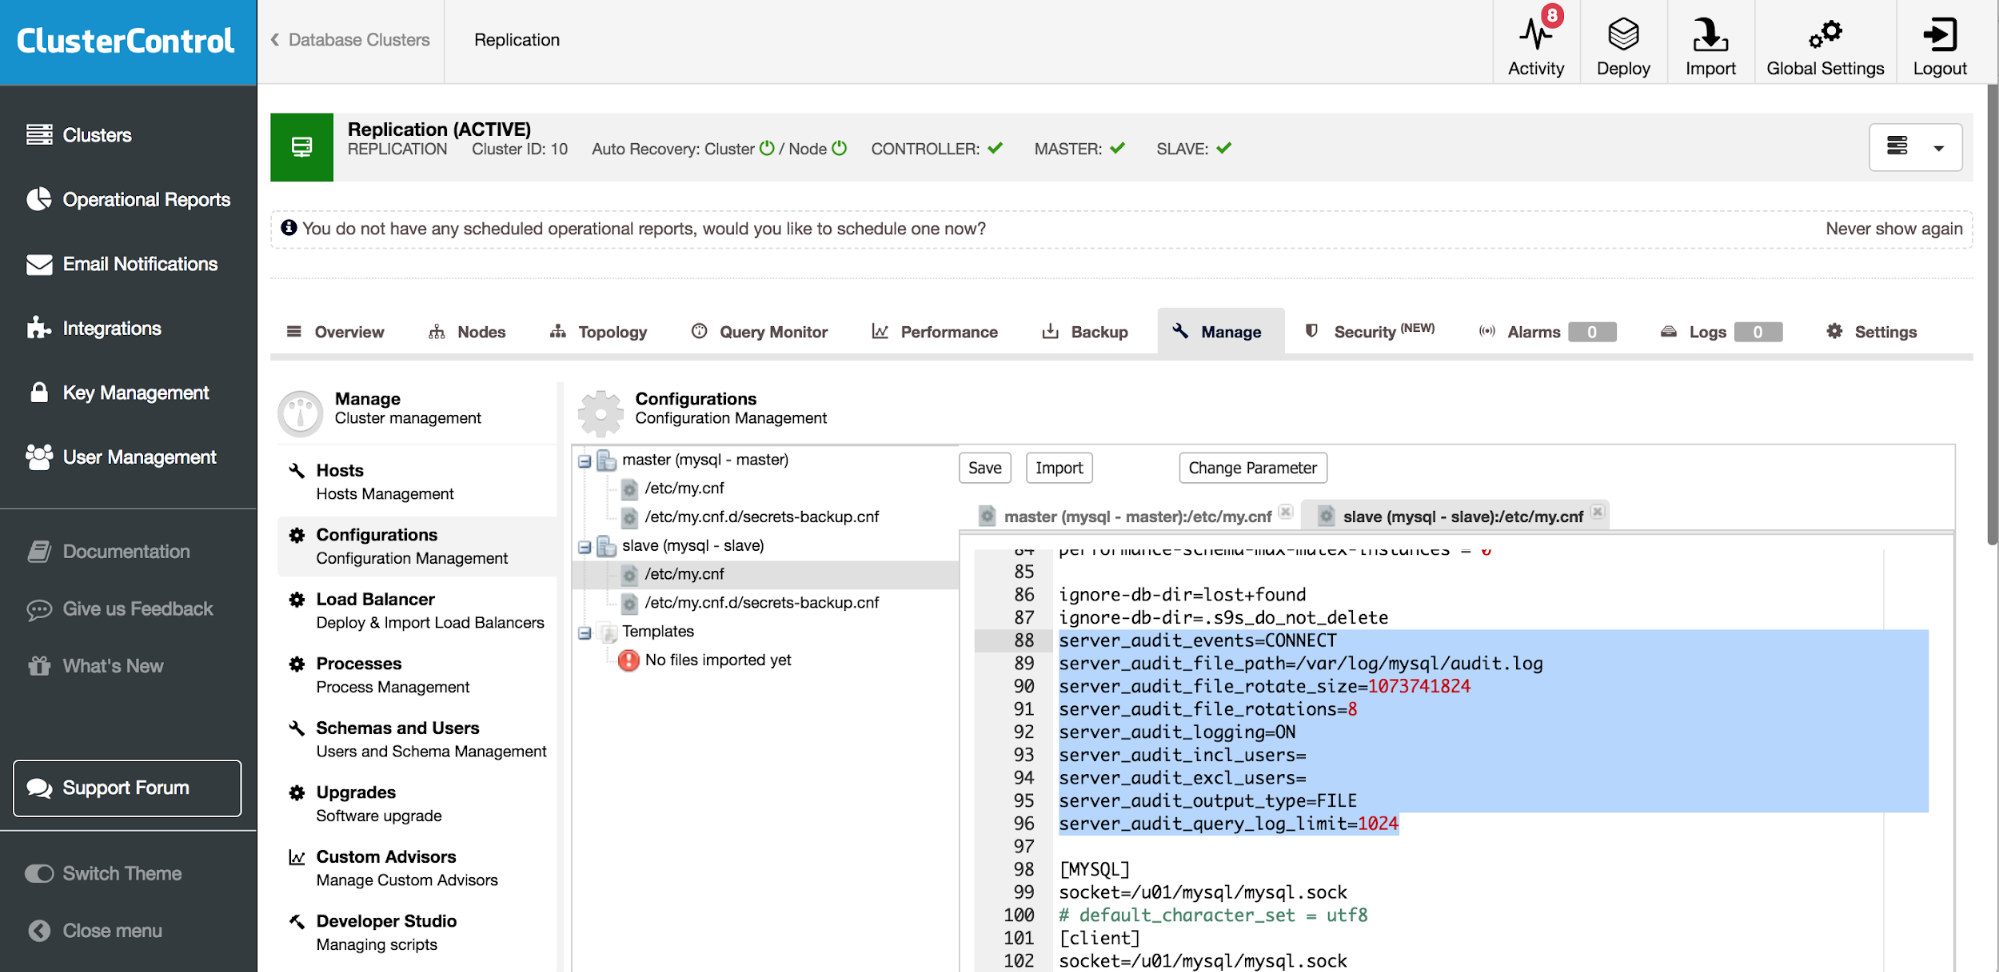
Another way to install the plugin is to enable the plugin in my.cnf and restart the instance. An example of a basic audit plugin configuration from MariaDB could be :

server_audit_events=CONNECT
server_audit_file_path=/var/log/mysql/audit.log
server_audit_file_rotate_size=1073741824
server_audit_file_rotations=8
server_audit_logging=ON
server_audit_incl_users=
server_audit_excl_users=
server_audit_output_type=FILE
server_audit_query_log_limit=1024

Above setting should be placed in my.cnf. Audit plugin will create file /var/log/mysql/audit.log which will rotate on size 1GB and there will be eight rotations until the file is overwritten. The file will contain only information about connections.

Currently, there are sixteen settings which you can use to adjust the MariaDB audit plugin.

server_audit_events
server_audit_excl_users
server_audit_file_path
server_audit_file_rotate_now
server_audit_file_rotate_size
server_audit_file_rotations
server_audit_incl_users
server_audit_loc_info
server_audit_logging
server_audit_mode
server_audit_output_type
Server_audit_query_log_limit
server_audit_syslog_facility
server_audit_syslog_ident
server_audit_syslog_info
server_audit_syslog_priority

Among them, you can find options to include or exclude users, set different logging events (CONNECT or QUERY) and switch between file and syslog.

To make sure the plugin will be enabled upon server startup, you have to set
plugin_load=server_audit=server_audit.so in your my.cnf settings. Such configuration can be additionally protected by server_audit=FORCE_PLUS_PERMANENT which will disable the plugin uninstall option.

UNINSTALL PLUGIN server_audit;

ERROR 1702 (HY000):
Plugin 'server_audit' is force_plus_permanent and can not be unloaded

Here is some sample entries produced by MariaDB audit plugin:

20180817 20:00:01,slave,cmon,cmon,31,0,DISCONNECT,information_schema,,0
20180817 20:47:01,slave,cmon,cmon,17,0,DISCONNECT,information_schema,,0
20180817 20:47:02,slave,cmon,cmon,19,0,DISCONNECT,information_schema,,0
20180817 20:47:02,slave,cmon,cmon,18,0,DISCONNECT,information_schema,,0
20180819 17:19:19,slave,cmon,cmon,12,0,CONNECT,information_schema,,0
20180819 17:19:19,slave,root,localhost,13,0,FAILED_CONNECT,,,1045
20180819 17:19:19,slave,root,localhost,13,0,DISCONNECT,,,0
20180819 17:19:20,slave,cmon,cmon,14,0,CONNECT,mysql,,0
20180819 17:19:20,slave,cmon,cmon,14,0,DISCONNECT,mysql,,0
20180819 17:19:21,slave,cmon,cmon,15,0,CONNECT,information_schema,,0
20180819 17:19:21,slave,cmon,cmon,16,0,CONNECT,information_schema,,0
20180819 19:00:01,slave,cmon,cmon,17,0,CONNECT,information_schema,,0
20180819 19:00:01,slave,cmon,cmon,17,0,DISCONNECT,information_schema,,0

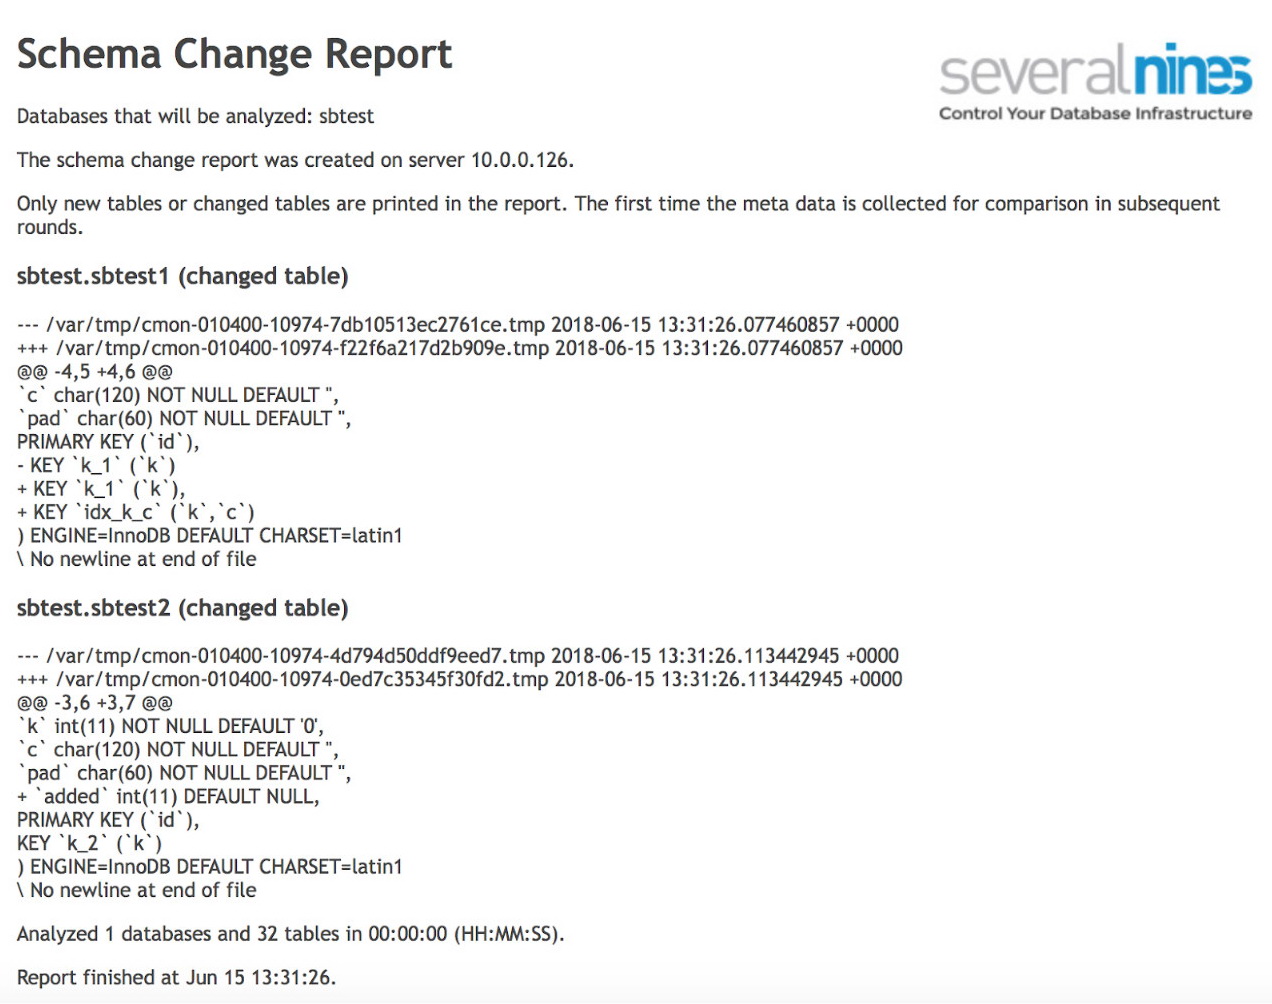
Schema changes report

If you need to track only DDL changes, you can use the ClusterControl Operational Report on Schema Change. The Schema Change Detection Report shows any DDL changes on your database. This functionality requires an additional parameter in ClusterControl configuration file. If this is not set you will see the following information: schema_change_detection_address is not set in /etc/cmon.d/cmon_1.cnf. Once that is in place an example output may be like below:

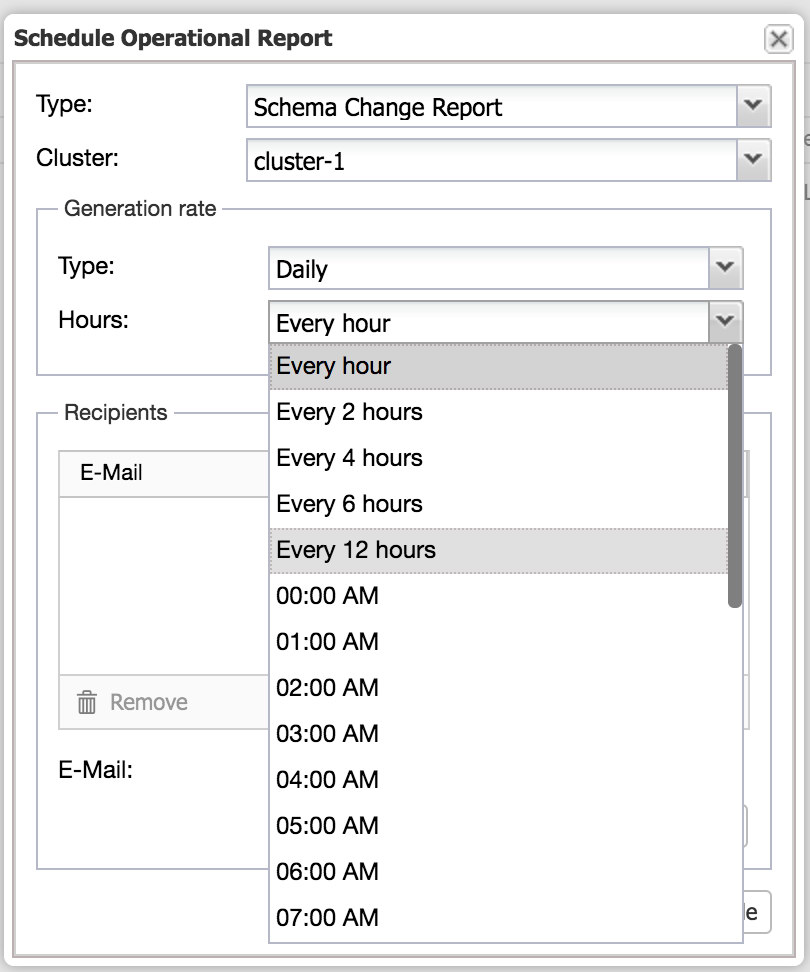
It can be set up with a schedule, and the reports emailed to recipients.

ClusterControl: Schedule Operational Report

MySQL Database Security Assessment

Package upgrade check

First, we will start with security checks. Being up-to-date with MySQL patches will help reduce risks associated with known vulnerabilities present in the MySQL server. You can keep your environment up-to-date by using the vendors’ package repository. Based on this information you can build your own reports, or use tools like ClusterControl to verify your environment and alert you on possible updates.

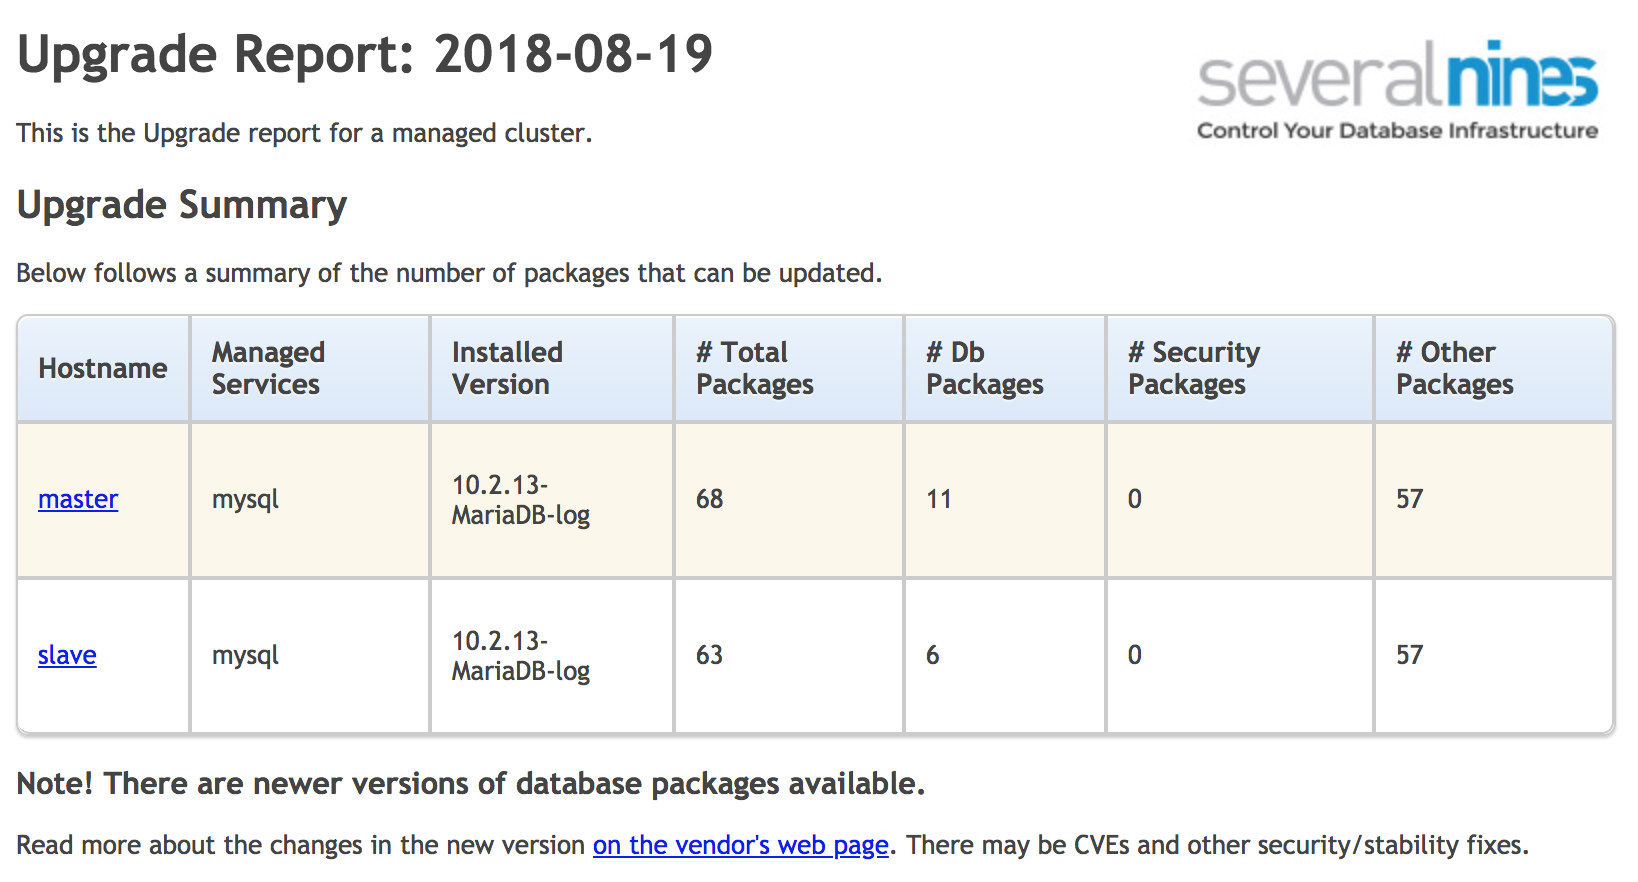
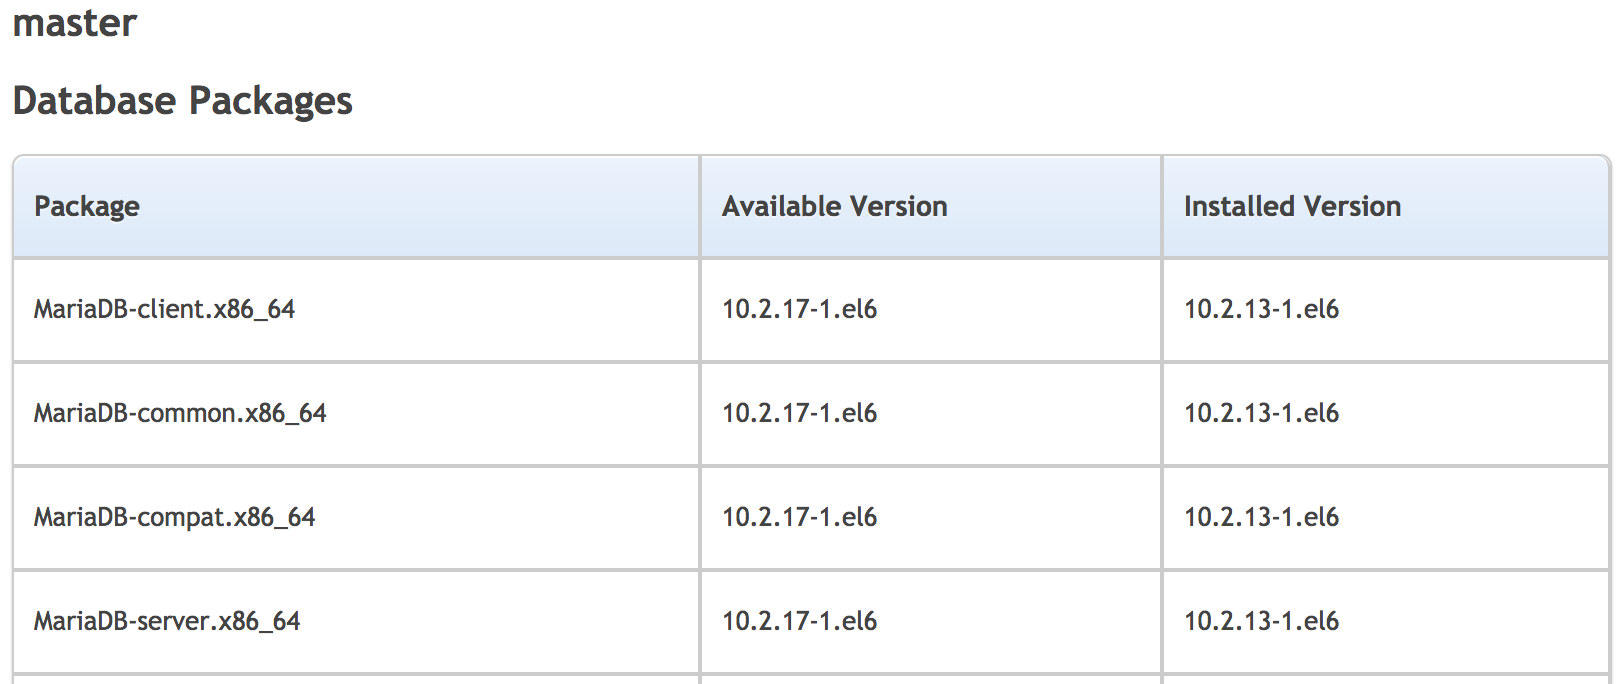
ClusterControl Upgrade Report gathers information from the operating system and compares them to packages available in the repository. The report is divided into four sections; upgrade summary, database packages, security packages, and other packages. You can quickly compare what you have installed on your system and find a recommended upgrade or patch.

ClusterControl: Upgrade Report
ClusterControl: Upgrade Report details

To compare them manually you can run

SHOW VARIABLES WHERE variable_name LIKE "version";

With security bulletins like:
https://www.oracle.com/technetwork/topics/security/alerts-086861.html
https://nvd.nist.gov/view/vuln/search-results?adv_search=true&cves=on&cpe_vendor=cpe%3a%2f%3aoracle&cpe_produ
https://www.percona.com/doc/percona-server/LATEST/release-notes/release-notes_index.html
https://downloads.mariadb.org/mariadb/+releases/
https://www.cvedetails.com/vulnerability-list/vendor_id-12010/Mariadb.html
https://www.cvedetails.com/vulnerability-list/vendor_id-13000/Percona.html

Or vendor repositories:

On Debian

sudo apt list mysql-server

On RHEL/Centos

yum list | grep -i mariadb-server

Accounts without password

Blank passwords allow a user to login without using a password. MySQL used to come with a set of pre-created users, some of which can connect to the database without password or, even worse, anonymous users. Fortunately, this has changed in MySQL 5.7. Finally, it comes only with a root account that uses the password you choose at installation time.

For each row returned from the audit procedure, set a password:

SELECT User,host
FROM mysql.user
WHERE authentication_string='';

Additionally, you can install a password validation plugin and implement a more secure policy:

INSTALL PLUGIN validate_password SONAME 'validate_password.so';

SHOW VARIABLES LIKE 'default_password_lifetime';
SHOW VARIABLES LIKE 'validate_password%';

An good start can be:

plugin-load=validate_password.so
validate-password=FORCE_PLUS_PERMANENT
validate_password_length=14
validate_password_mixed_case_count=1
validate_password_number_count=1
validate_password_special_char_count=1
validate_password_policy=MEDIUM

Of course, these settings will depend on your business needs.

Remote access monitoring

Avoiding the use of wildcards within hostnames helps control the specific locations from which a given user may connect to and interact with the database.

You should make sure that every user can connect to MySQL only from specific hosts. You can always define several entries for the same user, this should help to reduce a need for wildcards.

Execute the following SQL statement to assess this recommendation (make sure no rows are returned):

SELECT user, host FROM mysql.user WHERE host = '%';

Test database

The default MySQL installation comes with an unused database called test and the test database is available to every user, especially to the anonymous users. Such users can create tables and write to them. This can potentially become a problem on its own - and writes would add some overhead and reduce database performance. It is recommended that the test database is dropped. To determine if the test database is present, run:

SHOW DATABASES LIKE 'test';

If you notice that the test database is present, this could be that mysql_secure_installation script which drops the test database (as well as other security-related activities) was not executed.

LOAD DATA INFILE

If both server and client has the ability to run LOAD DATA LOCAL INFILE, a client will be able to load data from a local file to a remote MySQL server. The local_infile parameter dictates whether files located on the MySQL client's computer can be loaded or selected via LOAD DATA INFILE or SELECT local_file.

This, potentially, can help to read files the client has access to - for example, on an application server, one could access any data that the HTTP server has access to. To avoid it, you need to set local-infile=0 in my.cnf.

Execute the following SQL statement and ensure the Value field is set to OFF:

SHOW VARIABLES WHERE Variable_name = 'local_infile';

Monitor for non-encrypted tablespaces

Starting from MySQL 5.7.11, InnoDB supports data encryption for tables stored in file-per-table tablespaces. This feature provides at-rest encryption for physical tablespace data files. To examine if your tables have been encrypted run:

mysql> SELECT TABLE_SCHEMA, TABLE_NAME, CREATE_OPTIONS FROM INFORMATION_SCHEMA.TABLES
       WHERE CREATE_OPTIONS LIKE '%ENCRYPTION="Y"%';

+--------------+------------+----------------+
| TABLE_SCHEMA | TABLE_NAME | CREATE_OPTIONS |
+--------------+------------+----------------+
| test         | t1         | ENCRYPTION="Y" |
+--------------+------------+----------------+

As a part of the encryption, you should also consider encryption of the binary log. The MySQL server writes plenty of information to binary logs.

Encryption connection validation

In some setups, the database should not be accessible through the network if every connection is managed locally, through the Unix socket. In such cases, you can add the ‘skip-networking’ variable in my.cnf. Skip-networking prevents MySQL from using any TCP/IP connection, and only Unix socket would be possible on Linux.

However this is rather rare situation as it is common to access MySQL over the network. You then need to monitor that your connections are encrypted. MySQL supports SSL as a means to encrypting traffic both between MySQL servers (replication) and between MySQL servers and clients. If you use Galera cluster, similar features are available - both intra-cluster communication and connections with clients can be encrypted using SSL. To check if you use SSL encryption run the following queries:

SHOW variables WHERE variable_name = 'have_ssl'; 
select ssl_verify_server_cert from mysql.slave_master_info;

That’s it for now. This is not a complete list, do let us know if there are any other checks that you are doing today on your production databases.


ProxySQL Series : Percona Cluster/MariaDB Cluster (Galera) Read-write Split

$
0
0

ProxySQL is the most preferred and is widely used for load-balancing MySQL workload, thanks to Rene Cannon & Team for the great tool, and kudos on the recent release of ProxySQL 1.4.10, with a lot of bug fixes. ProxySQL is simple in design, lightweight, highly efficient and feature rich, We have been working with ProxySQL in production for our client quite a sometime, we have also shared some of our encounters/experience and use cases in the below blogs.

In this blog, we will see how to setup ProxySQL for Percona XtraDB cluster with the READ-WRITE split with Failover handling for various node states with Galera. PXC / MariaDB Clusters really works better with writes on single ode than multi node writes. That makes the read/write split up ideal for PXC. Application benefits a lot with PXC /MariaDB Cluster as they avail synchronous reads and High availability with these clusters.

For the purpose of this blog I have set up a three node cluster as below

Operating System: Centos 7.4
Cluster version : Percona XtraDB cluster 5.7.21
ProxySQL version : proxysql-1.4.8-1.1.el7.x86_64
ProxySQLNode : 192.168.33.11
Node1 : 192.168.33.12
Node2 : 192.168.33.13
Node 3: 192.168.33.14

Setting up the cluster is beyond the scope of this, I will just directly move to proxySQL setup for a cluster in Single-writer mode, Which is the most recommended for Cluster to avoid of conflicts of writes and split-Brain scenarios.

Architecture

Installing ProxySQL:

Easy and robust way to have install proxySQL is by using the percona repo, because it comes with tool/scripts such as proxysql-admin and proxysql_galera_checker, which helps in the easy configuration, monitoring of cluster and also fail-over

#yum install http://www.percona.com/downloads/percona-release/redhat/0.1-4/percona-release-0.1-4.noarch.rpm

#yum install proxysql-1.4.8-1.1.el7.x86_64 -y
#chkconfig proxysql on (enabling service at startup)
# service proxysql start

Now proxysql is up and running on the node 192.168.33.11 and listening on ports 6032 for proxysql admin interface and 6033 for MySQL interface by default, They can be changed if needed

Adding Cluster Nodes to proxySQL

Now connect to proxySQL as below

$ mysql -u admin -padmin -h 127.0.0.1 -P6032

In this setup we will be using two hostgroups

Hostgroup 10 (writer group)
Hostgroup 11 (Reader group)

mysql> INSERT INTO mysql_servers(hostgroup_id, hostname, port,weight,comment) VALUES (10,'192.168.33.12',3306,1000000,'WRITE');
Query OK, 1 row affected (0.00 sec)

mysql> INSERT INTO mysql_servers(hostgroup_id, hostname, port,weight,comment) VALUES (11,'192.168.33.13',3306,1000,'READ');
Query OK, 1 row affected (0.00 sec)

mysql> INSERT INTO mysql_servers(hostgroup_id, hostname, port,weight,comment) VALUES (11,'192.168.33.14',3306,1000,'READ');
Query OK, 1 row affected (0.00 sec)

mysql> load mysql servers to runtime;
Query OK, 0 rows affected (0.00 sec)

mysql> save mysql servers to disk;
Query OK, 0 rows affected (0.03 sec)

Which looks as below

mysql> SELECT * FROM mysql_servers;
+--------------+---------------+------+--------+--------+-------------+-----------------+---------------------+---------+----------------+---------+
| hostgroup_id | hostname | port | status | weight | compression | max_connections | max_replication_lag | use_ssl | max_latency_ms | comment |
+--------------+---------------+------+--------+--------+-------------+-----------------+---------------------+---------+----------------+---------+
| 10 | 192.168.33.12 | 3306 | ONLINE | 1000000 | 0 | 1000 | 0 | 0 | 0|WRITE |
| 11 | 192.168.33.13 | 3306 | ONLINE | 1000 | 0 | 1000 | 0 | 0 | 0 |READ |
| 11 | 192.168.33.14 | 3306 | ONLINE | 1000 | 0 | 1000 | 0 | 0 | 0 |READ |
+--------------+---------------+------+--------+--------+-------------+-----------------+---------------------+---------+----------------+---------+

Query Rules:

Query rules will be important for query routing with proxySQL, incoming query pattern will be matched based on which it will be routed to the hostgroup accordingly, here I will be using the default and basic query rules for Read-Write splitting as below,

INSERT INTO mysql_query_rules (rule_id,active,match_pattern,destination_hostgroup,apply) VALUES (1,1,'^SELECT.*FOR UPDATE$',10,1), (2,1,'^SELECT',11,1);
Query OK, 2 rows affected (0.00 sec)

mysql> load mysql query rules to runtime;
Query OK, 0 rows affected (0.00 sec)

mysql> save mysql query rules to disk;
Query OK, 0 rows affected (0.01 sec)

Now the query rules are added.

Integrating Application user:

Now it’s time to add embed application user into proxySQL through which application connects via proxysql, here I have assigned the default host group for the user as 10 writer group, when an incoming query without a matching pattern in a query rule, it routes automatically to the default hostgroup ie., 10

INSERT INTO mysql_users (username,password,default_hostgroup) VALUES ('app_user','application_user',10);
Query OK, 0 rows affected (0.00 sec)

mysql> load mysql users to runtime;
Query OK, 0 rows affected (0.00 sec)

mysql> save mysql users to disk;
Query OK, 0 rows affected (0.01 sec)

Application user now is loaded and kept ready.

ProxySQL Monitoring:

Proxysql Monitors the node, added under it by making checks at regular interval, you can enable the monitoring as below,

mysql> UPDATE global_variables SET variable_value="monitor" WHERE variable_name="mysql-monitor_username";
Query OK, 1 row affected (0.00 sec)

mysql> UPDATE global_variables SET variable_value="monitor" WHERE variable_name="mysql-monitor_password";
Query OK, 1 row affected (0.00 sec)

mysql> LOAD MYSQL VARIABLES TO RUNTIME;
Query OK, 0 rows affected (0.00 sec)

mysql> SAVE MYSQL VARIABLES TO DISK;
Query OK, 94 rows affected (0.00 sec)

Monitor check:

mysql> SELECT * FROM monitor.mysql_server_connect_log ORDER BY time_start_us DESC LIMIT 5;
+---------------+------+------------------+-------------------------+---------------+
| hostname | port | time_start_us | connect_success_time_us | connect_error |
+---------------+------+------------------+-------------------------+---------------+
| 192.168.33.14 | 3306 | 1534068625859885 | 1452 | NULL |
| 192.168.33.13 | 3306 | 1534068625849598 | 1392 | NULL |
| 192.168.33.12 | 3306 | 1534068625838742 | 1505 | NULL |
| 192.168.33.14 | 3306 | 1534068565850089 | 1389 | NULL |
| 192.168.33.13 | 3306 | 1534068565839890 | 1713 | NULL |
+---------------+------+------------------+-------------------------+---------------+

It shows that proxySQL is able to connect to all the nodes.

Scheduler:

Here we come to the important aspect of the configuration, With cluster, we have different node states (1-4) , in any state comment beyond SYNCED , these node state switches are tracked by proxySQL health checks ( Monitoring Galera ).  And it routes the traffic accordingly with the help of  scheduler scripts.

Scheduler with help of the proxysql_galera_checker script checks the node states in a periodic configurable interval (ms), When a node state change is detected, It makes changes to the Hostgroup and takes the nodes out of traffic accordingly. An advanced scheduler was written by Marco Tusa is on his github ( proxy_sql_tools ).

For instance, if the writer node goes down, the scheduler script promotes a node from reader group to accept the writes, and when the node comes back online and add it back to hostgroup, The change is very quick that application doesn’t notice any interruption

INSERT INTO scheduler(id,active,interval_ms,filename,arg1,arg2,arg3,arg4,arg5) VALUES (1,'1','500','/usr/bin/proxysql_galera_checker','10','11','0','1', '/var/lib/proxysql/proxysql_galera_checker.log');
Query OK, 1 row affected (0.00 sec)

mysql> LOAD SCHEDULER TO RUNTIME;SAVE SCHEDULER TO DISK;
Query OK, 0 rows affected (0.00 sec)

mysql> select * from scheduler\G
*************************** 1. row ***************************
id: 1
active: 1
interval_ms: 3000                      #check interval in Ms
filename: /bin/proxysql_galera_checker #Check script
arg1: 10                               # Writer group
arg2: 11                               # Reader group
arg3: 0                                # No of writers
arg4: 1                                # Writers are readers
Arg5:/var/lib/proxysql/mycluster_proxysql_galera_check.log  #log file
comment: mycluster
1 row in set (0.00 sec)

Scheduler start checking immediately and writes the status to log as below

Logs:

[2018-07-15 08:24:11] log file /var/lib/proxysql/mycluster_proxysql_galera_check.log
[2018-07-15 08:24:11] ###### HANDLE WRITER NODES ######
[2018-07-15 08:24:12] --> Checking WRITE server 10:192.168.33.12:3306, current status ONLINE, wsrep_local_state 4
[2018-07-15 08:24:12] ###### HANDLE READER NODES ######
[2018-07-15 08:24:12] --> Checking READ server 11:192.168.33.13:3306, current status ONLINE, wsrep_local_state 4
[2018-07-15 08:24:12] server 11:192.168.33.13:3306 is already ONLINE
[2018-07-15 08:24:12] --> Checking READ server 11:192.168.33.14:3306, current status ONLINE, wsrep_local_state 4
[2018-07-15 08:24:12] server 11:192.168.33.14:3306 is already ONLINE
[2018-07-15 08:24:12] ###### SUMMARY ######
[2018-07-15 08:24:12] --> Number of writers that are 'ONLINE': 1 : hostgroup: 10
[2018-07-15 08:24:12] --> Number of readers that are 'ONLINE': 2 : hostgroup: 11

Now the setup is complete, with Read/Write split and failover, Now we will proceed to test Read-write Split

I will be using the below command snippet to watch the connection and failover scenarios

# watch -n 1 'mysql -h 127.0.0.1 -P 6032 -uadmin -padmin -t -e "select * from stats_mysql_connection_pool where hostgroup in (10,11) order by hostgroup,srv_host ;" -e " select hostgroup_id,hostname,status,weight,comment from mysql_servers where hostgroup_id in (10,11) order by hostgroup_id,hostname ;"'
+-----------+---------------+----------+--------+----------+----------+--------+---------+---------+-----------------+---------
-------+------------+
| hostgroup | srv_host | srv_port | status | ConnUsed | ConnFree | ConnOK | ConnERR | Queries | Bytes_data_sent | Bytes_data_recv | Latency_us |
+-----------+---------------+----------+--------+----------+----------+--------+---------+---------+-----------------+-----------------+------------+
| 10 | 192.168.33.12 | 3306 | ONLINE | 0 | 0 | 0 | 0 | 0 | 0 | 0 | 604 |
| 11 | 192.168.33.13 | 3306 | ONLINE | 0 | 0 | 0 | 0 | 0 | 0 | 0 | 509 |
| 11 | 192.168.33.14 | 3306 | ONLINE | 0 | 0 | 0 | 0 | 0 | 0 | 0 | 601 |
+-----------+---------------+----------+--------+----------+----------+--------+---------+---------+-----------------+-----------------+------------+

+--------------+---------------+--------+---------+---------+
| hostgroup_id | hostname | status | weight | comment       |
+--------------+---------------+--------+---------+---------+
| 10 | 192.168.33.12 | ONLINE | 1000000 | WRITE             |
| 11 | 192.168.33.13 | ONLINE | 1000    | READ              |
| 11 | 192.168.33.14 | ONLINE | 1000    | READ              |
+--------------+---------------+--------+---------+---------+

Read/Write testing:

Only write test with sysbench.

sysbench --test='/usr/share/sysbench/oltp_update_index.lua' --table-size=1000000 --mysql-host=192.168.33.11 --mysql-db='sbtest' --mysql-user=app_user --mysql-password='application_user' --mysql-port=6033 --time=60 --threads=4 --db-driver=mysql run

ProxySQL stats:

+-----------+---------------+----------+--------+----------+----------+--------+---------+---------+-----------------+-----------------+------------+
| hostgroup | srv_host | srv_port | status | ConnUsed | ConnFree | ConnOK | ConnERR | Queries | Bytes_data_sent | Bytes_data_recv | Latency_us |
+-----------+---------------+----------+--------+----------+----------+--------+---------+---------+-----------------+-----------------+------------+
| 10 | 192.168.33.12 | 3306 | ONLINE | 0 | 4 | 4 | 0 | 29326 | 703876 | 0 | 0 |
| 11 | 192.168.33.13 | 3306 | ONLINE | 0 | 0 | 0 | 0 | 0 | 0 | 0 | 0 |
| 11 | 192.168.33.14 | 3306 | ONLINE | 0 | 0 | 0 | 0 | 0 | 0 | 0 | 0 ||
+-----------+---------------+----------+--------+----------+----------+--------+---------+---------+-----------------+-----------------+------------+

As you can see the queries stats getting changed for the writer group and the readers do not receive any writes.

Read ( Select ) test:

Simulating a readonly primary key based ( select ) on cluster with sysbench.

# sysbench --test='/usr/share/sysbench/oltp_point_select.lua' --table-size=1000000 --mysql-host=192.168.33.11 --mysql-db='sbtest' --mysql-user=app_user --mysql-password='application_user' --mysql-port=6033 --time=60 --threads=4 --db-driver=mysql run

ProxySQL stats:

+-----------+---------------+----------+--------+----------+----------+--------+---------+---------+-----------------+-----------------+------------+
| hostgroup | srv_host | srv_port | status | ConnUsed | ConnFree | ConnOK | ConnERR | Queries | Bytes_data_sent | Bytes_data_recv | Latency_us |
+-----------+---------------+----------+--------+----------+----------+--------+---------+---------+-----------------+-----------------+------------+
| 10 | 192.168.33.12 | 3306 | ONLINE | 0 | 4 | 4 | 0 | 29326 | 703876 | 0 | 0 |
| 11 | 192.168.33.13 | 3306 | ONLINE | 0 | 3 | 3 | 0 | 95848 | 2300380 | 5731992 | 0 |
| 11 | 192.168.33.14 | 3306 | ONLINE | 0 | 3 | 3 | 0 | 96929 | 2326324 | 5818176 | 0 |
+-----------+---------------+----------+--------+----------+----------+--------+---------+---------+-----------------+-----------------+------------+

Now you can see the change of query count in our reader hostgroup comparing the previous result.

In the next blog we will see about the switch over and fail-over with cluster using proxySQL

Image Courtesy:Photo by Tim Gouw on Unsplash

Apress Blog About MySQL Connector/Python

$
0
0

Apress have been kind enough to invite me to write a blog in connection with my recently released book MySQL Connector/Python Revealed. I chose to write an introduction of MySQL Connector/Python including three examples illustrating the APIs and the difference between querying SQL tables and a JSON document store.

You can read the whole post at Apress’ blog.

MySQL NDB Cluster: Never Install a Management Node on the Same Host as a Data Node

$
0
0

In MySQL NDB Cluster, the management node (ndb_mgmd) is a lightweight process that among other things handles the configuration of the cluster. Since it is lightweight. It can be tempting to install it with one of the other nodes. However, if you want a high-availability setup, you should never install it on the same host as a data node (ndbd or ndbmtd). If you do that, it can cause a total cluster outage where the cluster could otherwise have survived.

The first sign of trouble occurs when you start the management nodes. The following warning is printed to standard output:

2018-08-22 18:04:14 [MgmtSrvr] WARNING  -- at line 46: Cluster configuration warning:
  arbitrator with id 49 and db node with id 1 on same host 192.0.2.1
  arbitrator with id 50 and db node with id 2 on same host 192.0.2.2
  Running arbitrator on the same host as a database node may
  cause complete cluster shutdown in case of host failure.

To understand why this setup can cause a complete cluster shutdown, it is necessary first to review how a node failure is handled in MySQL NDB Cluster.

Node Failure Handling

When a data node fails, the cluster automatically evaluates whether it is safe to continue. A node failure can in this respect be either that a data node crashes or there is a network outage meaning one or more nodes cannot be seen by the other nodes.

A clean node shutdown (such as when using the recommended STOP command in the management client) is not subject to the evaluation as the other nodes will be notified of the shutdown.

So, how does MySQL NDB Cluster decide whether, the cluster can continue after a node failure or not? And if there are two halves, which one gets to continue?
Assuming two replicas (NoOfReplicas = 2), the rules are quite simple. To quote Pro MySQL NDB Cluster:

In short, data nodes are allowed to continue if the following conditions are true:
  • The group of data nodes holds all the data.
  • Either more than half the data nodes are in the group or the group has won the arbitration process.

For the group of data nodes to hold all the data, there must be one data node from each node group available. A node group is a group of NoOfReplicas nodes that share data. The arbitration process refers to the process of contacting the arbitrator (typically a management node) – the first half to make contact will remain online.

This is all a bit abstract, so let’s take a look at a couple of examples.

Examples

Consider a cluster with two data nodes and two management nodes. Most of the examples will have a management node installed on each of the hosts with the data nodes. The last example will as contrast have the management nodes on separate hosts.

The starting point is thus a cluster using two hosts each with one data node and one management node as shown in this figure:

A healthy cluster with two data nodes and the management nodes installed on the same hosts as the data nodes.

The green colour represents that the data node is online. The blue colour for the management node with Node Id 49 is the arbitrator, and the yellow management node is on standby.

This is where the problem with the setup starts to show up. The arbitrator is the node that is involved when there is exactly half the data nodes available after a node failure. In that case, the data node(s) will have to contact the arbitrator to confirm whether it is OK to continue. This avoids a split-brain scenario where there are two halves with all the data; in that case it is imperative that one half is shut down or the data can start to diverge. The half that is first to contact the arbitrator survives, the other is killed (STONITH – shoot the other node in the head).

So, let’s look at a potential split-brain scenario.

Split-Brain Scenario

A split-brain scenario can occur when the network between the two halves of the cluster is lost as shown in the next figure:

NDB Cluster with network failure but the cluster survives.

In this case the network connection between the two hosts is lost. Since both nodes have all data, it is necessary with arbitration to decide who can continue. The data node with Id 1 can still contact the arbitrator as it is on the same host, but Node Id 2 cannot (it would need to use the network that is down). So, Node Id 1 gets to continue whereas Node Id 2 is shut down.

So far so good. This is what is expected. A single point of failure does not lead to a cluster outage. However, what happens if we instead of a network failure considers a complete host failure?

Host Failure

Consider now a case where there is a hardware failure on Host A or someone by accident pulls the power. This causes the whole host to shut down taking both the data and management node with it. What happens in this case?

The first thought is that it will not be an issue. Node Id 2 has all the data, so surely it will continue, right? No, that is not so. The result is a total cluster outage as shown in the following figure:

The failure of the host with the arbitrator causes complete cluster outage.

Why does this happen? When Host A crashes, so does the arbitrator management node. Since Node Id 2 does not on its own constitute a majority of the data nodes, it must contact the arbitrator to be allowed to remain online.

You may think it can use the management node with Node Id 50 as the arbitrator, but that will not happen: while handling a node failure, under no circumstances can the arbitrator be changed. The nodes on Host B cannot know whether it cannot see the nodes on Host A because of a network failure (as in the previous example) or because the nodes are dead. So, they have to assume the other nodes are still alive or there would sooner or later be a split-brain cluster with both halves online.

Important: The arbitrator will never change while the cluster handles a node failure.

So, the data node with Id 2 has no other option than to shut itself down, and there is a total cluster outage. A single point of failure has caused a total failure. That is not the idea of a high availability cluster.

What could have been done to prevent the cluster outage? Let’s reconsider the case where the arbitrator is on a third independent host.

Arbitrator on Independent Host

The picture changes completely, if the management nodes are installed on Hosts C and D instead of Hosts A and B. For simplicity the management node with Node Id 50 is left out as it is anyway just a spectator while handling the node failure. In this case the scenario is:

The failure of the host with the arbitrator on a third host ensures the cluster remains online.

Here Node Id 2 can still contact the arbitrator. Node Id 1 is dead, so it will not compete to win the arbitration, and the end result becomes that Node Id 2 remains online. The situation is back where a single point of failure does not bring down the whole cluster.

Conclusion

If you want your cluster to have the best chance of survival if there is a problem with one of the hosts, never install the management nodes on the same hosts as where there are data nodes. One of the management nodes will also act as the arbitrator. Since the arbitrator cannot change while the cluster is handling a node failure, if the host with the arbitrator crashes, it will cause a complete cluster shutdown if arbitration is required.

When you consider what is a host, you should look at physical hosts. Installing the management node in a different virtual machine on the same physical host offers only little extra protection compared to the case where they are installed in the same virtual host or on the same host using bare metal.

So, to conclude: make sure your management nodes are on a completely different physical host compared to your data nodes.

Want to Know More?

The book Pro MySQL NDB Cluster (published by Apress) by Mikiya Okuno and me includes lots of information about designing your cluster and how MySQL NDB Cluster works.

Disclaimer: I am one of the authors of Pro MySQL NDB Cluster.

What’s new in MariaDB 10.3

$
0
0

What’s New in MariaDB 10.3

Let me start with an announcement: From now on, MariaDB is being treated as a distinct database on modern-sql.com.

The reason for the inclusion in my club of major SQL databases0 is simple: Although MariaDB was originally described as a “branch of MySQL that is, on the user level, compatible with the main version”1, both versions have diverged considerably in the past few years. At first, the differences were mostly limited to operative aspects (including some legal aspects). Over the last two years, even the SQL dialects started to diverge notably. Treating MariaDB as a distinct product is the unavoidable consequence for me.

Furthermore, MariaDB’s popularity is still growing2 and it seems that the MariaDB team is finally embracing the SQL standard. I must actually say that “they now embrace modern SQL standards”—not the SQL-92 standard that’s been overhauled six times.3

The release of MariaDB 10.3 demonstrates this in an impressive way. Read on to see what I mean.

System-Versioned Tables

Have you ever had the requirement to keep the old data when using update or delete? Pretty much every business application needs that—e.g. for customer master data. System-versioned tables is one of the standard SQL features that get’s it done.4

The SQL standard uses closed-open intervals5—stored in “from” and “to” timestamp columns—to denote the period in which each row is valid. The “system” in system-versioned tables means that those time stamps are automatically maintained by the database whenever you write to such a table. System versioning is meant to be transparent for the application.

The syntax to create system-versioned tables looks like this:

CREATE TABLE … (
  [ regular columns and constraints ]
  
, valid_from TIMESTAMP(6) GENERATED ALWAYS AS ROW START NOT NULL
, valid_to   TIMESTAMP(6) GENERATED ALWAYS AS ROW END   NOT NULL

, PERIOD FOR SYSTEM_TIME (valid_from, valid_to)
) WITH SYSTEM VERSIONING

As you can see, it explicitly adds two columns to hold the validity time stamps. These are basically regular columns, and are visible to the user.6 That is the only required change that is not transparent to select and data-modifying statements. Next, the time stamps are logically combined into a period called system_time. Finally, the with system versioning clause enables the magic.

Of course you can also alter existing tables to add system versioning. If you already have the validity stored as an closed-open interval, you can use it right away.

Once enabled, system versioning maintains the columns in the system_time period automatically. That means that delete doesn’t actually remove anything. It just sets the end of the validity of the affected rows to the transaction time.7Update does the same, but it also adds new rows with the modified data and the transaction time as the start of validity. Once again, update is basically delete and insert.


Note

The SQL standard does not specify how system-versioned tables store the data physically, nor does it define data retention mechanisms.

MariaDB keeps the old data in the same table by default. However, partitioning capabilities have been enhanced so you can physically separate the current data from the old one.


When you select from a system-versioned table you’ll just get the current data. To access old data, the syntax of the from clause was extended:

FROM <table> FOR SYSTEM_TIME [ AS OF <ts>
                             | BETWEEN <ts> AND <ts>
                             | FROM <ts> TO <ts> ]
          [ [AS] <new name> ]

The new for system_time clause immediately follows the table name in the from clause—i.e. a new table (AS <new name>) follows at the very end.

Of course the as of clause delivers the data as of the specified time. Between and from take two time stamps. The difference between them is that between included the upper bound while from excludes it. The lower bound is exclusive for both of them.8

Further reading:

Availability of System-Versioned Tables

The Values Clause

The values clause is probably the most basic SQL feature at all. Most people know about it from its use in the insert statement. However, the values clause is actually a concept in its own right that’s also useful outside of insert.

The values clause is the standard SQL approach to select without from. In addition to that, the values clause has the big advantage that it can easily create multiple rows in one go:

VALUES (<columns of row 1>)
     , (<columns of row 2>)
     ,  …

There is no need to union all multiple select statements.

In comparison to select without from, the values clause has a drawback too: it cannot assign names to its columns. You need to use from clause column renaming or the with clause for that.

SELECT *
  FROM ( VALUES ('a', 'b') ) t(a,b)

Unfortunately, MariaDB 10.3 does not support the from clause renaming shown above. It remains the with clause, which is somewhat bulky for this case.

Another problem with the values clause is its lack of support in many databases. Even though MariaDB 10.3 now supports the values clause, select without from still has better support among the tested databases.

Further reading:

Availability of full VALUES functionality

Sequence Generators

“A sequence generator is a mechanism for generating successive exact numeric values, one at a time.”9 They are similar to identity columns, but they are not tied to an insert operation on a specific table so that they can be used for arbitrary purposes. The next value for <sequence name> expression is used to obtain a new value.

Naturally, sequence generator can be used in a stand-alone values statement to fetch a new value.

VALUES (NEXT VALUE FOR <sequence name>)

Further reading:

Availability of Sequence Generators

Percentile_disc and Percentile_cont

The percentile_disc and percentile_cont functions are used to get a percentile value—e.g. the median—from an ordered set of values.

In standard SQL these functions require the within group clause and optionally accept an over clause. However, in MariaDB 10.3 the over clause is also required.

PRECENTILE_DISC (0.5) WITHIN GROUP (ORDER BY x) OVER …

The difference between these two functions is how they cope with a case in which the specified percentile falls in between two rows. For example, when the middle row—holding the median value—out of four rows is needed.

Percentile_disc always returns a discrete value from the input data—even if the specified percentile falls between two rows. In that case, it returns the first one with respect to the specified order by clause. Percentile_cont, on the other hand, performs a weighted linear interpolation between the two values of the adjacent rows.

MariaDB 10.3 also added the proprietary median(x) function, which is a different syntax for percentile_disc(0.5) within group (order by x).

Further reading:

Availability of Inverse Distribution Functions

Intersect and Except

Intersect and except are table operators similar to union. Instead of concatenating two tables, they produce the intersection and the difference, respectively.

Further reading:

Availability of INTERSECT and EXCEPT functionality

Two-Phase Processing of Update’s Set Clause

This is best explained by example. Have a close look at this query.

UPDATE …
   SET c1 = c2
     , c2 = c1

Note that both columns appear on both sides of the assignment operator (=)—i.e. both columns are read and changed in the same statement.

In this case, the SQL standard requires that all read operations are effectively completed before the first writing. You can think of it as a read-only phase in which all right-hand side expressions are evaluated, followed by a write-only phase, which actually stores the results. If this rule is obeyed, the statement above exchanges the values in the c1 and c2 columns.

Nonetheless the default behavior in MariaDB (including 10.3) as well as in MySQL is different. They execute the set clauses in the order they appear in the statement. Thus the result of the above query is that both columns contain the value previously stored in c2.

The new SIMULTANEOUS_ASSIGNMENT mode introduced with MariaDB 10.3 activates standard-conforming handling of this case.

SET sql_mode = (SELECT CONCAT( @@sql_mode
                             , ',SIMULTANEOUS_ASSIGNMENT'
                             )
               )

Further reading:

Two-phase execution of UPDATE's SET clause

Self-Referencing Update and Delete

This is very similar to the previous topic. The main difference is that previous issue deals with cyclic references between columns of the same row, whereas this issue is about cyclic references between different rows of the same table.

The problem can appear when a data-modifying statement has a query—e.g. inside exists or in10—that fetches data from the very same table that the statement is writing to. Again, there could be a cyclic reference, this time between rows.

Consider the simplest possible example:

INSERT INTO t1
SELECT *
  FROM t1

The question is basically whether the select can already see the rows that are just inserted. Well, the obvious answer is “no”—otherwise it would end up as infinite loop.

The problem can also appear with the other data-modifying statements: update, delete and merge. However, the problem can only occur if these statements contain a query that accesses the target table again—otherwise it cannot access different rows from the same table—cyclic references cannot emerge.

The SQL standard solves the problem in the same way as for the set clause discussed above. It requires the execution to be effectively split into read-only and write-only phases. This time, the standard doesn’t strictly require this processing because it is an optional feature (F781, “Self-referencing operations”). Databases not supporting this feature should yield an error when you try to execute a self-referencing statement.

Indeed, MySQL and MariaDB do produce an error.

You can't specify target table 't1' for update in FROM clause

Note that this message always says “update” even when the statement was a delete. With MariaDB 10.0, the message was rephrased:

Table 't1' is specified twice, both as a target for 'UPDATE' and as a separate source for data

MariaDB 10.3 can execute self-referencing update and delete statements.11

Availability of Self-Referencing Operations

Off Topic: Limit in Group_Concat

Group_concat is not a standard SQL feature. The standard function for that is listagg. However, I though I’d include this enhancement here nevertheless because listagg offers a different solution for the same problem—how to prevent exceeding the length limitation of the results’s data type?

The SQL standard’s listagg has the on overflow clause that can stop adding further values before exceeding the limit. MariaDB’s group_concat can now take an optional limit clause to put an upper bound on the number of concatenated values.

Further reading:

Event Note: Modern SQL Training in Vienna

If you have read this far, you are probably interested in learning more about all the modern SQL goodness. If so, have a look at my upcoming training in Vienna (Sep 17-21).

It’s a full week long and covers all the recurring issues that I have observed in my training and consulting assignments over the years. That includes indexing in detail, basics you might be afraid to ask about, and modern SQL features such as window functions and recursions in detail.

Check it out now ;)

What’s New in MariaDB 10.3” by Markus Winand was originally published at modern SQL.

Codership is hiring Galera Cluster product specialist/community manager

$
0
0

Galera Cluster is the leading high availability solution for MySQL and MariaDB. We are always looking for bright and driven people who have a passion for technology, especially for database replication and clustering. If you are interested in challenging work, being part of a innovative team and world’s leading MySQL clustering company-then Codership is right place for you!  This is a remote job.


Job Description and Responsibilities

  • Write Galera Cluster technical marketing material (blogs, white papers, benchmarks)
  • Prepare presentations and present at webinars and conferences
  • Be active in social media channels and forums
  • Consult customers for Galera Cluster best practices
  • Pre-sales support
  • Interface with the development team to provide user feedback
  • Assist in writing Galera documentation


Galera product specialist/community manager qualifications

An ideal candidate must possess the following skills:

  • Deep understanding of Galera Cluster, replication technologies, databases generally
  • Experienced speaker at webinars and conferences
  • Ability to write technical blogs and white papers
  • Technical customer consulting/presales experience
  • Excellent verbal and written communication skills
  • Strong networking and social media skills
  • Ability to engage with a wide range of audiences from customers up to senior management
  • Experience working across different cultures and business environments
  • Organized, detail-oriented, and self-driven
  • Willingness to travel to conferences and customer meetings


Send your applications to jobs@galeracluster.com or sakari.keskitalo@galeracluster.com

Viewing all 18800 articles
Browse latest View live


<script src="https://jsc.adskeeper.com/r/s/rssing.com.1596347.js" async> </script>