MySQL 5.7 and 8.0 have an issue of stopping replication on all slaves.
↧
[MySQL][replication]unknown error reading log event on the master
↧
Announcement: Experimental Build of Percona XtraBackup 8.0

 Experimental Build of Percona XtraBackup 8.0 released
An experimental alpha version of Percona XtraBackup 8.0.1 is now available in the Percona experimental software repositories.
A few things to note about this release:
- We removed the deprecated innobackupex in this release
- Due to the new MySQL redo log and data dictionary formats the Percona XtraBackup 8.0.x versions will only be compatible with MySQL 8.0.x and the upcoming Percona Server for MySQL 8.0.x
- For experimental migrations from earlier database server versions, you will need to backup and restore and using XtraBackup 2.4 and then use mysql_upgrade from MySQL 8.0.x
PXB 8.0.1 alpha is available for the following platforms:
- RHEL/Centos 6.x
- RHEL/Centos 7.x
- Ubuntu 14.04 Trusty*
- Ubuntu 16.04 Xenial
- Ubuntu 18.04 Bionic
- Debian 8 Jessie*
- Debian 9 Stretch
Information on how to configure the Percona repositories for apt and yum systems and access the Percona experimental software is here.
* We might drop these platforms before GA release.
The post Announcement: Experimental Build of Percona XtraBackup 8.0 appeared first on Percona Database Performance Blog.
↧
↧
How to Deploy a Production-Ready MySQL or MariaDB Galera Cluster using ClusterControl
Deploying a database cluster is not rocket science - there are many how-to’s on how to do that. But how do you know what you just deployed is production-ready? Manual deployments can also be tedious and repetitive. Depending on the number of nodes in the cluster, the deployment steps may be time-consuming and error-prone. Configuration management tools like Puppet, Chef and Ansible are popular in deploying infrastructure, but for stateful database clusters, you need to perform significant scripting to handle deployment of the whole database HA stack. Moreover, the chosen template/module/cookbook/role has to be meticulously tested before you can trust it as part of your infrastructure automation. Version changes require the scripts to be updated and tested again.
The good news is that ClusterControl automates deployments of the entire stack - and for free as well! We’ve deployed thousands of production clusters, and take a number of precautions to ensure they are production-ready Different topologies are supported, from master-slave replication to Galera, NDB and InnoDB cluster, with different database proxies on top.
A high availability stack, deployed through ClusterControl, consists of three layers:
- Database layer (e.g., Galera Cluster)
- Reverse proxy layer (e.g., HAProxy or ProxySQL)
- Keepalived layer, which, with use of Virtual IP, ensures high availability of the proxy layer
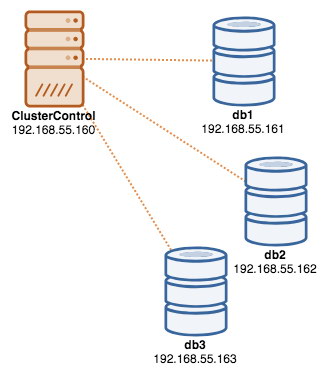
In this blog, we are going to show you how to deploy a production-grade Galera Cluster complete with load balancers for high availability setup. The complete setup consists of 6 hosts:
- 1 host - ClusterControl (deployment, monitoring, management server)
- 3 hosts - MySQL Galera Cluster
- 2 hosts - Reverse proxies act as load balancers in front of the cluster.
The following diagram illustrates our end result once deployment is complete:
Prerequisites
ClusterControl must reside on an independant node which is not part of the cluster. Download ClusterControl, and the page will generate a license unique for you and show the steps to install ClusterControl:
$ wget -O install-cc https://severalnines.com/scripts/install-cc
$ chmod +x install-cc
$ ./install-cc # as root or sudo user
Follow the instructions where you will be guided with setting up MySQL server, MySQL root password on the ClusterControl node, cmon password for ClusterControl usage and so on. You should get the following line once the installation has completed:
Determining network interfaces. This may take a couple of minutes. Do NOT press any key.
Public/external IP => http://{public_IP}/clustercontrol
Installation successful. If you want to uninstall ClusterControl then run install-cc --uninstall.
Then, on the ClusterControl server, generate an SSH key which we will use to setup the passwordless SSH later on. You can use any user in the system but it must have the ability to perform super-user operations (sudoer). In this example, we picked the root user:
$ whoami
root
$ ssh-keygen -t rsa
Set up passwordless SSH to all nodes that you would like to monitor/manage via ClusterControl. In this case, we will set this up on all nodes in the stack (including ClusterControl node itself). On ClusterControl node, run the following commands and specify the root password when prompted:
$ ssh-copy-id root@192.168.55.160 # clustercontrol
$ ssh-copy-id root@192.168.55.161 # galera1
$ ssh-copy-id root@192.168.55.162 # galera2
$ ssh-copy-id root@192.168.55.163 # galera3
$ ssh-copy-id root@192.168.55.181 # proxy1
$ ssh-copy-id root@192.168.55.182 # proxy2
You can then verify if it's working by running the following command on ClusterControl node:
$ ssh root@192.168.55.161 "ls /root"Make sure you are able to see the result of the command above without the need to enter password.
Deploying the Cluster
ClusterControl supports all vendors for Galera Cluster (Codership, Percona and MariaDB). There are some minor differences which may influence your decision for choosing the vendor. If you would like to learn about the differences between them, check out our previous blog post - Galera Cluster Comparison - Codership vs Percona vs MariaDB.
For production deployment, a three-node Galera Cluster is the minimum you should have. You can always scale it out later once the cluster is deployed, manually or via ClusterControl. We’ll open our ClusterControl UI at https://192.168.55.160/clustercontrol and create the first admin user. Then, go to the top menu and click Deploy -> MySQL Galera and you will be presented with the following dialog:
There are two steps, the first one is the "General & SSH Settings". Here we need to configure the SSH user that ClusterControl should use to connect to the database nodes, together with the path to the SSH key (as generated under Prerequisite section) as well as the SSH port of the database nodes. ClusterControl presumes all database nodes are configured with the same SSH user, key and port. Next, give the cluster a name, in this case we will use "MySQL Galera Cluster 5.7". This value can be changed later on. Then select the options to instruct ClusterControl to install the required software, disable the firewall and also disable the security enhancement module on the particular Linux distribution. All of these are recommended to be toggled on to maximize the potential of successful deployment.
Click Continue and you will be presented with the following dialog:
In the next step, we need to configure the database servers - vendor, version, datadir, port, etc - which are pretty self-explanatory. "Configuration Template" is the template filename under /usr/share/cmon/templates of the ClusterControl node. "Repository" is how ClusterControl should configure the repository on the database node. By default, it will use the vendor repository and install the latest version provided by the repository. However, in some cases, the user might have a pre-existing repository mirrored from the original repository due to security policy restriction. Nevertheless, ClusterControl supports most of them, as described in the user guide, under Repository.
Lastly, add the IP address or hostname (must be a valid FQDN) of the database nodes. You will see a green tick icon on the left of the node, indicating ClusterControl was able to connect to the node via passwordless SSH. You are now good to go. Click Deploy to start the deployment. This may take 15 to 20 minutes to complete. You can monitor the deployment progress under Activity (top menu) -> Jobs -> Create Cluster:
Once the deployment completed, at this point, our architecture can be illustrated as below:
Deploying the Load Balancers
In Galera Cluster, all nodes are equal - each node holds the same role and same dataset. Therefore, there is no failover within the cluster if a node fails. Only the application side requires failover, to skip the inoperational nodes while the cluster is partitioned. Therefore, it's highly recommended to place load balancers on top of a Galera Cluster to:
- Unify the multiple database endpoints to a single endpoint (load balancer host or virtual IP address as the endpoint).
- Balance the database connections between the backend database servers.
- Perform health checks and only forward the database connections to healthy nodes.
- Redirect/rewrite/block offending (badly written) queries before they hit the database servers.
There are three main choices of reverse proxies for Galera Cluster - HAProxy, MariaDB MaxScale or ProxySQL - all can be installed and configured automatically by ClusterControl. In this deployment, we picked ProxySQL because it checks all the above plus it understands the MySQL protocol of the backend servers.
In this architecture, we want to use two ProxySQL servers to eliminate any single-point-of-failure (SPOF) to the database tier, which will be tied together using a floating virtual IP address. We’ll explain this in the next section. One node will act as the active proxy and the other one as hot-standby. Whichever node that holds the virtual IP address at a given time is the active node.
To deploy the first ProxySQL server, simply go to the cluster action menu (right-side of the summary bar) and click on Add Load Balancer -> ProxySQL -> Deploy ProxySQL and you will see the following:
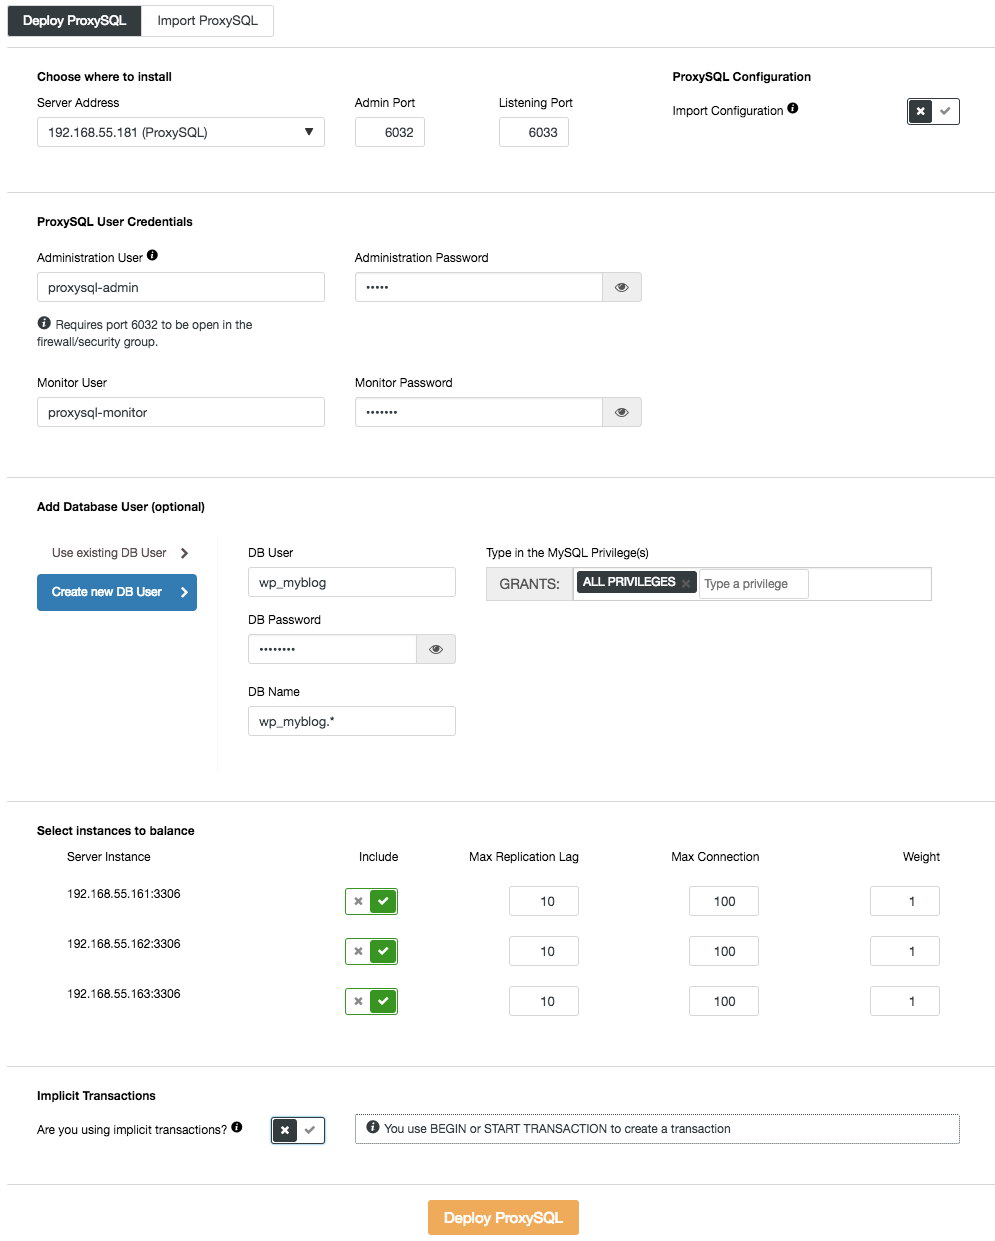
Again, most of the fields are self-explanatory. In the "Database User" section, ProxySQL acts as a gateway through which your application connects to the database. The application authenticates against ProxySQL, therefore you have to add all of the users from all the backend MySQL nodes, along with their passwords, into ProxySQL. From ClusterControl, you can either create a new user to be used by the application - you can decide on its name, password, access to which databases are granted and what MySQL privileges that user will have. Such user will be created on both MySQL and ProxySQL side. Second option, more suitable for existing infrastructures, is to use the existing database users. You need to pass username and password, and such user will be created only on ProxySQL.
The last section, "Implicit Transaction", ClusterControl will configure ProxySQL to send all of the traffic to the master if we started transaction with SET autocommit=0. Otherwise, if you use BEGIN or START TRANSACTION to create a transaction, ClusterControl will configure read/write split in the query rules. This is to ensure ProxySQL will handle transactions correctly. If you have no idea how your application does this, you can pick the latter.
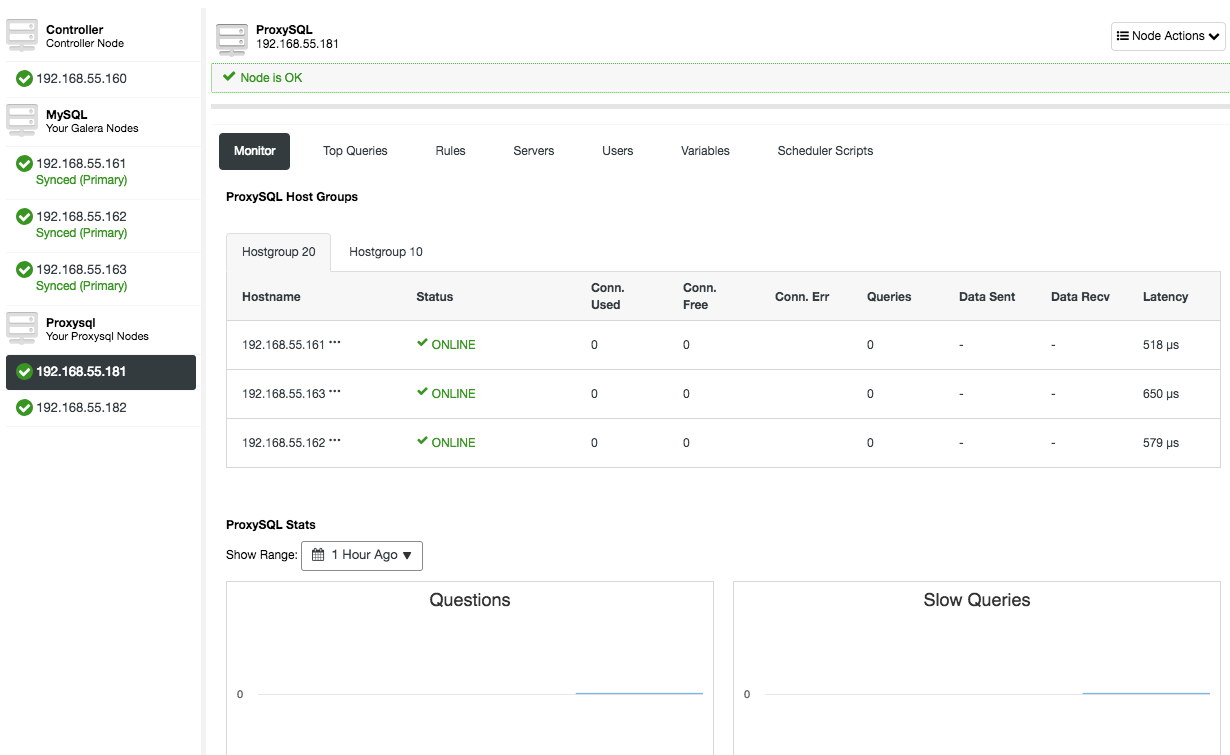
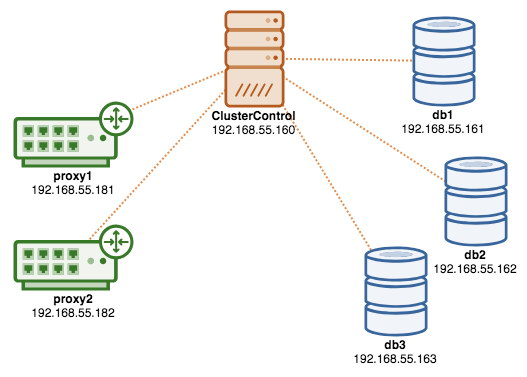
Repeat the same configuration for the second ProxySQL node, except the "Server Address" value which is 192.168.55.182. Once done, both nodes will be listed under "Nodes" tab -> ProxySQL where you can monitor and manage them directly from the UI:
At this point, our architecture is now looking like this:
If you would like to learn more about ProxySQL, do check out this tutorial - Database Load Balancing for MySQL and MariaDB with ProxySQL - Tutorial.
Deploying the Virtual IP Address
The final part is the virtual IP address. Without it, our load balancers (reverse proxies) would be the weak link as they would be a single-point of failure - unless the application has the ability to automatically redirect failed database connections to another load balancer. Nevertheless, it's good practice to unify them both using virtual IP address and simplify the connection endpoint to the database layer.
From ClusterControl UI -> Add Load Balancer -> Keepalived -> Deploy Keepalived and select the two ProxySQL hosts that we have deployed:
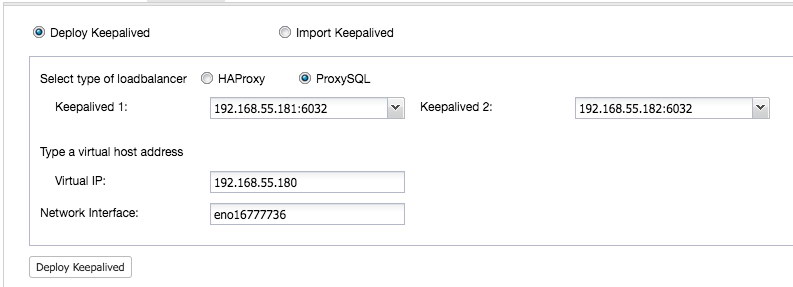
Also, specify the virtual IP address and the network interface to bind the IP address. The network interface must exist on both ProxySQL nodes. Once deployed, you should see the following green checks in the summary bar of the cluster:

At this point, our architecture can be illustrated as below:
Our database cluster is now ready for production usage. You can import your existing database into it or create a fresh new database. You can use the Schemas and Users Management feature if the trial license hasn't expired.
To understand how ClusterControl configures Keepalived, check out this blog post, How ClusterControl Configures Virtual IP and What to Expect During Failover.
Connecting to the Database Cluster
From the application and client standpoint, they need to connect to 192.168.55.180 on port 6033 which is the virtual IP address floating on top of the load balancers. For example, the Wordpress database configuration will be something like this:
/** The name of the database for WordPress */
define( 'DB_NAME', 'wp_myblog' );

/** MySQL database username */
define( 'DB_USER', 'wp_myblog' );

/** MySQL database password */
define( 'DB_PASSWORD', 'mysecr3t' );

/** MySQL hostname - virtual IP address with ProxySQL load-balanced port*/
define( 'DB_HOST', '192.168.55.180:6033' );If you would like to access the database cluster directly, bypassing the load balancer, you can just connect to port 3306 of the database hosts. This is usually required by the DBA staff for administration, management, and troubleshooting. With ClusterControl, most of these operations can be performed directly from the user interface.
Final Thoughts
As shown above, deploying a database cluster is no longer a difficult task. Once deployed, there a full suite of free monitoring features as well as commercial features for backup management, failover/recovery and others. Fast deployment of different types of cluster/replication topologies can be useful when evaluating high availability database solutions, and how they fit to your particular environment.
↧
Percona Server for MySQL 5.7.23-23 Is Now Available

 Percona announces the release of Percona Server for MySQL 5.7.23-23 on September 12, 2018 (downloads are available here and from the Percona Software Repositories). This release merges changes of MySQL 5.7.23, including all the bug fixes in it. Percona Server for MySQL 5.7.23-23 is now the current GA release in the 5.7 series. All of Percona’s software is open-source and free.
New Features
- The
max_binlog_filesvariable is deprecated, and thebinlog_space_limitvariable should be used instead of it. The behavior ofbinlog_space_limitis consistent with the variablerelay-log-space-limitused for relay logs; both variables have the same semantics. For more information, see #275. - Starting with 5.7.23-23, it is possible to encrypt all data in the InnoDB system tablespace and in the parallel double write buffer. This feature is considered ALPHA quality. A new variable
innodb_sys_tablespace_encryptis introduced to encrypt the system tablespace. The encryption of the parallel double write buffer file is controlled by the variableinnodb_parallel_dblwr_encrypt. Both variables areOFFby default. For more information, see #3822. - Changing
rocksdb_update_cf_optionsreturns any warnings and errors to the client instead of printing them to the server error log. For more information, see #4258. -
rocksdb_number_stat_computersandrocksdb_rate_limit_delay_millisvariables have been removed. For more information, see #4780. - A number of new variables were introduced for MyRocks:
rocksdb_rows_filteredto show the number of rows filtered out for TTL in MyRocks tables,rocksdb_bulk_load_allow_skto allow adding secondary keys using the bulk loading feature,rocksdb_error_on_suboptimal_collationtoggling warning or error in case of an index creation on a char field where the table has a sub-optimal collation,rocksdb_stats_recalc_ratespecifying the number of indexes to recalculate per second,rocksdb_commit_time_batch_for_recoverytoggler of writing the commit time write batch into the database, androcksdb_write_policyspecifying when two-phase commit data are actually written into the database.
Bugs Fixed
- The statement
SELECT...ORDER BYproduced inconsistent results with theeuckrcharset oreuckr_bincollation. Bug fixed #4513 (upstream #91091). - InnoDB statistics could incorrectly report zeros in the slow query log. Bug fixed #3828.
- With the FIPS mode enabled and performance_schema=off, the instance crashed when running the
CREATE VIEWcommand. Bug fixed #3840. - The soft limit of the core file size was set incorrectly starting with PS 5.7.21-20. Bug fixed #4479.
- The option
innodb-optimize-keyscould fail when a dumped table has two columns such that the name of one of them contains the other as as a prefix and is defined with the AUTO_INCREMENT attribute. Bug fixed #4524. - When
innodb_temp_tablespace_encryptwas set toONtheCREATE TABLEcommand could ignore the value of theENCRYPTIONoption. Bug fixed #4565. - If
FLUSH STATUSwas run from a different session, a statement could be counted twice inGLOBAL STATUS. Bug fixed #4570 (upstream #91541). - In some cases, it was not possible to set the
flush_cachesvariable on systems that use systemd. Bug fixed #3796. - A message in the MyRocks log file did not clearly inform whether fast CRC32 was supported. Bug fixed #3988.
-
mysqldcould not be started on Ubuntu if the database recovery had taken longer than ten minutes. Bug fixed #4546 (upstream #91423). - The ALTER TABLE command was slow when the number of dirty pages was high. Bug fixed #3702.
- Setting the global variable
version_suffixto NULL could lead to a server crash. Bug fixed #4785.
Other Bugs Fixed
- #4620 “Enable encryption of temporary tablespace from foreground thread”
- #4727 “intrinsic temp table behaviour shouldn’t depend on innodb_encrypt_tables”
- #4046 “Ship assert failure: ‘res == 0’ (bulk loader)”
- #3851 “Percona Ver 5.6.39-83.1 Failing assertion: sym_node->table != NULL”
- #4533 “audit_log MTR tests should refer to include files without parent directories”
- #4619 “main.flush_read_lock fails with timeout in wait_condition.inc.”
- #4561 “Read after free at Binlog_crypt_data::load_latest_binlog_key()”
- #4587 “ROCKSDB_INCLUDE_RFR macro in wrong file”
Find the release notes for Percona Server for MySQL 5.7.23-23 in our online documentation. Report bugs in the Jira bug tracker.
The post Percona Server for MySQL 5.7.23-23 Is Now Available appeared first on Percona Database Performance Blog.
↧
The Difference Between Lock Wait Timeout And Deadlock
If you use ACID transactional databases, you’ve probably heard of lock wait timeouts and deadlocks. What are these? And how are they different?
It’s inevitable that many of us will come across these phenomena at some point. Most databases use locking strategies to make sure that data stays consistent when multiple users (or connections, or processes) are reading and modifying the data concurrently. The locks ensure that only one operation can alter a specific portion of the data at a time as well as serializing changes to further mitigate these race conditions. Without this locking, confusing and incorrect behaviors can happen.

Lock wait timeouts and deadlocks both arise from certain locking mechanisms. A lock wait timeout results when one user gets a lock on some data and holds it while another user tries to access it. If the first user doesn’t unlock the data, the second one will time out after a while. The database will respond to the second user with an error message that says their lock wait was too long. This behavior keeps the second user from waiting forever so they can stay productive by working on something else.
Deadlocks are a related behavior, but they’re more complicated. A deadlock happens when multiple lock waits happen in such a manner that none of the users can do any further work. For example, the first user and second user both lock some data. Then each of them tries to access each other’s locked data. There’s a cycle in the locking: user A is waiting on B, and B is waiting on A. Neither can proceed.
Some databases resolve deadlocks through lock wait timeouts, but this is really wasteful. For one thing, if users have to wait for their lock requests to time out, everything will become really slow. (MySQL’s default lock wait timeout is 50 seconds.) More seriously, this will lead to a lot of long-lived locks, which increases the chance that lots and lots of other users will also try to access the same data and themselves get into lock waits or deadlocks.
That’s why high-performance databases typically do lock cycle detection, looking for a loop in the chain of locks. When they find the loop, they know that one of the users’ work needs to be aborted to let others go ahead. The user that gets selected as the victim will receive an error message saying there was a deadlock. Hopefully, the other users can proceed with their work now that this user’s locks have been forcibly cleared.
The basic strategies for avoiding the wasteful work delays from lock waits and deadlocks are the same:
- Lock as little data as possible
- Lock it for as short a time as possible
- If you’re operating on multiple pieces of data, try to arrange for it to be done in the same order. (Cycles only happen when some things are working one direction and others are going the opposite way).
Most of the time, you don’t need to worry about any of this. The database typically takes care of all of this for you. You normally don’t need to explicitly ask for data to be locked, and you generally won’t need to think a lot about the order of data access. But if you do encounter lock wait timeouts or deadlocks, you might need to dig more deeply into the internals of the database’s execution plans with EXPLAIN, examine the schema and indexing, and perhaps even think about the physical ordering of the data to understand what’s causing the issues.

↧
↧
Meet MySQL Support at Oracle OpenWorld and Code One 2018
Oracle MySQL Support will this year again take part in the Oracle OpenWorld conference in San Francisco. Additionally, we will present at the developer focused Code One that is held at the same time. Oracle OpenWorld and Code One 2018 takes place at the Moscone Center and nearby hotels in San Francisco on Monday 22 October to Thursday 25 October.

MySQL Support will be represented by Lig Isler-turmelle and myself (Jesper Wisborg Krogh), and we will organize three hands-on labs (HOL) in Oracle OpenWorld, two talks in Code One, and two mini-briefings at the Support Stars Bar. The hands-on lab and Code One talks are:
| Time | Speaker(s) | Session | Title |
|---|---|---|---|
| Monday 22 October 12:15 pm - 13:15 pm |
Lig Isler-turmelle Jesper Wisborg Krogh |
HOL1703 | A Practical Introduction to the MySQL Document Store |
| Tuesday 23 October 11:15 am - 12:15pm |
Lig Isler-turmelle Jesper Wisborg Krogh |
HOL1706 | Developing Modern Applications with the MySQL Document Store and NodeJS |
| Wednesday 24 October 09:00 am - 09:45 am |
Jesper Wisborg Krogh | DEV5957 | Develop Python Application with MySQL Connector/Python |
| Wednesday 24 October 02:30 pm - 03:15 am |
Jesper Wisborg Krogh | DEV5959 | Python and the MySQL Document Store |
| Thursday 25 October 09:00 am - 10:00 am |
Lig Isler-turmelle Jesper Wisborg Krogh |
HOL2986 | Using MySQL Common Table Expressions and Window Functions |
The HOL sessions are in Salon 9A at the Mariott Marquis on the Yearba Buena Level and the DEV sessions are the Code One talks and will be in Room 2014 at Moscone West.
Additionally, we will be present at the Support Stars Bar. This is an area full of people from Oracle Support. Throughout the four days there will be 15-minute mini-briefings. Attendees to the mini-briefings can enter a drawing with a chance to win a prize. MySQL Support will have two mini-briefings (the schedule is still to be finalized). The Support Stars Bar will be located at level 3 in Moscone West. You can read more about the Support Stars Bar at the Oracle Support homepage.
There are of course many more talks both by Oracle developers, product management, as well as MySQL users. Registration is open, and I will encourage you to register and come and meet the people behind MySQL and hear about the new features and how MySQL is used. You can read more about MySQL’s general presence in LeFred’s blog and see a list of all the MySQL sessions at both OpenWorld and Code One in the Code One session catalogue.

↧
Analyzing Amazon Aurora Slow Logs with pt-query-digest

 In this blog post we shall discuss how you can analyze slow query logs from Amazon Aurora for MySQL, (referred to as Amazon Aurora in the remaining blog). The tools and techniques explained here apply to the other MySQL compatible services available under Amazon Aurora. However, we’ll focus specially on analyzing slow logs from Amazon Aurora version 2 (MySQL 5.7 compatible) using pt-query-digest. We believe there is a bug in Aurora where it logs really big numbers for query execution and lock times for otherwise really fast queries.
So, the main steps we need are:
- Enable slow query logging on your Amazon Aurora DB parameter group, apply the change when appropriate.
- Download the slow log(s) that match the time that you are interested to investigate, and optionally concatenate them.
- Run pt-query-digest on the downloaded logs and check the results.
Enable slow query logging
For our testing we decided to capture all the SELECT queries that were hitting our Amazon Aurora instance, mainly because we had a sysbench OLTP read only workload and that wouldn’t really have a lot of slow queries. An easy way to do so is to enable the capture of slow query logs and set long_query_time to 0 — you will need to enable slow query logging. To achieve that, we created a new DB parameter group and applied it to our test Aurora instance with the following three parameters set as below:
slow_query_log=1
long_query_time=0
min_examined_row_limit=0
Once you have the above configuration applied to Amazon RDS, you will be able to see slow query logs being created in the Amazon RDS console.
Download the log file
You can download the log file of your choice using either the Amazon RDS console OR you can use the following AWS CLI command to achieve the same:
$ aws rds download-db-log-file-portion --db-instance-identifier perconasupport --starting-token 0 --output text --log-file-name slowquery/mysql-slowquery.log.2018-09-03.09 > mysql-slowquery.log.2018-09-03.09
Depending on the size of the chosen log file, the above command will take some time to complete the download.
Run pt-query-digest on the log file
Once the file has been downloaded you can analyse that using the following pt-query-digest command.
$ pt-query-digest --group-by fingerprint --order-by Query_time:sum mysql-slowquery.log.2018-09-03.09
On our Aurora test slow log file, the initial results didn’t look right so we had to apply a workaround. Here is the header of the initial results from pt-query-digest:
# 456.2s user time, 2.5s system time, 43.80M rss, 141.48M vsz
# Current date: Tue Sep 4 15:54:21 2018
# Hostname: aahmed-GL503VD
# Files: mysql-slowquery.log.2018-09-03.09
# Overall: 5.13M total, 60 unique, 1.43k QPS, 507.43Gx concurrency _______
# Time range: 2018-09-03T08:00:04 to 2018-09-03T09:00:03
# Attribute total min max avg 95% stddev median
# ============ ======= ======= ======= ======= ======= ======= =======
# Exec time 1826227663297288s 1us 18446744073710s 355917782s 761us 80127878922s 93us
# Lock time 1401952549601936s 0 18446744073710s 273229812s 44us 70205933577s 23us
# Rows sent 94.71M 0 100 19.35 97.36 37.62 0.99
# Rows examine 216.26M 0 300 44.19 299.03 84.74 0.99
# Query size 196.24M 5 1.24k 40.08 72.65 18.90 36.69
# Profile
# Rank Query ID Response time Calls R/Call
# ==== ====================== =========================== ======= ========
# 1 0xE81D0B3DB4FB31BC5... 1346612317380813.0000 73.7% 3194111 421592210.5966 18... SELECT sbtest?
# 2 0x9934EF6887CC7A638... 147573952589685.0625 8.1% 319381 462062403.8051 18... SELECT sbtest?
# 3 0x8D589AFA4DFAEEED8... 110680464442264.1094 6.1% 319411 346514254.1812 18... BEGIN
# 4 0xFF7C69F51BBD3A736... 92233720368565.1875 5.1% 319388 288782673.0139 18... SELECT sbtest?
# 5 0xFFFCA4D67EA0A7888... 73786976294861.9844 4.0% 321238 229695665.8143 18... COMMIT
# MISC 0xMISC 55340232221335.8281 3.0% 657509 84166501.4796 0.0 <43 ITEMS>
What’s wrong with the above results is that the total query Exec time and Lock time are very large numbers. Digging deeper into the logs revealed a problem with the slow logs themselves that had very large numbers for Query time & Lock time for some queries. For instance in our case, of 5.13 million queries in the log file, only 111 had the anomaly. Even so, it was enough to skew the results.
# Time: 2018-09-03T08:41:47.363522Z
--
SELECT c FROM sbtest1 WHERE id=24278;
# Time: 2018-09-03T08:41:49.363224Z
# User@Host: perconasupport[perconasupport] @ [172.30.2.111] Id: 20869
# Query_time: 18446744073709.550781 Lock_time: 18446744073709.550781 Rows_sent: 1 Rows_examined: 1
SET timestamp=1535964109;
SELECT c FROM sbtest2 WHERE id=989322;
# Time: 2018-09-03T08:41:49.363296Z
--
BEGIN;
# Time: 2018-09-03T08:41:53.362947Z
# User@Host: perconasupport[perconasupport] @ [172.30.2.111] Id: 20873
# Query_time: 18446744073709.550781 Lock_time: 18446744073709.550781 Rows_sent: 1 Rows_examined: 1
SET timestamp=1535964113;
SELECT c FROM sbtest1 WHERE id=246889;
# Time: 2018-09-03T08:41:53.363003Z
Incorrect logging
The above two queries are, in fact, really fast, but for some reason the execution time & lock times are wrongly logged in the slow query log. Since the number of such query log records is statistically negligible compared to the total number of queries, we decided to ask pt-query-digest to ignore them using the command line parameter –attribute-value-limit . The default value of this parameter is 0. We decided to increase that to 2^32, and make it ignore the large numbers from the slow query log. So, the pt-query-digest command became:
$ pt-query-digest --group-by fingerprint --order-by Query_time:sum --attribute-value-limit=4294967296 mysql-slowquery.log.2018-09-03.09
This caused the 111 queries with the bad log times to be ignored and the results looked good. In our case, the ignored queries were bad variants of queries for which good versions existed. You can tell this because the number of unique queries remained the same as before after the bad variants were ignored. However, this may not always hold true and one should expect to lose some fidelity, especially if you are analyzing a smaller slow log.
# 441s user time, 450ms system time, 38.19M rss, 111.76M vsz
# Current date: Tue Sep 4 16:23:33 2018
# Hostname: aahmed-GL503VD
# Files: mysql-slowquery.log.2018-09-03.09
# Overall: 5.13M total, 60 unique, 1.43k QPS, 0.30x concurrency __________
# Time range: 2018-09-03T08:00:04 to 2018-09-03T09:00:03
# Attribute total min max avg 95% stddev median
# ============ ======= ======= ======= ======= ======= ======= =======
# Exec time 1096s 1us 198ms 213us 761us 431us 93us
# Lock time 180s 0 103ms 34us 44us 161us 23us
# Rows sent 94.71M 0 100 19.35 97.36 37.62 0.99
# Rows examine 216.26M 0 300 44.19 299.03 84.74 0.99
# Query size 196.24M 5 1.24k 40.08 72.65 18.90 36.69
# Profile
# Rank Query ID Response time Calls R/Call V/M Ite
# ==== =========================== ============== ======= ====== ===== ===
# 1 0xE81D0B3DB4FB31BC558CAE... 400.1469 36.5% 3194111 0.0001 0.00 SELECT sbtest?
# 2 0xF0C5AE75A52E847D737F39... 161.4065 14.7% 319453 0.0005 0.00 SELECT sbtest?
# 3 0xFFFCA4D67EA0A788813031... 155.8740 14.2% 321238 0.0005 0.00 COMMIT
# 4 0x8D589AFA4DFAEEED85FFF5... 107.9827 9.9% 319411 0.0003 0.00 BEGIN
# 5 0x9934EF6887CC7A6384D1DE... 94.1002 8.6% 319381 0.0003 0.00 SELECT sbtest?
# 6 0xFF7C69F51BBD3A736EEB1B... 79.9279 7.3% 319388 0.0003 0.00 SELECT sbtest?
# 7 0xA729E7889F57828D3821AE... 75.3969 6.9% 319398 0.0002 0.00 SELECT sbtest?
# MISC 0xMISC 21.1212 1.9% 18658 0.0011 0.0 <41 ITEMS>
# Query 1: 1.27k QPS, 0.16x concurrency, ID 0xE81D0B3DB4FB31BC558CAEF5F387E929 at byte 358647353
# Scores: V/M = 0.00
# Time range: 2018-09-03T08:00:04 to 2018-09-03T08:42:00
# Attribute pct total min max avg 95% stddev median
# ============ === ======= ======= ======= ======= ======= ======= =======
# Count 62 3194111
# Exec time 36 400s 10us 198ms 125us 332us 300us 80us
# Lock time 74 134s 0 26ms 42us 49us 154us 27us
# Rows sent 3 3.01M 0 1 0.99 0.99 0.11 0.99
# Rows examine 1 3.01M 0 1 0.99 0.99 0.11 0.99
# Query size 57 112.37M 32 38 36.89 36.69 0.53 36.69
# String:
# Databases perconasupport
# Hosts 172.30.2.111
# Users perconasupport
# Query_time distribution
# 1us
# 10us ################################################################
# 100us ##############
# 1ms #
# 10ms #
# 100ms #
# 1s
That number looks familiar
The really big number 18446744073709.550781 seemed to ring a bell. A quick web search revealed that it could be a regression of an old bug in MySQL’s code. The following bugs were found to have the same value being reported for query exec time & query lock time.
- https://bugs.mysql.com/bug.php?id=59757
- https://bugs.mysql.com/bug.
php?id=63524 - https://bugs.mysql.com/bug.
php?id=35396
Once slow logs were enabled, we used this sysbench command to generate the workload for the Amazon Aurora instance. You might like to try it yourselves. Please note that this used sysbench version 1.0.14.
$ sysbench --db-driver=mysql --mysql-user=perconasupport --mysql-host=perconasupport-1234567.cgmobiazycdv.eu-west-1.rds.amazonaws.com --mysql-password=XXXXXXX --mysql-db=perconasupport --range_size=100 --table_size=1000000 --tables=2 --threads=6 --events=0 --time=600 --rand-type=uniform /usr/share/sysbench/oltp_read_only.lua run
If you are an Amazon Aurora user, have you found any problems analyzing slow query logs? You are welcome to use the comments section, below, to let me know.
Percona Toolkit
pt-query-digest is part of Percona Toolkit, a collection of advanced open source command-line tools, developed and used by the Percona technical staff. Percona Toolkit is open source and free to download and use.
The post Analyzing Amazon Aurora Slow Logs with pt-query-digest appeared first on Percona Database Performance Blog.
↧
New status by norbert
Fun with high available database clusters... a full disk on one #Galera node can lead to a complete stop of the whole cluster...
https://github.com/codership/mysql-wsrep/issues/281
↧
Review of SlimDB from VLDB 2018
SlimDB is a paper worth reading from VLDB 2018. The highlights from the paper are that it shows:
Cache amplification has become more important as database:RAM ratios increase. With SSD it is possible to attach many TB of usable data to a server for OLTP. By usable I mean that the SSD has enough IOPs to access the data. But it isn't possible to grow the amount of RAM per server at that rate. Many of the early RocksDB workloads used database:RAM ratios that were about 10:1 and everything but the max level (Lmax) of the LSM tree was in memory. As the ratio grows that won't be possible unless filters and block indexes use less memory. SlimDB does that via three-level block indexes and multi-level cuckoo-filters.
The SlimDB paper shows the value of hybrid LSM tree shapes, combinations of tiered and leveled, and then how to choose the best combination based on IO costs. Prior to this year, hybrid didn't get much discussion -- the choices were usually tiered or leveled. While RocksDB and LevelDB with the L0 have always been hybrids of tiered (L0) and leveled (L1 to Lmax), we rarely discuss that. But more diversity in LSM tree shape means more complexity in tuning and the SlimDB solution is to make a cost-based decision (cost == IO overhead) subject to a constraint on the amount of memory to use.
This has been a great two years for storage engine efficiency. First we had several papers from Harvard DASLab that have begun to explain cost-based algorithm design and engine configuration and SlimDB continues in that tradition. I have much more reading to do starting with The Periodic Table of Data Structures.
Below I review the paper. Included with that is some criticism. Papers can be great without being perfect. This paper is a major contribution and worth reading.
SlimDB can use a cuckoo filter for leveled levels of the LSM tree and a multi-level cuckoo filter for tiered levels. Note that leveled levels have one sorted run and tiered levels have N sorted runs. SlimDB and the Stepped Merge paper use the term sub-levels, but I prefer N sorted runs.
The cuckoo filter is used in place of a bloom filter to save space given target false positive rates of less than 3%. The paper has examples where the cuckoo filter uses 13 bits/key (see Table 1) and a bloom filter with 10 bits/key (RocksDB default) has a false positive rate of much less than 3%. It is obvious that I need to read another interesting CMU paper cited by SlimDB -- Cuckoo Filter Practically Better than Bloom.
The multi-level cuckoo filter (MLCF) extends the cuckoo filter by using a few bits/entry to name the sub-level (sorted run) in the level that might contain the search key. With tiered and a bloom filter per sub-level (sorted run) a point query must search a bloom filter per sorted run. With the MLCF there is only one search per level (if I read the paper correctly).
The MLCF might go a long way to reduce the point-query CPU overhead when using many sub-levels which is a big deal. While a filter can't be used for general range queries, SlimDB doesn't support general range queries. Assuming the PK is on (a,b,c,d) and the prefix is (a,b) then SlimDB supports range queries like fetch all rows where a=X and b=Y. It wasn't clear to me whether the MLCF could be used in that case. But many sub-levels can create more work for range queries as iterators must be positioned in each sub-level in the worst case and that is more work.
This statement from the end of the paper is tricky. SlimDB allows for an LSM tree to use leveled compaction on all levels, tiered on all levels or a hybrid. When all levels are leveled, then performance should be similar to RocksDB with leveled, when all or some levels are tiered then write-amplification will be reduced at the cost of read performance and the paper shows that range queries are slower when some levels are tiered. Lunch isn't free as the RUM Conjecture asserts.
LSM tree shapes
For too long there has not been much diversity in LSM tree shapes. The usual choice was all tiered or all leveled. RocksDB leveled is really a hybrid -- tiered for L0, leveled for L1 to Lmax. But the SlimDB paper makes the case for more diversity. It explains that some levels (smaller ones) can be tiered while the larger levels can be leveled. And the use of multi-level cuckoo filters, three-level indexes and cuckoo filters is also a decision to make per-level.
Even more interesting is the use of a cost-model to choose the best configuration subject to a constraint -- the memory budget. They enumerate a large number of LSM tree configurations, generate estimated IO-costs per operation (write-amp, IO per point query that returns a row, IO per point query that doesn't return a row, memory overhead) and then the total IO cost is computed for for a workload -- where a workload specifies the frequency of each operation (for example - 30% writes, 40% point hits, 30% point misses).
The Dostoevsky paper also makes the case for more diversity and uses rigorous models to show how to choose the best LSM tree shape.
I think this work is a big step in the right direction. Although cost models must be expanded to include CPU overheads and constraints expanded to include the maximum write and space amplification that can be tolerated.
I disagree with a statement from the related work section. We can already navigate some of the read, write and space amplification space but I hope there is more flexibility in the future. RocksDB tuning is complex in part to support this via changing the number of levels (or growth factor per level), enabling/disabling the bloom filter, using different compression (or none) on different levels, changing the max space amplification allowed, changing the max number of sorted runs in the L0 or max number of write buffers, changing the L0:L1 size ratio, changing the number of bloom filter bits/key. Of course I want more flexibility in the future while also making RocksDB easier to tune.
Performance Results
- How to use less memory for filters and indexes with an LSM
- How to reduce the CPU penalty for queries with tiered compaction
- The benefit of more diversity in LSM tree shapes
Overview
Cache amplification has become more important as database:RAM ratios increase. With SSD it is possible to attach many TB of usable data to a server for OLTP. By usable I mean that the SSD has enough IOPs to access the data. But it isn't possible to grow the amount of RAM per server at that rate. Many of the early RocksDB workloads used database:RAM ratios that were about 10:1 and everything but the max level (Lmax) of the LSM tree was in memory. As the ratio grows that won't be possible unless filters and block indexes use less memory. SlimDB does that via three-level block indexes and multi-level cuckoo-filters.
Tiered compaction uses more CPU and IO for point and range queries because there are more places to check for data when compared to level compaction. The multi-level cuckoo filter in SlimDB reduces the CPU overhead for point queries as there is only one filter to check per level rather than one per sorted run per level.
The SlimDB paper shows the value of hybrid LSM tree shapes, combinations of tiered and leveled, and then how to choose the best combination based on IO costs. Prior to this year, hybrid didn't get much discussion -- the choices were usually tiered or leveled. While RocksDB and LevelDB with the L0 have always been hybrids of tiered (L0) and leveled (L1 to Lmax), we rarely discuss that. But more diversity in LSM tree shape means more complexity in tuning and the SlimDB solution is to make a cost-based decision (cost == IO overhead) subject to a constraint on the amount of memory to use.
This has been a great two years for storage engine efficiency. First we had several papers from Harvard DASLab that have begun to explain cost-based algorithm design and engine configuration and SlimDB continues in that tradition. I have much more reading to do starting with The Periodic Table of Data Structures.
Below I review the paper. Included with that is some criticism. Papers can be great without being perfect. This paper is a major contribution and worth reading.
Semi-sorted
The paper starts by explaining the principle of semi-sorted data. When the primary key can be split into two parts -- prefix and suffix -- there are some workloads that don't need data ordered over the entire primary key (prefix + suffix). Semi-sorted supports queries that fetch all data that matches the prefix of the PK while still enforcing uniqueness for the entire PK. The PK can be on (a,b,c,d) and (a,b) is prefix and queries are like "a=X and b=Y" without predicates on (c,d) that require index ordering. SlimDB takes advantage of this to use less space for the block index.
There are many use cases for this, but the paper cites Linkbench which isn't correct. See the Linkbench and Tao papers for queries that do an exact match on the prefix but only want the top-N rows in the result. So ordering on the suffix is required to satisfy query response time goals when the total number of rows that match the prefix is much larger than N. I assume this issue with top-N is important for other social graph workloads because some graph nodes are popular. Alas, things have changed with the social graph workload since those papers were published and I hope the changes are explained one day.
Note that MyRocks can use a prefix bloom filter to support some range queries with composite indexes. Assume the index is on (a,b,c) and the query has a=X and b=Y order by c limit 10. A prefix bloom on (a,b) can be used for such a query.
Stepped Merge
The paper implements tiered compaction but calls it stepped merge. I didn't know about the stepped merge paper prior to reading the SlimDB paper. I assume that people who chose the name tiered might also have missed that paper.
LSM compaction algorithms haven't been formally defined. I tried to advance the definitions in a previous post. One of the open issues for tiered is whether it requires only one sorted run at the max level or allows for N runs at the max level. With N runs at the max level the space-amplification is at least N which is too much for many workloads. With 1 run at the max level compaction into the max level is always leveled rather than tiered -- the max level is read/rewritten and the per-level write-amplification from that is larger than 1 (while the per-level write-amp from tiered == 1). With N runs at the max level many of the compaction steps into the max level can be tiered, but some will be leveled -- when the max level is full (has N runs) then something must be done to reduce the number of runs.
LSM compaction algorithms haven't been formally defined. I tried to advance the definitions in a previous post. One of the open issues for tiered is whether it requires only one sorted run at the max level or allows for N runs at the max level. With N runs at the max level the space-amplification is at least N which is too much for many workloads. With 1 run at the max level compaction into the max level is always leveled rather than tiered -- the max level is read/rewritten and the per-level write-amplification from that is larger than 1 (while the per-level write-amp from tiered == 1). With N runs at the max level many of the compaction steps into the max level can be tiered, but some will be leveled -- when the max level is full (has N runs) then something must be done to reduce the number of runs.
3-level block index
Read the paper. It is complex and a summary by me here won't add value. It uses an Entropy Coded Trie (ECT) that builds on ideas from SILT -- another great paper from CMU.
ECT uses ~2 bits/key versus at least 8 bits/key for LevelDB for the workloads they considered. This is a great result. ECT also uses 5X to 7X more CPU per lookup than LevelDB which means you might limit the use of it to the largest levels of the LSM tree -- because those use the most memory and the place where we are willing to spend CPU to save memory.
Multi-level cuckoo filter
SlimDB can use a cuckoo filter for leveled levels of the LSM tree and a multi-level cuckoo filter for tiered levels. Note that leveled levels have one sorted run and tiered levels have N sorted runs. SlimDB and the Stepped Merge paper use the term sub-levels, but I prefer N sorted runs.
The cuckoo filter is used in place of a bloom filter to save space given target false positive rates of less than 3%. The paper has examples where the cuckoo filter uses 13 bits/key (see Table 1) and a bloom filter with 10 bits/key (RocksDB default) has a false positive rate of much less than 3%. It is obvious that I need to read another interesting CMU paper cited by SlimDB -- Cuckoo Filter Practically Better than Bloom.
The multi-level cuckoo filter (MLCF) extends the cuckoo filter by using a few bits/entry to name the sub-level (sorted run) in the level that might contain the search key. With tiered and a bloom filter per sub-level (sorted run) a point query must search a bloom filter per sorted run. With the MLCF there is only one search per level (if I read the paper correctly).
The MLCF might go a long way to reduce the point-query CPU overhead when using many sub-levels which is a big deal. While a filter can't be used for general range queries, SlimDB doesn't support general range queries. Assuming the PK is on (a,b,c,d) and the prefix is (a,b) then SlimDB supports range queries like fetch all rows where a=X and b=Y. It wasn't clear to me whether the MLCF could be used in that case. But many sub-levels can create more work for range queries as iterators must be positioned in each sub-level in the worst case and that is more work.
This statement from the end of the paper is tricky. SlimDB allows for an LSM tree to use leveled compaction on all levels, tiered on all levels or a hybrid. When all levels are leveled, then performance should be similar to RocksDB with leveled, when all or some levels are tiered then write-amplification will be reduced at the cost of read performance and the paper shows that range queries are slower when some levels are tiered. Lunch isn't free as the RUM Conjecture asserts.
In contrast, with the support of dynamic use of a stepped merge algorithm and optimized in-memory indexes, SlimDB minimizes write amplification without sacrificing read performance.The memory overhead for MLCF is ~2 bits. I am not sure this was explained by the paper but that might be to name the sub-level, in which case there can be at most 4 sub-levels per level and the cost would be larger with more sub-levels.
The paper didn't explain how the MLCF is maintained. With a bloom filter per sorted run the bloom filter is created when SST files are created during compaction and memtable flush. This is an offline or batch computation. But the MLCF covers all the sub-levels (sorted runs) in a level. And the sub-levels in a level arrive and depart one at a time, not at the same time. They arrive as output from compaction and depart when they were compaction input. The arrival or departure of a new sub-level requires incremental changes to the MLCF.
LSM tree shapes
For too long there has not been much diversity in LSM tree shapes. The usual choice was all tiered or all leveled. RocksDB leveled is really a hybrid -- tiered for L0, leveled for L1 to Lmax. But the SlimDB paper makes the case for more diversity. It explains that some levels (smaller ones) can be tiered while the larger levels can be leveled. And the use of multi-level cuckoo filters, three-level indexes and cuckoo filters is also a decision to make per-level.
Even more interesting is the use of a cost-model to choose the best configuration subject to a constraint -- the memory budget. They enumerate a large number of LSM tree configurations, generate estimated IO-costs per operation (write-amp, IO per point query that returns a row, IO per point query that doesn't return a row, memory overhead) and then the total IO cost is computed for for a workload -- where a workload specifies the frequency of each operation (for example - 30% writes, 40% point hits, 30% point misses).
The Dostoevsky paper also makes the case for more diversity and uses rigorous models to show how to choose the best LSM tree shape.
I think this work is a big step in the right direction. Although cost models must be expanded to include CPU overheads and constraints expanded to include the maximum write and space amplification that can be tolerated.
I disagree with a statement from the related work section. We can already navigate some of the read, write and space amplification space but I hope there is more flexibility in the future. RocksDB tuning is complex in part to support this via changing the number of levels (or growth factor per level), enabling/disabling the bloom filter, using different compression (or none) on different levels, changing the max space amplification allowed, changing the max number of sorted runs in the L0 or max number of write buffers, changing the L0:L1 size ratio, changing the number of bloom filter bits/key. Of course I want more flexibility in the future while also making RocksDB easier to tune.
Existing LSM-tree based key-value stores do not allow trading among read cost, write cost and main memory footprint.
Performance Results
Figuring out why X was faster than Y in academic papers is not my favorite task. I realize that space constraints are a common reason for the lack of details but I am wary of results that have not been explained and I know that mistakes can be made (note: don't use serializable with InnoDB). I make many mistakes myself. I am willing to provide advice for MyRocks, MySQL and RocksDB. AFAIK most authors who hack on RocksDB or compare with it for research are not reaching out to us. We are happy to help in private.
SlimDB was faster than RocksDB on their evaluation except for range queries. There were few details about the configurations used, so I will guess. First I assume that SlimDB used stepped merge with MLCF for most levels. I am not sure why point queries were faster with SlimDB than RocksDB. Maybe RocksDB wasn't configured to use bloom filters. Writes were about 4X faster with SlimDB because stepped merge (tiered) compaction was used, write-amplification was 4X less and when IO is the bottleneck then an approach that has less write-amp will go faster.
SlimDB was faster than RocksDB on their evaluation except for range queries. There were few details about the configurations used, so I will guess. First I assume that SlimDB used stepped merge with MLCF for most levels. I am not sure why point queries were faster with SlimDB than RocksDB. Maybe RocksDB wasn't configured to use bloom filters. Writes were about 4X faster with SlimDB because stepped merge (tiered) compaction was used, write-amplification was 4X less and when IO is the bottleneck then an approach that has less write-amp will go faster.
↧
↧
Percona Toolkit 3.0.12 Is Now Available

 Percona announces the release of Percona Toolkit 3.0.12 on September 13, 2018.
Percona Toolkit is a collection of advanced open source command-line tools, developed and used by the Percona technical staff, that are engineered to perform a variety of MySQL®, MongoDB® and system tasks that are too difficult or complex to perform manually. With over 1,000,000 downloads, Percona Toolkit supports Percona Server for MySQL, MySQL®, MariaDB®, Percona Server for MongoDB and MongoDB.
Percona Toolkit, like all Percona software, is free and open source. You can download packages from the website or install from official repositories.
This release includes the following changes:
Fixed bugs:
-
PT-1611:
pt-archiverfailed to output UTF-8 characters. -
PT-1603:
pt-table-syncincorrectly calculated chunk boundaries in case of unsorted ENUM fields in indexes. -
PT-1574:
pt-online-schema-changefailed on tables with a nullable unique key and a row with NULL values. - PT-1572: ENUM fields usage in keys was improved, resulting in higher speed for expressions with sorted ENUM items.
-
PT-1422:
pt-mysql-summarycould hang when NULL values appear in the processlist Time column.
Documentation change:
-
PT-1321: The required MySQL privileges were detailed in
pt-online-schema-changedocumentation
Help us improve our software quality by reporting any bugs you encounter using our bug tracking system.
The post Percona Toolkit 3.0.12 Is Now Available appeared first on Percona Database Performance Blog.
↧
Encryption of the InnoDB System Tablespace and Parallel Doublewrite Buffer

 In my last post I compared data at-rest encryption features available for MySQL and MariaDB. As noted at the time, some of the features available for Percona Server for MySQL were in development, and the latest version (5.7.23) sees two of them released as ALPHA quality.
Encrypting the InnoDB system tablespace
The first of the new features is InnoDB system tablespace encryption via innodb_sys_tablespace_encrypt, which would provide encryption of the following data:
- the change buffer, which caches changes to secondary index pages as a result of DML operations for pages that are not in the InnoDB buffer pool
- The undo logs if they have not been configured to be stored in separate undo tablespaces
- data from any tables that exist in the main tablespace, which occurs when innodb_file_per_table is disabled
There are some related changes on the horizon that would allow this to be applied to an existing instance. However, for now this is only available for new instances as it can only be applied during bootstrap. This means that it would require a logical restore of your data to use it with an existing cluster–I should restate that this is an ALPHA feature and not production-ready.
There are some extra points to note about this new variable:
- an instance with an encrypted tablespace cannot be downgraded to use a version prior to 5.7.23, due to the inability to read the tablespace
- as noted, it is not currently possible to convert the tablespace between encrypted and unencrypted states, or vice versa
- the key for the system tablespace can be manually rotated using ALTER INSTANCE ROTATE INNODB MASTER KEY as per any other tablespace
Encrypting the parallel doublewrite buffer
To complement the encryption of the system tablespace, it is also possible to encrypt the parallel doublewrite buffer using innodb_parallel_dblwr_encrypt, a feature unique to Percona Server for MySQL. This means that any data for an encrypted tablespace is also only written in an encrypted form in the parallel doublewrite buffer; unencrypted tablespace data remains in plaintext. Unlike innodb_sys_tablespace_encrypt, you are able to set innodb_parallel_dblwr_encrypt dynamically on an existing instance.
There are more encryption features planned–or already in development–for Percona Server for MySQL so watch this space!
The post Encryption of the InnoDB System Tablespace and Parallel Doublewrite Buffer appeared first on Percona Database Performance Blog.
↧
MySQL at Oracle Open World and Oracle Code ONE
We are 6 weeks away of Oracle Open World and Oracle Code ONE in San Francisco. Once again, and maybe even more than ever, the MySQL Team and MySQL Community will present you very interesting sessions, tutorials and hands-on labs !
The Official Agenda is available here and here.
If you plan to attend this conference, I prepared one single pdf with all the MySQL sessions: MySQLCommunity_OOW18_Schedule

↧
This Week in Data With Colin Charles 52: London MySQL Meetup

 Join Percona Chief Evangelist Colin Charles as he covers happenings, gives pointers and provides musings on the open source database community.
This week wraps up the London MySQL meetup, where there were four presentations, for the intimate yet diverse crowd. We saw representation from Oracle MySQL, MariaDB Corporation, Pythian, and Percona. Long-time organizer Ivan Zoratti has also handed off the baton to Maria Luisa Raviol, and going forward she will ensure meetups are at least once per quarter. It was a real pleasure to see MySQL Community Manager Dave Stokes at the event, too.
A new book to read: AWS System Administration: Best Practices for Sysadmins in the Amazon Cloud. There is coverage of RDS, from the standpoint of an example application stack as well as backups.
A most interesting tweet from the Chief Marketing Officer of MongoDB, Meagen Eisenberg, of an ad on a billboard: friend’s don’t let friends use relational databases.
Releases
- MariaDB 10.1.36 which fixes a handful of regressions.
- An experimental build of Percona XtraBackup 8.0
- Percona Server for MySQL 5.7.23-23 – an alpha quality feature, “it is possible to encrypt all data in the InnoDB system tablespace and in the parallel double write buffer”. For MyRocks users, lots of new variables exposing new features.
- Puppet-ProxySQL 2.0.0 – good way to deploy ProxySQL with Puppet by Matthias Crauwels.
- TimescaleDB 1.0: The first enterprise-ready time-series database to support full SQL and scale– announcement packed with a lot of information. Built on PostgreSQL. They have over 1 million downloads!
Link List
- Migrating PostgreSQL standalone instance to Aurora (Amazon RDS)
- Cloud Foundry survey finds top enterprise languages – no surprise it leads with Java and then JavaScript. The report is an easy read.
- Serverless to the Max: Doing Big Things for Small Dollars with Cloudflare Workers and Azure Functions – Troy Hunt of Have I Been Pwned fame, tells us why serverless applications are extremely cost-effective. The money quote, “It’s costing me 2.6c per day to support 141M monthly queries of 517M records.”
- Select Star SQL is an interactive book which aims to be the best place on the internet for learning SQL.
- Let’s Encrypt at Scale
- Amazon Aurora – Seamless Planned Failover with ProxySQL
Industry Updates
- Catalyst IT Australia acquires Open Query – Arjen Lentz is a long-time MySQL community member, and he ran his company for the last 11 years pre-acquisition. Congratulations!
- Elastic files for IPO – the financials are solid, *”Our revenue was $159.9 million and $88.2 million in fiscal 2018 and 2017, respectively, representing year-over-year growth of 81% for fiscal 2018.” The filing is worth reading.
- New Cloud Unicorn: PagerDuty Scores $1.3 Billion Valuation In $90 Million Round – total raised now $173 million, valuing the company at $1.3 billion. Some of their competitors have been purchased recently, VictorOps by Splunk for $120 million and OpsGenie by Atlassian for $295 million. There are not many independents left in this space beyond PagerDuty and xMatters(who recently picked up Series D financing, total raised $96.5 million).
- PingCap raises $50m in Series C funding. They are behind TiDB and TiKV. Raised a total of $72 million, and this is a significant increase from the $15m Series B raise in June 2017!
- Tague Griffith has departed Redis Labs where he was Head of Developer Advocacy and is now at Google.
- Manyi Lu who has been in the MySQL world for a very long time, leading much of the changes in the MySQL optimizer, who was most recently Director of Software Development at Oracle has departed to be a Senior Director at Alicloud.
Upcoming Appearances
- db tech showcase Tokyo 2018 – 19-21 September 2018
- Open Source Summit Europe 2018 – 22-24 October 2018
Feedback
I look forward to feedback/tips via e-mail at colin.charles@percona.com or on Twitter @bytebot.
The post This Week in Data With Colin Charles 52: London MySQL Meetup appeared first on Percona Database Performance Blog.
↧
↧
JSON_TABLE – The Best of Both Worlds
One of the new JSON functions in MySQL 8.0 is JSON_TABLE. It is also MySQL’s first table function. That is, the return value is not a scalar value, but a result set. JSON_TABLE will convert (part of) a JSON document into a relational table.…
↧
MySQL Document Store building Index Search
MySQL Document Store Building Index Search
This is a tutorial to go through setting Up MySQL 8.0 Document Store, Importing World_x Sample database and building GENERATED COLUMN with Index and lastly to show the QUERY PLAN using collection.find() that uses the INDEX built.
INSTALLATION Pre-requisite
1. MySQL 8.0.11+
2. MySQL Shell 8.0.11+
3. Download Sample Database "world_x database" from https://dev.mysql.com/doc/index-other.html
![]()
MySQL Database Initialization
Using --initialize-insecure for this tutorial which means it initializes a database with empty password for root@localhost user.
Assuming we have 'mysql', 'mysqld' setup properly.
mysqld --initialize-insecure --datadir=<data directory>
![]()
Create my.cnf (example E:/temp/data1/my.cnf)
![]()
Startup MySQL Server
![]()
Connecting to MySQL Server
Using "mysql" client, connect to Server "3306"
# mysql -uroot -h127.0.0.1 -P3306
![]()
Import world_x database to MySQL Server
Assuming we have downloaded the 'world_x database' and unzipped.
Using "source <the world_x SQL file from the download>"
![]()
![]()
Showing the database and Tables
Command> show databases;
Command> show tables;
![]()
Listing the content of the Document (countryinfo) using SQL
COMMAND> select count(*) from countryinfo;
COMMAND> select * from countryinfo limit 2;
![]()
The Table Structure of the countryinfo is as follows
![]()
Create GENERATED COLUMN myname referring to the Document "$.Name"
COMMAND> alter table world_x.countryinfo add column myname varchar(100) generated always as (doc->>'$.Name');
![]()
Create an INDEX on the GENERATED COLUMN
COMMAND> use world_x;
COMMAND> create index countryinfo_myname on countryinfo (myname);
![]()
Turn On GENERAL LOG for MySQL Server
COMMAND> set global general_log=true;
![]()
Using MySQL Shell to connect to the MySQL Server (3306) and Retrieve the Collection 'countryinfo'
1. CONNECTING to defaultt portx (X-Protocol) 33060 for 3306 MySQL Server
![]()
2. Switch CURRENT db to world_x
MySQL SHELL Command> \use world_x
![]()
3. List COLLECTIONS
The "db" variables is defined as CURRENT Schema.
MySQL SHELL Command> db.getCollections()
![]()
4. Retrieve Document from COLLECTION 'countryinfo' [Only showing 1 documents]
MySQL SHELL Command> db.countryinfo.find().limit(1)
![]()
4. Retrieve Document with CRITERIA " Name='Aruba' "
MySQL SHELL Command> db.countryinfo.find(" $.Name='Aruba' ")
![]()
5. Check the GENERAL Log on MySQL Server
GENERAL LOG : Under the DataDir folder, there is a <hostname>.log
The SQL statements were logged while MySQL Shell was executing collecction retrieval.
![]()
6. Explain the Query Plan due to the db.countryinfo.find( " $.Name='Acruba' ")
SQL COMMAND> explain SELECT doc FROM `world_x`.`countryinfo` WHERE (JSON_EXTRACT(doc,'$.Name') = 'Aruba')
![]()
The COLLECTION Retrieval "find" statement is able to take the index created from the GENERATED COLUMN.
VISUALLY, we can also see QUERY PLAN in MySQL WORKBENCH as follows
![]()
This is a tutorial to go through setting Up MySQL 8.0 Document Store, Importing World_x Sample database and building GENERATED COLUMN with Index and lastly to show the QUERY PLAN using collection.find() that uses the INDEX built.
INSTALLATION Pre-requisite
1. MySQL 8.0.11+
2. MySQL Shell 8.0.11+
3. Download Sample Database "world_x database" from https://dev.mysql.com/doc/index-other.html

MySQL Database Initialization
Using --initialize-insecure for this tutorial which means it initializes a database with empty password for root@localhost user.
Assuming we have 'mysql', 'mysqld' setup properly.
mysqld --initialize-insecure --datadir=<data directory>

Create my.cnf (example E:/temp/data1/my.cnf)

Startup MySQL Server

Connecting to MySQL Server
Using "mysql" client, connect to Server "3306"
# mysql -uroot -h127.0.0.1 -P3306

Import world_x database to MySQL Server
Assuming we have downloaded the 'world_x database' and unzipped.
Using "source <the world_x SQL file from the download>"


Showing the database and Tables
Command> show databases;
Command> show tables;

Listing the content of the Document (countryinfo) using SQL
COMMAND> select count(*) from countryinfo;
COMMAND> select * from countryinfo limit 2;

The Table Structure of the countryinfo is as follows

Create GENERATED COLUMN myname referring to the Document "$.Name"
COMMAND> alter table world_x.countryinfo add column myname varchar(100) generated always as (doc->>'$.Name');

Create an INDEX on the GENERATED COLUMN
COMMAND> use world_x;
COMMAND> create index countryinfo_myname on countryinfo (myname);

Turn On GENERAL LOG for MySQL Server
COMMAND> set global general_log=true;

Using MySQL Shell to connect to the MySQL Server (3306) and Retrieve the Collection 'countryinfo'
1. CONNECTING to defaultt portx (X-Protocol) 33060 for 3306 MySQL Server

2. Switch CURRENT db to world_x
MySQL SHELL Command> \use world_x

3. List COLLECTIONS
The "db" variables is defined as CURRENT Schema.
MySQL SHELL Command> db.getCollections()

4. Retrieve Document from COLLECTION 'countryinfo' [Only showing 1 documents]
MySQL SHELL Command> db.countryinfo.find().limit(1)

4. Retrieve Document with CRITERIA " Name='Aruba' "
MySQL SHELL Command> db.countryinfo.find(" $.Name='Aruba' ")

5. Check the GENERAL Log on MySQL Server
GENERAL LOG : Under the DataDir folder, there is a <hostname>.log
The SQL statements were logged while MySQL Shell was executing collecction retrieval.

6. Explain the Query Plan due to the db.countryinfo.find( " $.Name='Acruba' ")
SQL COMMAND> explain SELECT doc FROM `world_x`.`countryinfo` WHERE (JSON_EXTRACT(doc,'$.Name') = 'Aruba')

The COLLECTION Retrieval "find" statement is able to take the index created from the GENERATED COLUMN.
VISUALLY, we can also see QUERY PLAN in MySQL WORKBENCH as follows

↧
Analytical Databases
For various reasons, I’ve become interested in analytical databases. These are traditionally called OLAP (online analytics processing) and are designed to extract insights from very large datasets, often with expectations of long response times (hours). More recently, though, various databases capable of running relatively interactive queries over large datasets have emerged. This post is more-or-less a list of analytic databases, with somewhat of a taxonomy added.
As with any list of this type, categories are inexact, and I’m sure this is only partial. I’m making some value judgments about what to mention and what to omit; this is mostly guided by my intuition. However, if you think I should list something I’ve left out, please let me know. I may have simply failed to think of it, so omission shouldn’t be considered a negative opinion! I welcome your feedback and suggestions.
Traditional Analytics Databases
These are the canonical names in the previous generation of big data analytics, and are still widely deployed and in many cases regarded as the gold standard in various ways.
Open-Source Analytics Databases
These databases aren’t easy to group into other categories for one reason or another, but all are open source. (Note that many of the databases in other categories are also open source.)
- MariaDB ColumnStore (formerly InfiniDB)
- Clickhouse
- LocustDB
GPU-Accelerated Databases
At the vanguard of hardware-accelerated databases, GPUs are being used to speed up analytical workloads.
Hadoop / Big Data Ecosystem
The “big data” ecosystem includes a number of databases designed for analytics and BI workloads. At their simplest, these can be seen as access layers over massive datasets stored in distributed filesystems, especially columnar storage layouts such as Parquet and Arrow. Some, however, are more distant from the raw bytes, such as Presto, which is more of a query engine than a database.
NoSQL and Multi-Model Analytics Databases
Most NoSQL databases don’t really fall into the analytics category, but some are used for analytics purposes regardless.
Time Series Databases
Time series is often a simpler case of full-fledged analytics, with some limitations on the complexity of queries and use cases.
Cloud Analytics Databases
Custom-Built Analytics and Event Databases
Many analytics and security companies, finding nothing existing that was well suited for their purposes, have built at least part of their own analytics platforms in-house. Here are some that I’m aware of to varying levels of detail.
NewSQL Databases
Many so-called NewSQL databases are more transactional or OLTP than analytical, or otherwise blur the lines of this article, but I list them here nonetheless.
Other
- Vitess
- MonetDB
- ScaleDB
- DeepDB
- Infobright
In-Memory Data Grids
TODO
↧
Using the keyring_vault Plugin with Percona Server for MySQL 5.7

 This is the first of a two-part series on using the keyring_vault plugin with Percona Server for MySQL 5.7. The second part will walk you through on how to use Percona Xtrabackup to backup from this instance and restore to another server and set it up as a slave with keyring_vault plugin.
What is the keyring_vault plugin?
The keyring_vault is a plugin that allows the database to interface with a Hashicorp Vault server to store and secure encryption keys. The Vault server then acts as a centralized encryption key management solution which is critical for security and for compliance with various security standards.
Configuring Vault
Create SSL certificates to be used by Vault. You can use the sample ssl.conf template below to generate the necessary files.
[root@vault1 ~]# cat /etc/sslkeys/ssl.conf
[req]
distinguished_name = req_distinguished_name
x509_extensions = v3_req
prompt = no
[req_distinguished_name]
C = US
ST = NC
L =  R
O = Percona
CN = *
[v3_req]
subjectKeyIdentifier = hash
authorityKeyIdentifier = keyid,issuer
basicConstraints = CA:TRUE
subjectAltName = @alt_names
[alt_names]
IP = 192.168.0.114
Then run the two commands below to generated the cert and key files and the certificate chain:
$ openssl req -config ssl.conf -x509 -days 365 -batch -nodes -newkey rsa:2048 -keyout vault.key -out vault.crt
$ cat vault.key vault.crt > vault.pem
Once the SSL certificates are created start Vault with the sample configuration below. Take note that you should follow the suggested best practices when deploying Vault in production, this example is to get us by with a simple working setup.
[root@vault1 ~]# cat /etc/vault.hcl
listener "tcp" {
address = "192.168.0.114:8200"
tls_cert_file="/etc/sslkeys/vault.crt"
tls_key_file="/etc/sslkeys/vault.key"
}
storage "file" {
path = "/var/lib/vault"
}
Assuming Vault started up fine and you are able to unseal Vault, the next step is to create the policy file. For more details on initializing and unsealing Vault please read the manual here.
[root@vault1 ~]# cat /etc/vault/policy/dc1.hcl
path "secret/*" {
capabilities = ["list"]
}
path "secret/dc1/*" {
capabilities = ["create", "read", "delete", "update", "list"]
}
Create a Vault policy named dc1-secrets using the dc1.hcl file like this:
[root@vault1 ~]# vault policy write dc1-secrets /etc/vault/policy/dc1.hcl -ca-cert=/etc/sslkeys/vault.pem
Success! Uploaded policy: dc1-secrets
Next, create a token associated with the newly created policy:
[root@vault1 ~]# vault token create -policy=dc1-secrets -ca-cert=/etc/sslkeys/vault.pem > dc1-token
[root@vault1 ~]# cat dc1-token
Key                  Value
---                  -----
token                be515093-b1a8-c799-b237-8e04ea90ad7a
token_accessor       4c1ba5c5-3fed-e9bb-d230-5bf1392e2d7e
token_duration       8760h
token_renewable      true
token_policies       ["dc1-secrets" "default"]
identity_policies    []
policies             ["dc1-secrets" "default"]
Setting up MySQL
The following instructions should work starting from Percona Server for MySQL 5.7.20-18 and through later versions.
Configure my.cnf with the following variables:
early-plugin-load="keyring_vault=keyring_vault.so"
loose-keyring_vault_config="/var/lib/mysql-keyring/keyring_vault.conf"
encrypt_binlog=ON
innodb_encrypt_online_alter_logs=ON
innodb_encrypt_tables=ON
innodb_temp_tablespace_encrypt=ON
master_verify_checksum=ON
binlog_checksum=CRC32
log_bin=mysqld-bin
binlog_format=ROW
server-id=1
log-slave-updates
Create the keyring_vault.conf file in the path above with the following contents:
[root@mysql1 ~]# cat /var/lib/mysql-keyring/keyring_vault.conf
vault_url = https://192.168.0.114:8200
secret_mount_point = secret/dc1/master
token = be515093-b1a8-c799-b237-8e04ea90ad7a
vault_ca = /etc/vault_ca/vault.pem
Here we are using the vault.pem file generated by combining the vault.crt and vault.key files. Observe that our secret_mount_point is secret/dc1/master. We want to make sure that this mount point is unique across all servers, this is in fact advised in the manual here.
Ensure that the CA certificate is owned by mysql user:
[root@mysql1 ~]# ls -la /etc/vault_ca/
total 24
drwxr-xr-x  2 mysql mysql   41 Jul 14 11:39 .
drwxr-xr-x 63 root  root  4096 Jul 14 13:17 ..
-rw-------  1 mysql mysql 1139 Jul 14 11:39 vault.pem
Initialize the MySQL data directory on the Master:
[root@mysql1 ~]# mysqld --initialize-insecure --datadir=/var/lib/mysql --user=mysql
For production systems we do not recommend using --initialize-insecure option, this is just to skip additional steps in this tutorial.
Finally, start mysqld instance and then test the setup by creating an encrypted table.
[root@mysql1 ~]# systemctl status mysqld
● mysqld.service - MySQL Server
Loaded: loaded (/usr/lib/systemd/system/mysqld.service; disabled; vendor preset: disabled)
Active: active (running) since Sat 2018-07-14 23:53:16 UTC; 2s ago
Docs: man:mysqld(8)
http://dev.mysql.com/doc/refman/en/using-systemd.html
Process: 1401 ExecStart=/usr/sbin/mysqld --daemonize --pid-file=/var/run/mysqld/mysqld.pid $MYSQLD_OPTS (code=exited, status=0/SUCCESS)
Process: 1383 ExecStartPre=/usr/bin/mysqld_pre_systemd (code=exited, status=0/SUCCESS)
Main PID: 1403 (mysqld)
CGroup: /system.slice/mysqld.service
└─1403 /usr/sbin/mysqld --daemonize --pid-file=/var/run/mysqld/mysqld.pid
Jul 14 23:53:16 mysql1 systemd[1]: Starting MySQL Server...
Jul 14 23:53:16 mysql1 systemd[1]: Started MySQL Server.
At this point you should have Percona Server for MySQL instance with tablespace encryption using Vault.
Researching database security?
You might also enjoy this pre-recorded webinar securing your database servers from external attacks presented by my colleague Colin Charles.
The post Using the keyring_vault Plugin with Percona Server for MySQL 5.7 appeared first on Percona Database Performance Blog.
↧
↧
Become a ClusterControl DBA: Performance and Health Monitoring

In the previous two blog posts we covered both deploying the four types of clustering/replication (MySQL/Galera, MySQL Replication, MongoDB & PostgreSQL) and managing/monitoring your existing databases and clusters. So, after reading these two first blog posts you were able to add your 20 existing replication setups to ClusterControl, expand them and additionally deployed two new Galera clusters while doing a ton of other things. Or maybe you deployed MongoDB and/or PostgreSQL systems. So now, how do you keep them healthy?
That’s exactly what this blog post is about: how to leverage ClusterControl performance monitoring and advisors functionality to keep your MySQL, MongoDB and/or PostgreSQL databases and clusters healthy. So how is this done in ClusterControl?
Database Cluster List
The most important information can already be found in the cluster list: as long as there are no alarms and no hosts are shown to be down, everything is functioning fine. An alarm is raised if a certain condition is met, e.g. host is swapping, and brings to your attention the issue you should investigate. That means that alarms not only are raised during an outage but also to allow you to proactively manage your databases.
Suppose you would log into ClusterControl and see a cluster listing like this, you will definitely have something to investigate: one node is down in the Galera cluster for example and every cluster has various alarms:
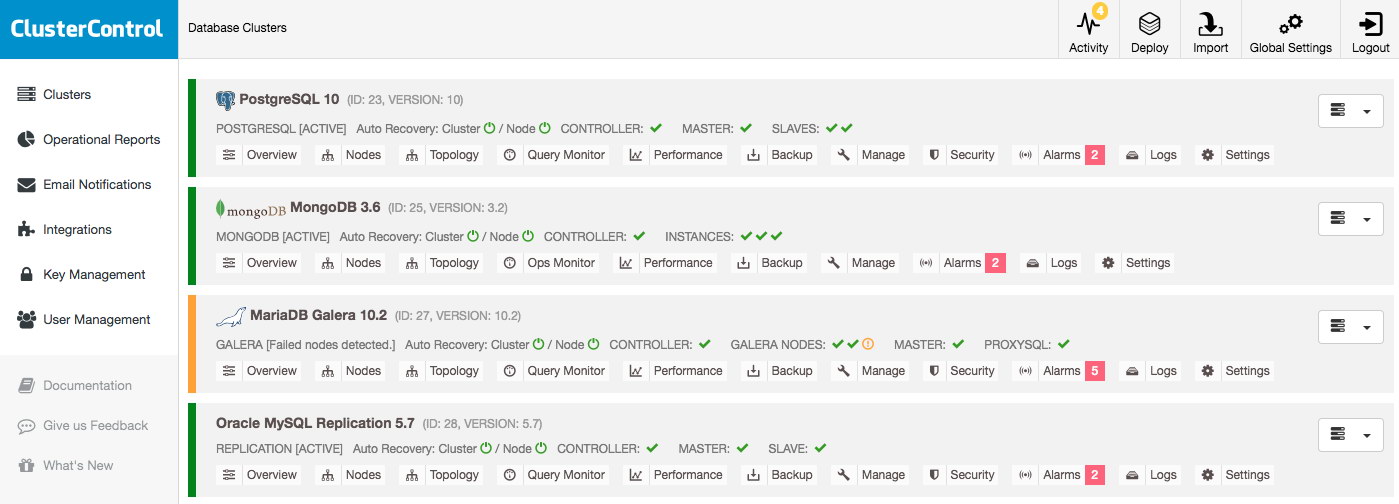
Once you click on one of the alarms, you will go to a detailed page on all alarms of the cluster. The alarm details will explain the issue and in most cases also advise the action to resolve the issue.
You can set up your own alarms by creating custom expressions, but that has been deprecated in favor of our new Developer Studio that allows you to write custom Javascripts and execute these as Advisors. We will get back to this topic later in this post.
Cluster Overview - Dashboards
When opening up the cluster overview, we can immediately see the most important performance metrics for the cluster in the tabs. This overview may differ per cluster type as, for instance, Galera has different performance metrics to watch than traditional MySQL, PostgreSQL or MongoDB.
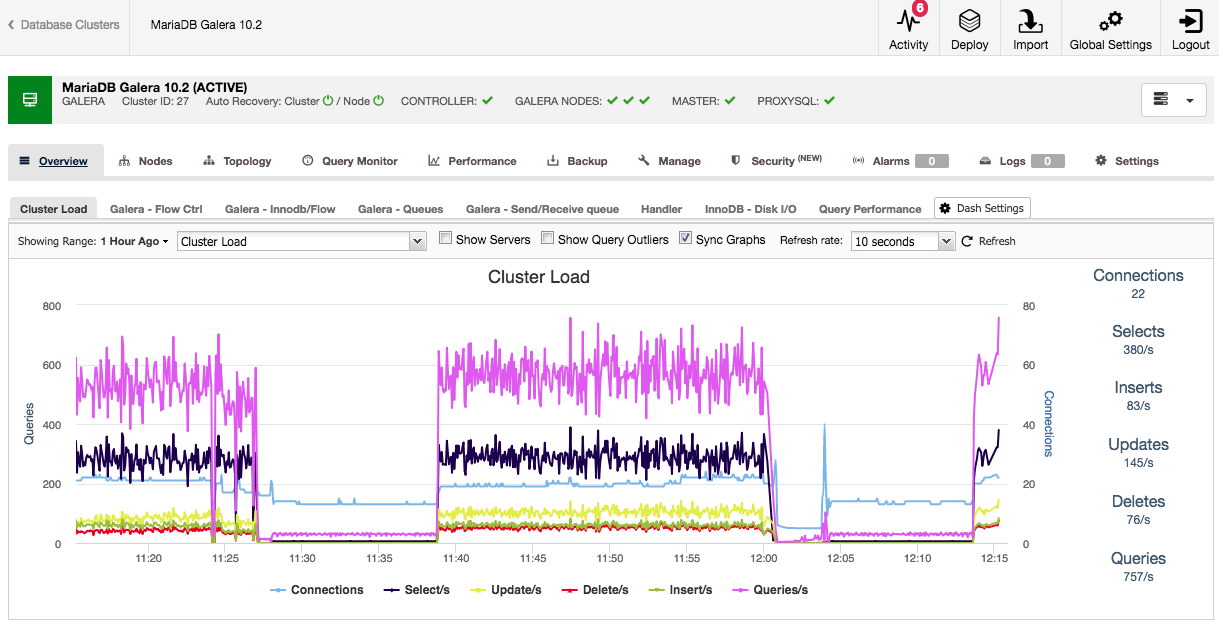
Both the default overview and the pre-selected tabs are customizable. By clicking on Overview -> Dash Settings you are given a dialogue that allows you to define the dashboard:
By pressing the plus sign you can add and define your own metrics to graph the dashboard. In our case we will define a new dashboard featuring the Galera specific send and receive queue average:
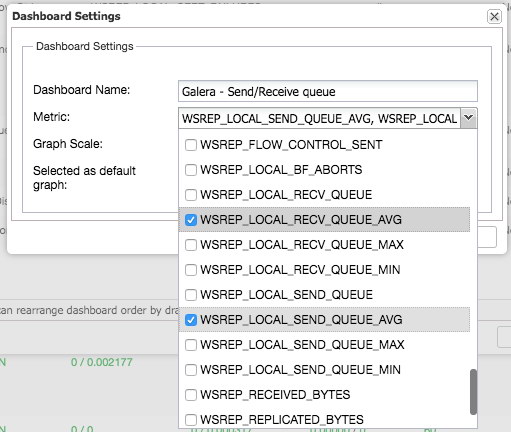
This new dashboard should give us good insight in the average queue length of our Galera cluster.
Once you have pressed save, the new dashboard will become available for this cluster:
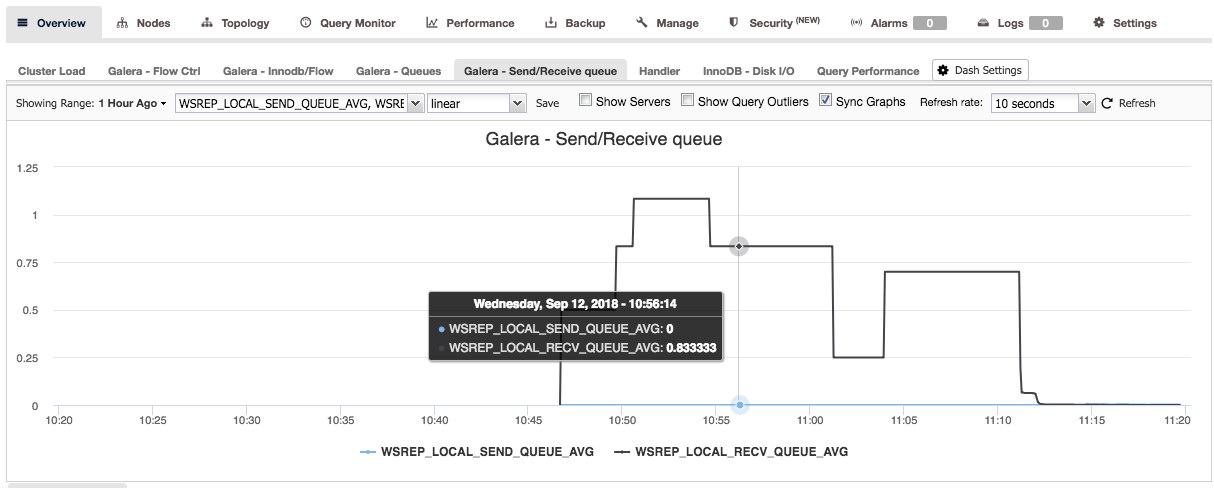
Similarly you can do this for PostgreSQL as well, for example we can monitor the shared blocks hit versus blocks read:
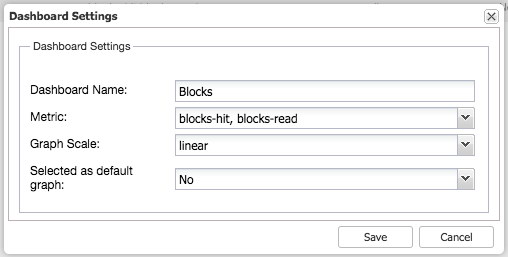
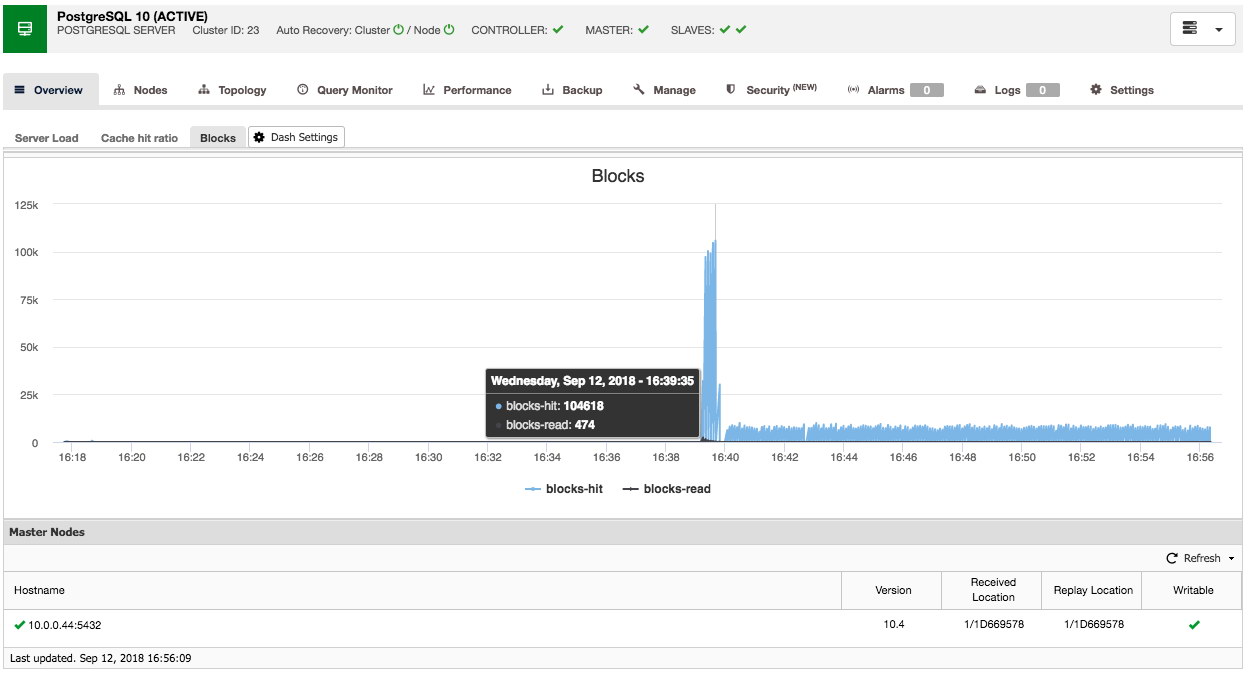
So as you can see, it is relatively easy to customize your own (default) dashboard.
Cluster Overview - Query Monitor
The Query Monitor tab is available for both MySQL and PostgreSQL based setups and consists out of three dashboards: Top Queries, Running Queries and Query Outliers.
In the Running Queries dashboard, you will find all current queries that are running. This is basically the equivalent of SHOW FULL PROCESSLIST statement in MySQL database.
Top Queries and Query Outliers both rely on the input of the slow query log or Performance Schema. Using Performance Schema is always recommended and will be used automatically if enabled. Otherwise, ClusterControl will use the MySQL slow query log to capture the running queries. To prevent ClusterControl from being too intrusive and the slow query log to grow too large, ClusterControl will sample the slow query log by turning it on and off. This loop is by default set to 1 second capturing and the long_query_time is set to 0.5 seconds. If you wish to change these settings for your cluster, you can change this via Settings -> Query Monitor.
Top Queries will, like the name says, show the top queries that were sampled. You can sort them on various columns: for instance the frequency, average execution time, total execution time or standard deviation time:
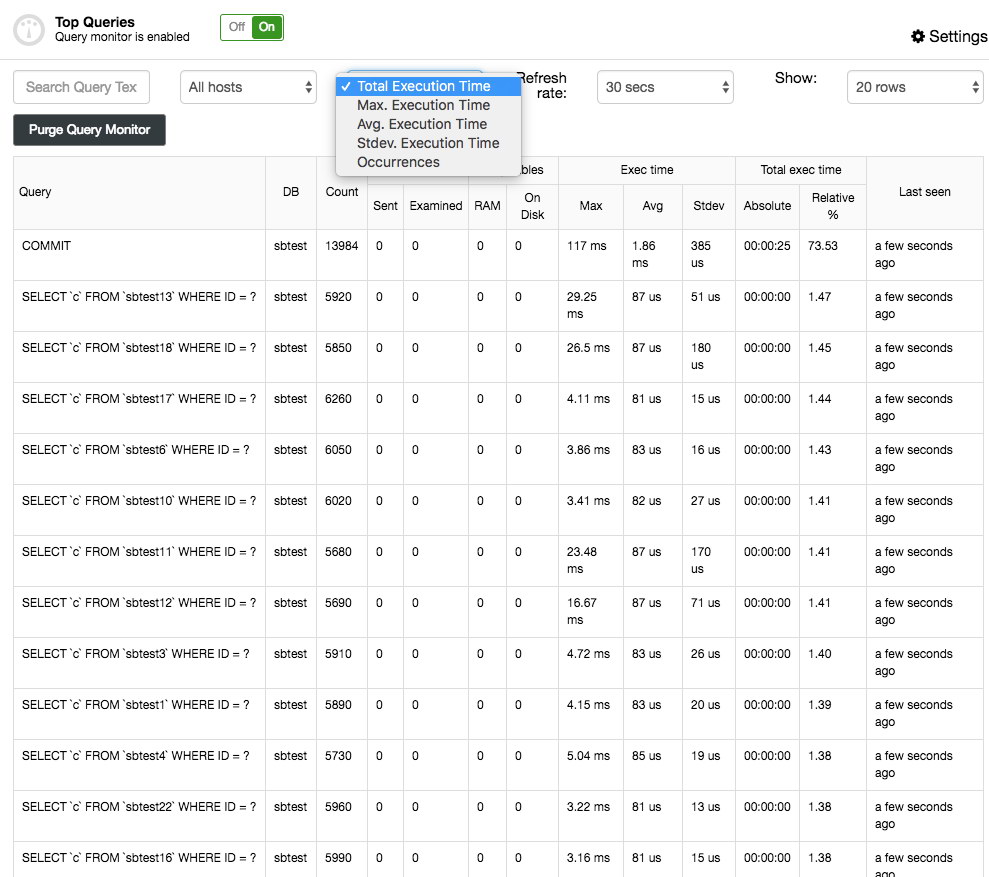
You can get more details about the query by selecting it and this will present the query execution plan (if available) and optimization hints/advisories. The Query Outliers is similar to the Top Queries but then allows you to filter the queries per host and compare them in time.
ClusterControl
Single Console for Your Entire Database Infrastructure
Find out what else is new in ClusterControl
Cluster Overview - Operations
Similar to the PostgreSQL and MySQL systems the MongoDB clusters have the Operations overview and is similar to the MySQL's Running Queries. This overview is similar to issuing the db.currentOp() command within MongoDB.
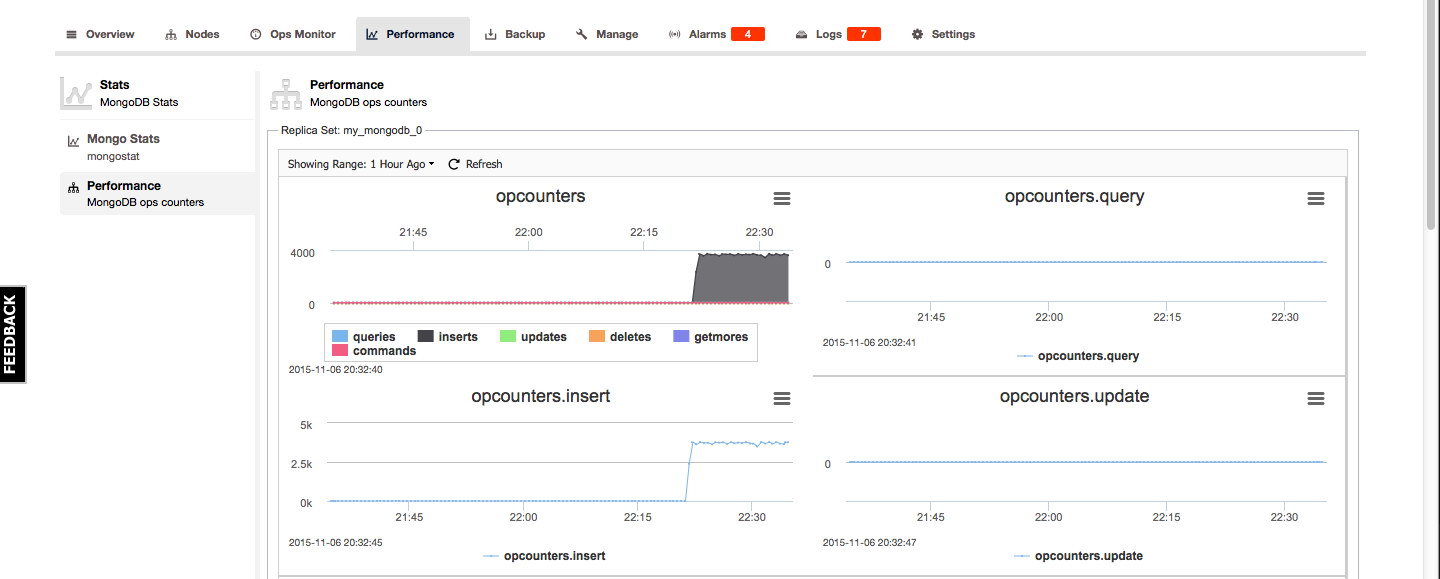
Cluster Overview - Performance
MySQL/Galera
The performance tab is probably the best place to find the overall performance and health of your clusters. For MySQL and Galera it consists of an Overview page, the Advisors, status/variables overviews, the Schema Analyzer and the Transaction log.
The Overview page will give you a graph overview of the most important metrics in your cluster. This is, obviously, different per cluster type. Eight metrics have been set by default, but you can easily set your own - up to 20 graphs if needed:
The Advisors is one of the key features of ClusterControl: the Advisors are scripted checks that can be run on demand. The advisors can evaluate almost any fact known about the host and/or cluster and give its opinion on the health of the host and/or cluster and even can give advice on how to resolve issues or improve your hosts!
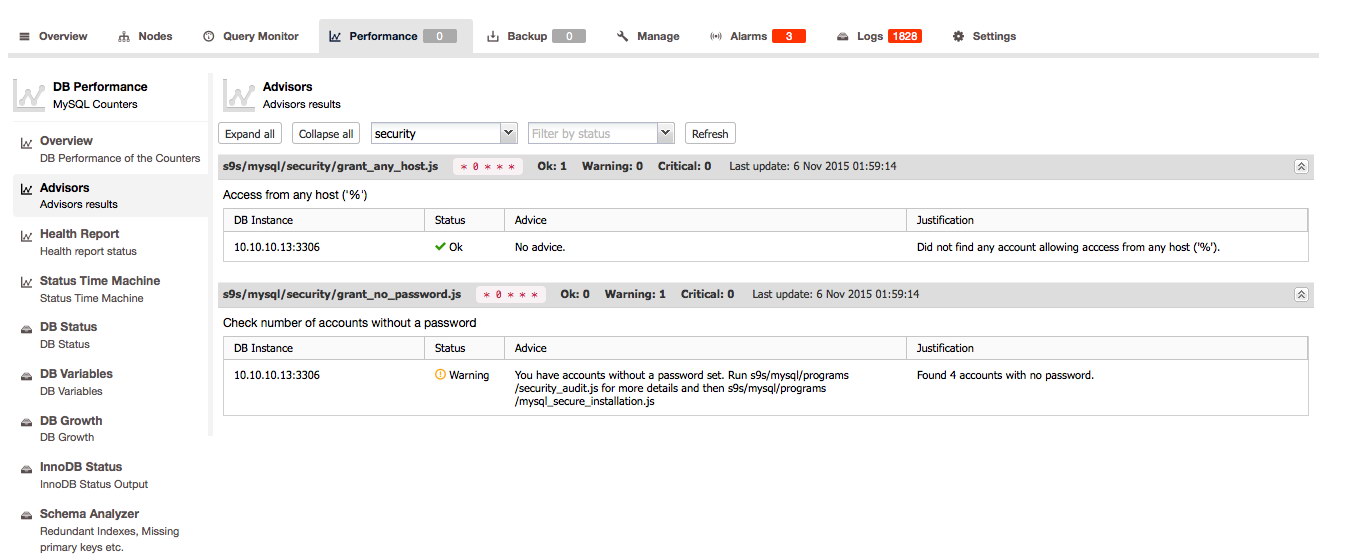
The best part is yet to come: you can create your own checks in the Developer Studio (ClusterControl -> Manage -> Developer Studio), run them on a regular interval and use them again in the Advisors section. We blogged about this new feature earlier this year.
We will skip the status/variables overview of MySQL and Galera as this is useful for reference but not for this blog post: it is good enough that you know it is here.
Now suppose your database is growing but you want to know how fast it grew in the past week. You can actually keep track of the growth of both data and index sizes from right within ClusterControl:
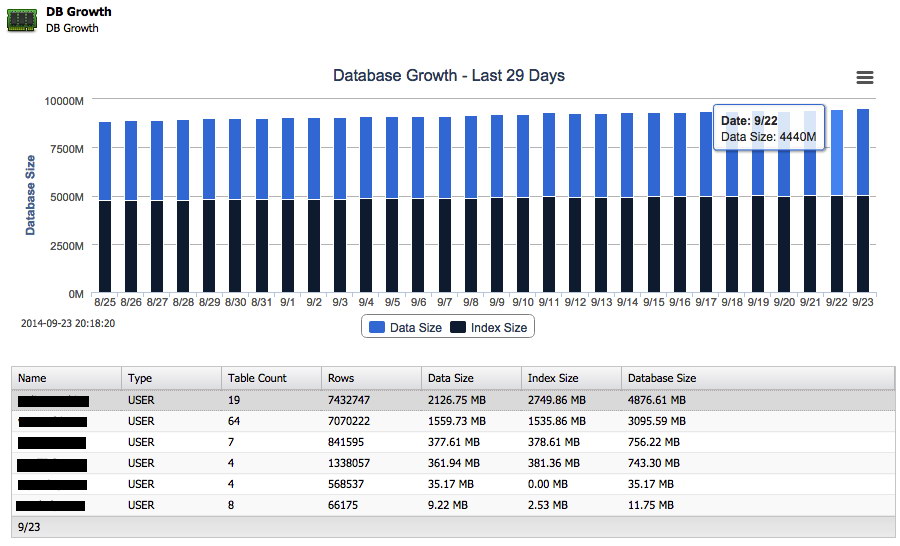
And next to the total growth on disk it can also report back the top 25 largest schemas.
Another important feature is the Schema Analyzer within ClusterControl:
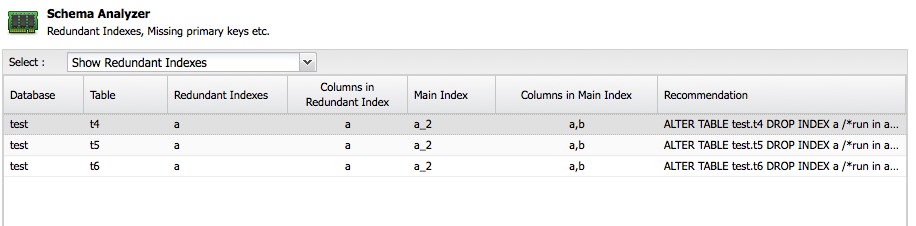
ClusterControl will analyze your schemas and look for redundant indexes, MyISAM tables and tables without a primary key. Of course it is entirely up to you to keep a table without a primary key because some application might have created it this way, but at least it is great to get the advice here for free. The Schema Analyzer even recommends the necessary ALTER statement to fix the problem.
PostgreSQL
For PostgreSQL the Advisors, DB Status and DB Variables can be found here:
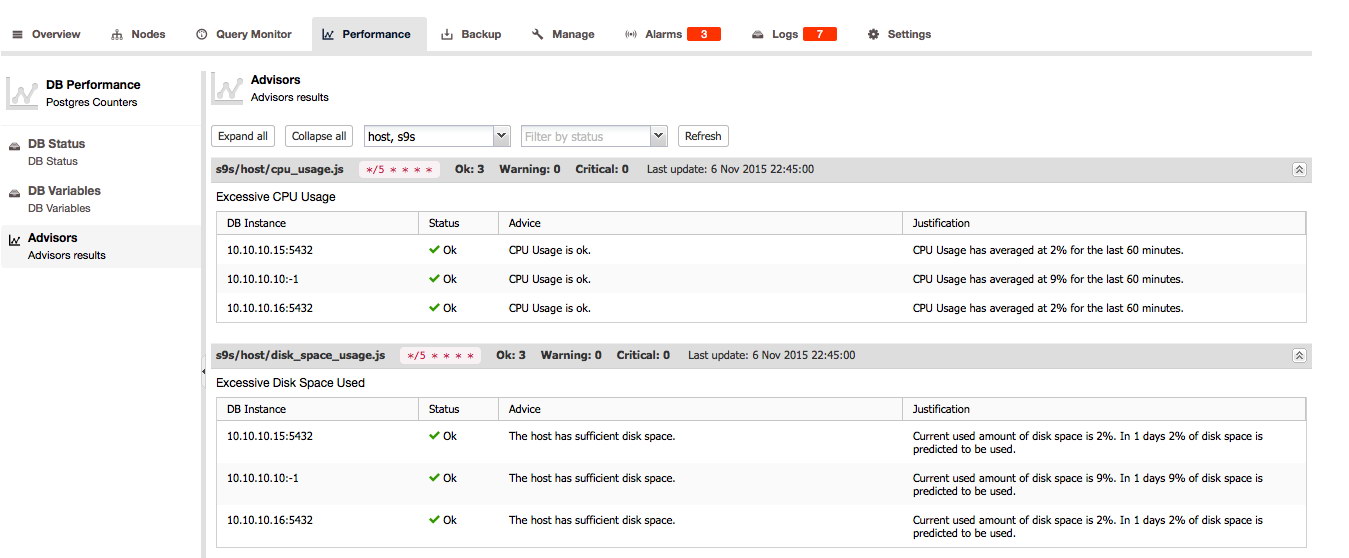
MongoDB
For MongoDB the Mongo Stats and performance overview can be found under the Performance tab. The Mongo Stats is an overview of the output of mongostat and the Performance overview gives a good graphical overview of the MongoDB opcounters:
Final Thoughts
We showed you how to keep your eyeballs on the most important monitoring and health checking features of ClusterControl. Obviously this is only the beginning of the journey as we will soon start another blog series about the Developer Studio capabilities and how you can make most of your own checks. Also keep in mind that our support for MongoDB and PostgreSQL is not as extensive as our MySQL toolset, but we are continuously improving on this.
You may ask yourself why we have skipped over the performance monitoring and health checks of HAProxy, ProxySQL and MaxScale. We did that deliberately as the blog series covered only deployments of clusters up till now and not the deployment of HA components. So that’s the subject we'll cover next time.
↧
Authenticating MySQL 8.0 (Enterprise) against active directory
Recently our team was tasked to implement MySQL 8.0 in production for a client. While MySQL 8.0 is looking very promising and has a lot of cool new features and revamped old features, it’s still pretty young. The MySQL development team is working very hard on stabilizing the product but, reading the latest release notes for version 8.0.12, it is still very much a bugfix release and not something you will want to put in production immediately. Also, given the fact that a lot of tools such as Percona Xtrabackup do not support MySQL 8.0 yet, we were a bit reluctant to proceed with this idea. But … the client had a strong use case to make use of roles and resource groups and we like challenges so we decided to give it a go.
Another use case that was presented is the one where they wanted to authenticate against Active Directory. Where Active Directory can be used as an LDAP server, we notified the client that in order to use the LDAP pluggable authentication plugin, we would need to use the enterprise version of MySQL which includes this particular plugin. Having this enterprise subscription immediately fixed our backup issue, as this would allow us to use MySQL Enterprise Backup as our primary backup solution.
So we got started. And pretty soon we found out that we were not going to be able to use the secure version of this plugin: authentication_ldap_sasl. This plugin only supports the SCRAM-SHA-1 authentication method and this is (currently) not supported by Active Directory. The authentication_ldap_simple plugin does work but this will send the user’s passwords in plaintext to the Active Directory domain controller. This solution got a well-deserved no-go from the client’s security team. Back to the drawing board it was…
A few other options, including SSH-tunnels to the domain controller, were evaluated but none of the options were considered to be suitable for use in the production environment.
While analyzing the issue I came across another MySQL Enterprise’s pluggable authentication plugins, the PAM pluggable authentication plugin. The manual for this plugin states the following: “MySQL Enterprise Edition supports an authentication method that enables MySQL Server to use PAM (Pluggable Authentication Modules) to authenticate MySQL users. PAM enables a system to use a standard interface to access various kinds of authentication methods, such as Unix passwords or an LDAP directory”. Mmmm…. LDAP… let’s try this.
Join server to Active Directory.
In order for this plugin to work, we need to configure the local PAM system to use Active Directory as an authentication source. We are using CentOS 7 for this installation, so a little bit of Googling landed me on this blog post. We were to join our Linux server into the Active Directory domain. (For other Linux distributions, methods to achieve this can be found online, for example, Ubuntu Xenial.)
The blog told us to install some packages (the list provided in the blog was longer, but the list below is sufficient to get the job done):
yum install sssd realmd oddjob oddjob-mkhomedir adcli samba-common-tools -y
A prerequisite to joining the server to the Active Directory domain is that you should be able to at least resolve the domain. Maybe you can try to ping it if the domain controller’s firewall accepts ICMP requests:
# ping domain.local
PING domain.local (x.x.x.x) 56(84) bytes of data.
64 bytes from dc1.domain.local (x.x.x.x): icmp_seq=1 ttl=128 time=0.444 ms
64 bytes from dc1.domain.local (x.x.x.x): icmp_seq=2 ttl=128 time=0.499 ms
64 bytes from dc1.domain.local (x.x.x.x): icmp_seq=3 ttl=128 time=0.569 ms
64 bytes from dc1.domain.local (x.x.x.x): icmp_seq=4 ttl=128 time=0.643 ms
64 bytes from dc1.domain.local (x.x.x.x): icmp_seq=5 ttl=128 time=0.640 ms
64 bytes from dc1.domain.local (x.x.x.x): icmp_seq=6 ttl=128 time=0.515 ms
^C
--- domain.local ping statistics ---
6 packets transmitted, 6 received, 0% packet loss, time 5001ms
rtt min/avg/max/mdev = 0.444/0.551/0.643/0.078 ms
The domain resolves and the domain controller responds to our pings which is good. If this is not working for you, check with your domain or network administrator to find out what is the correct DNS server for the AD domain.
Now that everything seems okay, we can attempt to join our server to this domain:
# realm join --user=administrator domain.local
Password for administrator:
To be able to join a server to an Active Directory domain, you may require some elevated privileges. The default configuration is that any authenticated user can join up to 10 machines to the domain. In my test environment, I am the only admin so I used my administrator account for simplicity, even though this is not a best practice. Don’t go shouting at your domain admins that you need the password for the administrator account, because they will likely not give it to you…
Warning: the maximum length of a computer name in Active Directory is 15 characters. So make sure your server hostname is not exceeding that length. Active Directory will allow you to join the host to the domain but it will just chop off the hostname at 15 characters. This might cause problems with multiple hosts trying to use the same computer account because the difference in hostname was only visible after the 15th char (ex: myapp-mysql-server-01 will be chopped to myapp-mysql-ser). If you see errors like the following in your /var/log/messages file, it might be that your computer account was changed, possibly by an issue like this.
[sssd[ldap_child[12104]]]: Failed to initialize credentials using keytab [MEMORY:/etc/krb5.keytab]: Preauthentication failed. Unable to create GSSAPI-encrypted LDAP connection.
To verify if you successfully joined your server to the domain, you can run:
# realm list
domain.local
type: kerberos
realm-name: DOMAIN.LOCAL
domain-name: domain.local
configured: kerberos-member
server-software: active-directory
client-software: sssd
required-package: oddjob
required-package: oddjob-mkhomedir
required-package: sssd
required-package: adcli
required-package: samba-common-tools
login-formats: %U
login-policy: allow-realm-logins
Note the “required-package” entries in this command output. These are the packages that we installed just a bit earlier.
At this point, our server can talk kerberos to the domain (controller), and we are able to search for our domain users
# id administrator
id: administrator: no such user

# id administrator@domain.local
uid=1829600500(administrator@domain.local) gid=1829600513(domain users@domain.local) groups=1829600513(domain users@domain.local),1829600512(domain admins@domain.local),1829600572(denied rodc password replication group@domain.local),1829600519(enterprise admins@domain.local),1829600518(schema admins@domain.local),1829600520(group policy creator owners@domain.local)
We don’t want the user to have to specify the fully qualified domain name so we edit the /etc/sssd/sssd.conf file. We update following entries:
use_fully_qualified_names = True
fallback_homedir = /home/%u@%d
To
use_fully_qualified_names = False
fallback_homedir = /home/%u
And we restart the sssd service:
# systemctl restart sssd
Now we don’t need to specify the FQDN anymore:
# id administrator
uid=1829600500(administrator gid=1829600513(domain users) groups=1829600513(domain users),1829600512(domain admins),1829600572(denied rodc password replication group),1829600519(enterprise admins),1829600518(schema admins),1829600520(group policy creator owners)
We can now use this active directory user to log in to the server:
$ ssh administrator@server
administrator@server’s password:
Creating home directory for administrator.
Even though I am currently logged in with the domain admin account, this account will not get elevated privileges. You can use the local root account to provide sudo access to the AD users for them to be able to elevate their privileges.
Now, giving the AD users access to the server command line via SSH was not part of our project scope. To limit their ability to do so, we can either change the default_shell option in the sssd.conf file to something like /bin/false or /bin/nologin. This will block any AD users from logging in. Or, if we need more control overwho will be able to use the SSH access, we can use configuration options in sshd_config like AllowGroups or AllowUsers. None of these login restrictions will interfere with what is coming next.
Back to MySQL
We drifted off a bit getting involved with our Windows colleagues to be able to join our server into their domain but now that we have successfully done that, we are able to configure our MySQL instance to authenticate against the local PAM system. The method we will be using is the simple one, where we create a MySQL user for each AD user that needs MySQL access and not through a “Proxy account”. The full description of what we will be doing can be found here.
The first step for this is to install the PAM plugin:
mysql> INSTALL PLUGIN authentication_pam SONAME 'authentication_pam.so';
Also, enable it in the my.cnf file to have it loaded on restart.
# PAM authentication plugin
plugin-load-add=authentication_pam.so
We can verify the successful loading of the plugin:
mysql> SELECT PLUGIN_NAME, PLUGIN_STATUS FROM INFORMATION_SCHEMA.PLUGINS WHERE PLUGIN_NAME LIKE '%pam%';
+--------------------+---------------+
| PLUGIN_NAME        | PLUGIN_STATUS |
+--------------------+---------------+
| authentication_pam | ACTIVE        |
+--------------------+---------------+
1 row in set (0.21 sec)
Now we can use the regular CREATE USER or GRANT syntax to create the local users:
mysql> CREATE USER '[user]'@'[host]' IDENTIFIED WITH authentication_pam AS 'mysql'
mysql> GRANT [PRIVILEGES] on [schema].[table/*] to '[user]'@'[host]' ;
I have created two test users in my testing lab:
mysql> SELECT user, host, plugin, authentication_string FROM mysql.user WHERE plugin = 'authentication_pam';
+----------+-----------+--------------------+-----------------------+
| user     | host      | plugin             | authentication_string |
+----------+-----------+--------------------+-----------------------+
| mcrauwel | %         | authentication_pam | mysql                 |
| mtest    | localhost | authentication_pam | mysql                 |
+----------+-----------+--------------------+-----------------------+
2 rows in set (0.00 sec)
Notice that the authentication_string mentions “mysql“. This value points to a PAM service we still have to create.
The MySQL manual provides us with the required service configuration. For our Centos machine, we need to create the service file in /etc/pam.d/mysql with the following content:
#%PAM-1.0
auth            include         password-auth
account         include         password-auth
For other OS distributions, there might be some different format required. Check the manual for more details.
And that is it for the MySQL configuration part. We are now able to login with the newly created AD user.
# mysql -u mcrauwel -p --enable-cleartext-plugin
Enter password:
Welcome to the MySQL monitor.  Commands end with ; or \g.
Your MySQL connection id is 49
Server version: 8.0.12-commercial MySQL Enterprise Server - Commercial

Copyright (c) 2000, 2018, Oracle and/or its affiliates. All rights reserved.

Oracle is a registered trademark of Oracle Corporation and/or its
affiliates. Other names may be trademarks of their respective
owners.

Type 'help;' or '\h' for help. Type '\c' to clear the current input statement.

mysql> \s
--------------
mysql  Ver 8.0.12-commercial for Linux on x86_64 (MySQL Enterprise Server - Commercial)

Connection id:		49
Current database:
Current user:		mcrauwel@localhost
SSL:			Not in use
Current pager:		stdout
Using outfile:		''
Using delimiter:	;
Server version:		8.0.12-commercial MySQL Enterprise Server - Commercial
Protocol version:	10
Connection:		Localhost via UNIX socket
Server characterset:	utf8mb4
Db     characterset:	utf8mb4
Client characterset:	utf8mb4
Conn.  characterset:	utf8mb4
UNIX socket:		/var/lib/mysql/mysql.sock
Uptime:			20 hours 48 min 20 sec

Threads: 2  Questions: 1497  Slow queries: 0  Opens: 236  Flush tables: 2  Open tables: 212  Queries per second avg: 0.019
--------------

mysql>
One important thing to note is that we have to enable the cleartext-plugin to send the password to the server. This is because MySQL needs to pass the password on to the PAM service to have it validated against AD using the Kerberos protocol. While Kerberos itself is a secure protocol, it still requires us to provide it with the plain text password for validation purposes. Therefore, it is important to have any TCP connections from the client to the server using SSL encryption to ensure our password remains secure at all times. Lucky for us, MySQL 8.0 has SSL support enabled by default. However, it is still possible to be really naughty and specify the --ssl-mode=DISABLED option to the client and MySQL 8.0 will still accept the connection and the password. There is a way to also close this loophole by enabling the require_secure_transport option:
mysql> SELECT @@require_secure_transport;
+----------------------------+
| @@require_secure_transport |
+----------------------------+
|                          0 |
+----------------------------+
1 row in set (0.00 sec)

mysql> SET GLOBAL require_secure_transport = ON;
Query OK, 0 rows affected (0.01 sec)

mysql> SELECT @@require_secure_transport;
+----------------------------+
| @@require_secure_transport |
+----------------------------+
|                          1 |
+----------------------------+
1 row in set (0.00 sec)
Now the server will not accept our insecure connection anymore:
[root@mysql ~]# mysql -u mcrauwel -p --enable-cleartext-plugin -h 127.0.0.1 --ssl-mode=DISABLED
Enter password:
ERROR 3159 (HY000): Connections using insecure transport are prohibited while --require_secure_transport=ON.
That’s it so far for our adventures with MySQL 8.0 and Active Directory authentication. I am really excited to have this first MySQL 8.0 installation going to production. The list of features to explore is gigantic and so I hope there will be more opportunities to work on (and blog about) in the future.
↧
What is the best practice to get a list of all the queries running in MySQL (processlist) ?
 If you are a MySQL DBA for a long time (like me), it’s very complicated to get rid of bad habits. One of them I really need to change is the way to retrieve the list of all the running queries (processlist).
Usually, I use SHOW FULL PROCESSLIST which is very convenient, but like querying the Information_Schema, this statement has negative performance consequences because it requires a mutex. Therefore, you should use Performance_Schema which doesn’t require a mutex and has minimal impact on server performance.
Let’s see the output of both commands:
mysql> show full processlist\G                                                                                                                   *************************** 1. row ***************************
     Id: 4
   User: event_scheduler
   Host: localhost
     db: NULL
Command: Daemon
   Time: 376338
  State: Waiting on empty queue
   Info: NULL
*************************** 2. row ***************************
     Id: 88
   User: root
   Host: localhost
     db: NULL
Command: Query
   Time: 0
  State: starting
   Info: show full processlist
2 rows in set (0.00 sec)
mysql> SELECT PROCESSLIST_ID AS id, PROCESSLIST_USER AS user, PROCESSLIST_HOST AS host,
       PROCESSLIST_DB AS db  , PROCESSLIST_COMMAND AS command, PROCESSLIST_TIME AS time,
       PROCESSLIST_STATE AS state, LEFT(PROCESSLIST_INFO, 80) AS info
       FROM performance_schema.threads
       WHERE PROCESSLIST_ID IS NOT NULL AND PROCESSLIST_COMMAND NOT IN ('Sleep', 'Binlog Dump')
       ORDER BY PROCESSLIST_TIME ASC\G
*************************** 1. row ***************************
     id: 88
   user: root
   host: localhost
     db: NULL
command: Query
   time: 0
  state: Creating sort index
   info: SELECT PROCESSLIST_ID AS id, PROCESSLIST_USER AS user, PROCESSLIST_HOST AS host,
*************************** 2. row ***************************
     id: 6
   user: NULL
   host: NULL
     db: NULL
command: Daemon
   time: 376415
  state: Suspending
   info: NULL
2 rows in set (0.00 sec)
Of course you can also see the threads in sleep is you want. However this is not very convenient, this is a long query.
Sys schema provides a nice alternative to avoid such complicate query to remember:
mysql> select * from sys.processlist where pid is not NULL\G
*************************** 1. row ***************************
                thd_id: 178
               conn_id: 88
                  user: root@localhost
                    db: sys
               command: Query
                 state: NULL
                  time: 0
     current_statement: select * from sys.processlist where pid is not NULL
     statement_latency: 56.68 ms
              progress: NULL
          lock_latency: 2.49 ms
         rows_examined: 15457
             rows_sent: 0
         rows_affected: 0
            tmp_tables: 4
       tmp_disk_tables: 2
             full_scan: YES
        last_statement: NULL
last_statement_latency: NULL
        current_memory: 1.89 MiB
             last_wait: NULL
     last_wait_latency: NULL
                source: NULL
           trx_latency: 54.19 ms
             trx_state: ACTIVE
        trx_autocommit: YES
                   pid: 32332
          program_name: mysql
1 row in set (0.06 sec)
As you can see it also provides more very useful information !
So if you want to see the processlist in a production server or if you want to monitor all the queries from the processlist output, I really encourage you to change your habits and use SYS 
↧